Open Journal of Forestry
Vol.05 No.05(2015), Article ID:56967,7 pages
10.4236/ojf.2015.55044
The Assessment of Carbon Stocks in the Oak Scrub Forest of Sheringal Valley Dir Kohistan
Alamgir Khan1, Adnan Ahmad1*, Ziaur Rahman1, Siraj-ud-Din2, Rahmatullah Qureshi3, Juma Muhammad4
1Department of Forestry, Shaheed Benazir Bhutto University Sheringal, Dir Upper, Pakistan
2Department of Botany, University of Peshawar, Peshawar, Pakistan
3Department of Botany, PMAS-Arid Agriculture University Rawalpindi, Rawalpindi, Pakistan
4Department of Environmental Sciences, Shaheed Benazir Bhutto University Sheringal, Dir Upper, Pakistan
Email: *adnanfr@sbbu.edu.pk
Copyright © 2015 by authors and Scientific Research Publishing Inc.
This work is licensed under the Creative Commons Attribution International License (CC BY).
http://creativecommons.org/licenses/by/4.0/


Received 11 April 2015; accepted 5 June 2015; published 8 June 2015
ABSTRACT
The present study estimates carbon stocks (C-stocks) of the Oak scrub forest of Sheringal valley through field inventory. Stem density (ha−1), tree height (m), basal area (m2∙ha−1), stem volume (m2∙ha−1), stem biomass (t∙ha−1), total biomass (t∙ha−1), and total C-stock (t∙ha−1), were calculated. Stem density varied between 80±8.16 to 510 ± 42 trees ha−1, with a mean value of 226 ± 7 tress ha−1. The average tree height, basal area and stem volume were 5.47 ± 0.76 m, 12.82 ± 0.25 m2∙ha−1 and 46.37 ± 0.85 m3∙ha−1 respectively. The total calculated stem biomass was 32.46 ± 0.60 t∙ha−1 and total tree biomass was 51.61 ± 0.60 t∙ha−1. The calculated C-stocks in the Oak scrub forest ranged from 2.005 ± 1.32 t∙ha−1 to 63.1 ± 3.34 t∙ha−1 and the mean C stocks was 25.80 ± 0.47 t∙ha−1. The results of the study confirmed that the Oak scrub forest acts as a valuable sink of carbon, but this valuable storage factory of carbon faced the problems of excess uses for fuel wood, forage, domestic uses (mostly for construction) and unscientific management. Proper scientific management and proper utilization of the forest can be significant measures to enhance the potential of the forest to stored and sink more carbon and can be included for CDM and REED++ under Keyto protocol.
Keywords:
Sheringal, Oak Scrub Forest, Biomass and Carbon Stocks

1. Introduction
Various human activities like land use change, fossil fuels burning, and deforestation increase the concentration of carbon dioxide in the atmosphere and cause the problem of climate change and global warming. The concentration of carbon dioxide increases from 280 ppm (pre-industrial time) to 398.79 ppm (NOAA, 2013; Sharma et al., 2011) . The IPCC in its fourth assessment report recommended for serious measure to check the problem of global warming to coup the serious ecological, social and economic consequences ( IPCC, 2007 ; Kerr, 2007; Sharma et al., 2011 ). Terrestrial ecosystem, oceans, atmosphere and geological reservoirs are main components of global carbon cycle. Among terrestrial ecosystem forest ecosystem has the significant potential to store and sink carbon and therefore globally forest are consider a potential tools to mitigate global climate change (Nabuurs et al., 2007; Sharma et al., 2010).
Forest ecosystem stores 20 to 50 more carbon as compare to other ecosystems due to its woody character and long life span ( Houghton & Heckler, 1995 ; Nabuurs et al., 2007; Sharma et al., 2010). Forest covers 31% of the total land area, about 4 billion ha of the land is covered by the forest. The total estimated growing stock of the world forest is 527 billion m3, while the total stored carbon in world forest is 650 billion tons (FAO, 2010) . Under the Keyto protocol (1997) in a forest ecosystem carbon should be measured in different carbon pools that includes carbon store in above ground biomass, below ground biomass, dead wood, litter and soil. In order to measure the carbon in a forest the biomass data of the forest is required (Esser, 1984). For the estimation of above ground biomass in a forest the growing stock volume is the required parameter (Hame et al., 1992) . Being a member of the Keyto protocol the store carbon in the different forest types of Pakistan will be evaluated. In Pakistan the forest department conducts inventory on regular basis for the measurement of the growing stock in the shape of working plan and can be used to assessed carbon stock, but these estimates can be error prone ( Nizami, 2010; Raqeeb et al., 2014) .
The present study was conducted in the Oak scrub forest (Quercus baloot Griff) of the Sheringal valley. In Pakistan Oak scrub forest is distributed in Dir, Chitral, Gilgat, and Swat. No scientific study has been conducted in Pakistan regarding the growing stock, biomass and carbon stocks measurement of the oak scrub forest. The present study provides detail information and field protocol regarding growing stock, biomass and carbon stock assessment in the Oak scrub forest. The aim and objectives of the study were to described tree height, (m), Stem density (ha−1), diameter (cm), basal area (m2∙ha−1), volume (m3∙ha−1), and biomass and carbon stock (t∙ha−1) in the Oak scrub forest of Sheringal valley.
2. Materials and Methods
2.1. Study Site
The present study was carried out in Oak scrub forest (Quercus baloot Griff) of the Sheringal valley. Sheringal valley is situated in the North East of District Dir upper, about 36 km from the main G.T road of Dir-Chitral. The total area of Sheringal valley is about 870 km2. Temperature ranges from 0.7˚C to 32˚C. The mean annual rainfall varied between 700 mm to 1300 mm. For the present study two study sites namely; Shaoor and Dophi were selected. The elevation of the Shaoor (study site I) ranges from 1371 m to 1981 m while Shaoor lies at 35˚16'16.10"N to 35˚15'50.35"N and 72˚00'24.66"E to 71˚57.54'39"E, and the elevation of the Dophi (study site II) ranges from 1371 to 2000 m while the study site locates at 35˚16'16.10"N to 35˚15'48.3"N and 72˚00'24.66"E to 72˚01'48.76"E. T
2.2. Research Design
For the present research stratified random sampling design was used. The area including of Pure Oak Forest (POF) was divided into two study sites (Shaoor & Dophi). Each study site was divided further into two stratums. Stratum one comprises on those sites which were located near or with in local community and stratum two comprise on those forest areas which were located away from local community. The base for stratification was location of the forest, the density and cover of the forest. In each study site 20 samples plots were taken randomly (10 in each stratum). The size of each sample plots was 0.1 ha. Over all 40 sample plots were taken in the POF. For data collection different instrument like Calliper, diameter taps, Abneys levels, Staff rods, Ranging rods, GPS, Taps and ropes were used. Diameter of each tree in every plot was measured by diameter tap at two point’s i.e. At basal point and at point where the first branch starts. Height of the tree was measured by staff road (5 m in length) and Abneys level.
2.3. Measurement of Volume
For the estimation of stem volume (m3∙ha−1), Height of tree in meter and tree diameter (cm) was recorded for each tree. The following formula was used to measured tree volume

V = Stem volume (m3∙ha−1), H = Height of tree in meter, A = Cross-sectional area and FF = Form factor.
For the present study the form factor for each tree in the respective diameter class was calculated.
2.4. Measurement of Biomass
The stem biomass (t∙ha−1) was calculated from volume (m3∙ha−1) and basic wood density (kg∙m−3). The value of Basic wood density (BWD) was sourced from available literature ( Haripriya, 2000 ; IPCC, 2006). The following formula was used to estimate stem biomass.
Stem biomass (Kg) = Stem volume (m3) × Basic wood density (kg∙m−3)
The total biomass (t∙ha−1) was obtained from the relationship of stem biomass (m3∙ha−1) and biomass expansion factor. The Biomass expansion factor (BEF) was taken as 1.59. That has been used by Haripriya, (2000) for total biomass calculation of the broad leaved species in India.
Total biomass (t∙ha−1) = Stem biomass (t∙ha−1) × Biomass expansion factor (BEF).
2.5. Calculation of C-Stocks
The total C-stock in above the ground biomass was calculated by using conversion factor of 0.5. This conversion factor was multiplied with total biomass (t∙ha−1) and total carbon stocks (t∙ha−1) was estimated. This conversion factor has been globally used by (Roy et al., 2001; Brown & Lugo, 1982; Malhi et al., 2004; Nizami, 2012; Adnan et al., 2014) .
3. Results and Discussions
3.1. Characteristics and Growing Stock Volume
The stem density tree height, basal area and stem volume was measured details of which is given in Table 1. Stem density of the study site ranges from 80 ± 8 to 510 ± 42 trees ha−1. The mean stem density of the study area was 226 ± 7 tress ha−1. In present study it was found that there is great variation in stem density (ha−1). The value of CV (66.26%) also showed variation in the stem density (ha−1). The Oak forest of the study area belongs to the local community. The community use the forest for the purposes of fuel wood, forage and other domestic uses like construction of their houses and agriculture tools. The Oak forest of the study site can be categorized into three groups; the forest near to the local community; the forest surrounded by the local community and the forest that are located away from local community (mostly on high altitude). For the present study sample plots were taken in all these three groups. So those sample plots that were taken from the forest that were located near to the local community and surrounded by local community have lower density (ha−1). The reason of lower density in these study sites are the more use of forest for fuel wood, forage and other domestic uses. While those

Table 1. Distribution of Stem density (ha−1), tree height (m), basal area (m2∙ha−1), stem volume (m3∙ha−1) in the respective diameter (cm) classes.
forest which were located away from the community or located at high altitude have more density because of less disturbance received from the local population in terms of fuel wood and forage and domestic uses.
Stem density decreases with increase in stem diameter (Adnan et al., 2014; Adnan & Nizami, 2014; Nizami, 2012) . In present study the relationship between Stem density (ha−1) and stem diameter (cm) was established. The relation of stem density (ha−1) and stem diameter (cm) is presented in Figure 1. The relation of Stem density (ha−1) and stem diameter (cm) is Polynomial, Cubic. The value of R2 is 0.78.
Height in present study ranges from 4.19 m at 8 cm diameter to 6.83 m at 64 cm diameter. The mean height was recorded as 5.47 m ± 0.76. Sheikh, (1993) reported the height of the Quercus baloot from 2 m to 12 m. Tree height is the function of diameter. The height (m) of tree has a direct relation with the diameter (cm) of tree. Tree height increases with increase in diameter (Ahmad, S., Ahmad, A., & Nizami, 2014) . In present study it was found that the height of the tree increases with increase in stem diameter (Figure 2). To study the relation of stem diameter (cm) and height (m) a regression model was developed (Figure 2). The relation of stem diameter (cm) and tree height is Polynomial, Cubic. The value of R2 is 0.8578.
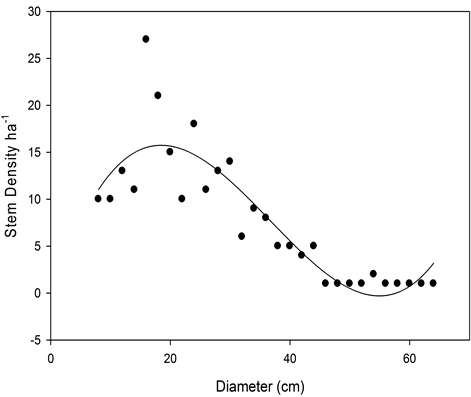
Figure 1. Relationship between tree Diameter (cm), Stem density ha−1 and tree height (m). Equation: Polynomial, Cubic, R2= 0.78. f = −0.7640 + 2.01 × x + (−0.073) × x2 + 0.0007 × x3.
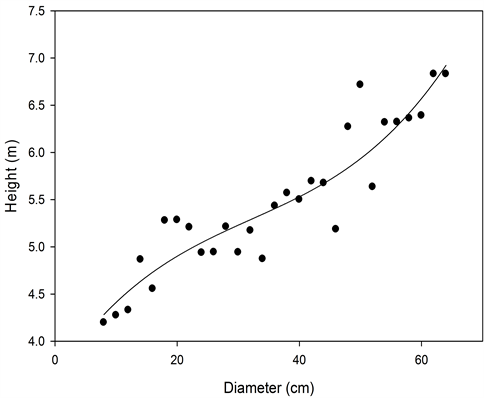
Figure 2. Relationship between tree Diameter (cm), Stem density ha−1 and tree height (m). Equation: Polynomial, Cubic, R2 = 0.86. f = 3.62 + 0.097 × x+ (−0.0021) × x2 + 2.1925E−005 × x3.
The basal area of the Oak scrub forest ranges from 1.13 ± 0.66 to 29.90 ± 1.47 m2∙ha−1. Over all the mean basal area was 12.82 ± 0.25 m2∙ha−1. The minimum basal area of 0.05 m2∙ha−1 was recorded for 8 cm diameter class at stem density of 10 tree ha−1 while the maximum basal area of 0.99 m2∙ha−1 was recorded for 30 cm diameter at stem density of 14 trees ha−1. The present finding of basal area (m2∙ha−1) are similar with the results of (Moinuddin et al., 2011) who reported a basal area of 1.47, 16 and 25 m2∙ha−1 from Hindu Kush and Himalayan ranges of Pakistan.
The mean Stem volume of the Oak scrub forest was 46.37 ± 0.85 m3∙ha−1 (Table 1). It can be seen from the table that the minimum volume was found in the diameter classes range from 8 to 20 cm and the maximum volume was found in the diameter class of 49 and above cm. Tree volume (m3∙ha−1) is the functional of basal area (m2∙ha−1). With increase in basal area (m2∙ha−1) the volume (m3∙ha−1) also increases (Figure 3). According to Figure 3 the value of volume is lowest (0.120493 m3∙ha−1) at 0.050 m2∙ha−1 basal area while the highest value of volume is (3.109 m3∙ha−1) at 0.99 m2∙ha−1 basal area.
3.2. Stem Biomass and Total Tree Biomass
The stem biomass of the Oak scrub forest in present study varied from 2.52 ± 1.67 t∙ha−1 to 79.37 ± 4.20 t∙ha−1. The mean stem biomass was 32.46276 ± 0.66 t∙ha−1. The minimum stem biomass was recorded in diameter class of 8 cm and was 0.084345 t∙ha−1 while the maximum stem biomass was recorded in diameter class of 30 cm and was 2.17 t∙ha−1. Stem biomass (t∙ha−1) and basal area (m2∙ha−1) had direct relation. With increase in the value of basal area (m2∙ha−1) the value of stem biomass (t∙ha−1) also increases. In order to study the relationship between the stem biomass (t∙ha−1) and basal area (m2∙ha−1) a regression model was developed (Figure 2). The value of R2 in the regression model is 0.94. The total biomass of the Oak scrub forest ranges from 4.01 ± 2.65 to 126.20 ± 6.69, while the mean total biomass was 51.61 ± 0.91 t∙ha−1.
3.3. C-Stocks of the Oak Scrub Forest
The finding of the present study revealed that the total C-stocks (t∙ha−1) ranges from 2.005 ± 1.32 to 63.1 ± 3.34. (Figure 4) The mean C-stock of the Oak scrub forest was 25.80 ± 0.47. Table 2 and Figure 5 depicted details of C stocks (t∙ha−1). The value of CV (%) was 53.62%. The value of CV indicated that there is great variation in the amount of C stocks. As the amount of the C stocks in a forest depends upon the biomass of the forest. The biomass of a tree is time dependent process. Old growth forest stored more carbon due to more accumulation of biomass (Zang et al., 2012). According to (Adnan et al., 2014) forest comprise of old age trees having large diameter resulted more biomass carbon. Similar results were reported from the present study. As it has been discussed earlier that in the study site those forest areas that were near to local community have less density and also these areas comprise of small diameter trees so the plots which were taken in those sites have less
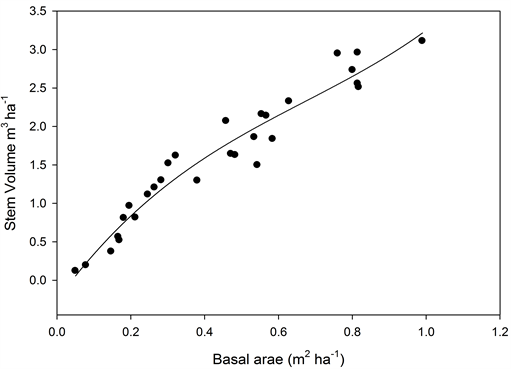
Figure 3. Relationship between Basal area m2∙ha−1, Stem volume m3∙ha−1 and stem biomass t∙ha−1. Equation: Polynomial, Cubic, R2 = 0.94. f = −0.259 + 6.56 × x+ (−6.08) × x2 + 3.027 × x3.
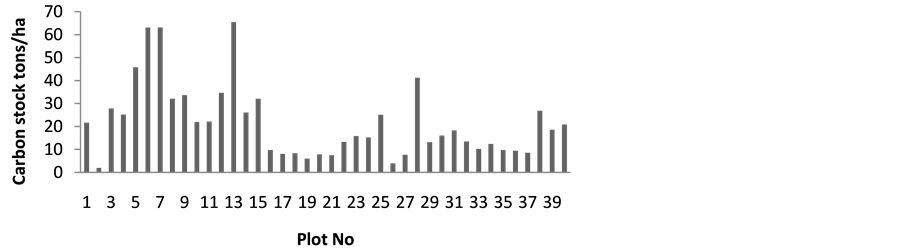
Figure 4. Plot wise mean carbon stock (ton) ha−1.
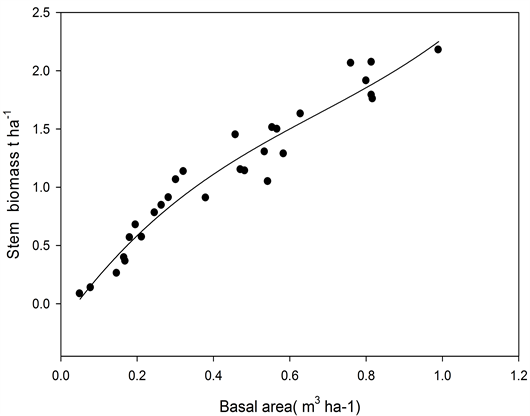
Figure 5. Relationship between Basal area m2∙ha−1, Stem volume m3∙ha−1 and stem biomass t∙ha−1. Equation: Polynomial, Cubic, R2 = 0.94. f = −0.18 + 4.596 × x + (−4.26) × x2 + 2.11 × x3.
Table 2. Distribution Stem biomass (t∙ha−1), total biomass (t∙ha−1), and total C stocks (t∙ha−1) in the respective diameter classes.
amount of carbon in there biomass. The sample plots which were taken from the forest area which were located away from the local community had more stem density with large diameter trees that’s why those sample plots gives more carbon.
3.4. Percentage Distribution of Stem Density, Stem Volume, Stem Biomass, Total Biomass and C-Stocks in the Respective Diameter Classes
The present study also described the percentage distribution of stem density, stem volume, stem biomass, total biomass and total carbon stock in the respective diameter classes. Details of the percentage distribution are given in Table 3. The results of the table showed that in diameter class ranges from 8 to 20 cm the percentage of stem density is maximum (47.34%) while in diameter class of 49 cm and above the percentage of stem density is minimum (3.98). It can be concluded from the present finding that with increase in the diameter stem density
Table 3. Percentage distribution of stem density, stem volume, stem biomass, total biomass and total carbon stock in the respective diameter class.
decreases. Similarly the lowest percentage of volume, stem biomass, total tree biomass and total carbon stock was recorded in the diameter class of 8 to 20 cm and the highest percentage of volume, stem biomass, total tree biomass and total carbon stock was recorded in the diameter class of 21 to 34 cm.
4. Conclusion
The present study was aimed to find out the growing stock, biomass and carbon stock in the Oak scrub forest of Sheringal valley. The oak forest belongs to the local community. The local community used the forest for the purposes of fuel wood and for forage for their live stock. The finding of the present study figured out that the Oak scrub forest stored about 25.80 ± 0.47 t∙ha−1 of carbon in their above and below ground biomass. The present study confirmed that the Oak scrub forest is valuable sink of carbon. But this valuable storage factory faced threats in terms of excess use of fuel wood, forage, domestic uses and unscientific management. Proper scientific management and proper utilization of the forest, rehabilitation of degraded forest and afforestation and reforestation can be significant measures to enhance the potential of the forest to stored and sink more carbon.
References
- Ahmad , A., & Nizami, S. M. (2014). Carbon Stocks of Different Land Uses in the Kumrat Valley, Hindu Kush Region of Pakistan. Journal of Forestry Research, 26, 57-64.
- Ahmad, A., Mirza S. N., & Moazzam, N. S. (2014). Assessment of Biomass and Carbon Stocks in Coniferous Forest of Dir Kohistan, KPK. Pakistan Journal of Agricultural Sciences, 51, 35-350.
- Ahmad, S., Ahmad, A., & Moazzam N. S. (2014). Assessment of Biomass Expansion Factor of Picea Smithiana (WA-LL) Boiss. International Journal of Scientific and Engineering Research, 5, 1232-1239.
- Brown, S., & Lugo, A. E. (1982). The Storage and Production of Organic Matter in Tropical Forest and Their Role in Global Carbon Cycle. Biotropicia, 14, 161-187. http://dx.doi.org/10.2307/2388024
- FAO (2010). Global Forest Resource Assessments 2010. FAO Forestry Paper No: 163.
- Häme, T., Salli, A., & Lahti, K. (1992). Estimation of Carbon Storage in Boreal Forests Using Remote Sensing Data.
- Haripriya, G. S. (2000). Estimates of Biomass in Indian Forests. Biomass and Bioenergy, 19, 245-258. http://dx.doi.org/10.1016/S0961-9534(00)00040-4
- Houghton, R. A., & Hackler, J. L. (1995). Continental Scale Estimate of the Biotic Carbon Flux from Land Cover Change1850-1990. ORNL/CDIAC-79, NDP-050, Carbon Dioxide Information Analysis Center, Oak Ridge National Laboratory, US Department of Energy, Oak Ridge.
- IPCC (2007). Climate Change 2007: Mitigation of Climate Change. In: B. Metz, O. R. Davidson, & P. R. Bosch (eds).
- Malhi, Y., Baker, T. R., Phillips, O. L., Almeida, S., Alvarez, E., Arroyo, L., Chave, J., CzimczikI, C. I. Fiore, A. D., Higuchi, N., Killeen, T. J., Laurance, S. G., Laurance, W. F., Lewis, S. L., Montoya, L. M. M., & Lloyd, J. (2004). The above Ground Coarse Wood Productivity of 104 Neotropical Forest Plots. Global Change Biology, 10, 563-591. http://dx.doi.org/10.1111/j.1529-8817.2003.00778.x
- Moinuddin, A., Shaukat, S. S., & Siddiqui, M. P. (2011). A Multivariate Analysis of the Vegetation of Cedrus deodara Forests in Hindu Kush and Himalayan Ranges of Pakistan: Evaluating the Structure and Dynamics. Turkish Journal Of Botany, 35, 419-438.
- Nizami, S. M. (2012). The Inventory of the Carbon Stocks in Sub Tropical Forest of Pakistan for Reporting under Kyoto Protocol. Journal of Forest Research, 23, 377-384.
- NOAA (2013). Atmospheric CO2 Mauna Loa Observatory (Scripps/ NOAA/).
- Raqeeb, A., Nizami, S. M., Saleem, A. et al. (2014). Characteristics and Growing Stocks Volume of Forest Stand in Dry Temperate Forest of Chilas Gilgit-Baltistan. Open Journal of Forestry, 4, 231-238. http://dx.doi.org/10.4236/ojf.2014.43030
- Roy, J., Saugier, B., & Mooney, H. A. (2001). Terrestrial Global Productivity. San Diego: Academic.
- Sharma, C. M., Gairola, S., Baduni, N. P., Ghildiyal, S. K., & Sarvesh, S. (2011). Variation in Carbon Stocks on Different Slope Aspects in Seven Major Types of Temperate Region of Garhwal Himalaya, India. Journal of Biosciences, 36, 701- 708.
- Sheikh, M. I. (1993). Trees of Pakistan (142 p). Peshawar: Pakistan Forest Institute.
NOTES

*Corresponding author.