Open Journal of Acoustics
Vol.07 No.03(2017), Article ID:78968,14 pages
10.4236/oja.2017.73007
The Role of Efferent Reduction of Cochlear Compression in the Detection of Tones in Noise
Shaum P. Bhagat, Anusha Yellamsetty
School of Communication Sciences and Disorders, The University of Memphis, Memphis, TN, USA

Copyright © 2017 by authors and Scientific Research Publishing Inc.
This work is licensed under the Creative Commons Attribution International License (CC BY 4.0).
http://creativecommons.org/licenses/by/4.0/


Received: July 22, 2017; Accepted: September 5, 2017; Published: September 8, 2017
ABSTRACT
Stimulation of medial olivocochlear (MOC) efferent neurons reduces basilar membrane (BM) sensitivity and increases the slope of BM input-output (I/O) functions in animal models. Decreased compression of I/O functions associated with activation of MOC efferent neurons may assist in extending the neural response to the tone above that of noise, leading to an improvement in masked thresholds. To evaluate this hypothesis, the distortion-product oto- acoustic emission (DPOAE) I/O function, a proxy measure of BM compression, was examined in conditions with presentation of contralateral noise. DPOAE I/O functions were measured at f2 frequencies of 1000 and 2000 Hz in 16 normal-hearing adults. In each subject, estimation of masked thresholds at 1000 and 2000 Hz was provided by a two-interval forced-choice procedure. There were statistically significant associations between DPOAE I/O function slopes and masked tone thresholds at both 1000 and 2000 Hz. At 1000 Hz, individuals with higher DPOAE I/O function slopes exhibited lower masked thresholds. Data at 2000 Hz indicated that individuals with higher masked thresholds exhibited higher DPOAE I/O function slopes. When measured with contralateral noise, DPOAE I/O function slopes were linked to masked thresholds at both frequencies examined in this study. Linearized DPOAE I/O functions presumably reflect linearized BM growth functions under conditions of MOC efferent activation, and this process may have extended the neural response to the signal tone so that it could be more easily heard in the presence of masking noise under certain conditions examined in this study.
Keywords:
Cochlea, Masking, Otoacoustic Emissions, Suppression, Humans

1. Introduction
Electrical stimulation of the olivocochlear bundle reduces basilar membrane (BM) sensitivity and increases the slope of the compressive region of the BM input-output (I/O) function for tones presented near the characteristic frequency (CF) of the recording location [1] [2] . Although the underlying mechanism of these findings remains to be determined, stimulation of medial olivocochlear (MOC) efferent neurons hyperpolarizes outer hair cells (OHCs) and increases OHC conductance [3] [4] , perhaps leading to a decrease in OHC motility and reduction in the amount of BM compression [5] [6] . MOC efferent-induced modification of BM vibration could conceivably diminish the masking effects of noise by decreasing BM sensitivity for low-level noise and increasing the slope of the compressive region of the BM I/O function, thereby extending the BM response to moderate and loud tones above similar noise levels [1] . Consistent with this line of thought, there is some evidence for MOC-mediated enhancement of BM vibration for tones above CF presented at moderate to high levels [6] [7] . These findings also agree conceptually with the results of earlier studies indicating that uncrossed MOC activity induced by contralateral sound enhances neural output to moderate and high-level tones presented in noise [8] [9] . Mechanical measurements in mouse models have recently shown that the reticular lamina (RL) vibrates in response to sound stimulation and this RL vibration is modified by level-dependent amplification to a greater degree than what is exhibited on the BM findings that implicate a role of the RL in cochlear amplification and possibly in the generation of otoacoustic emissions [10] [11] .
In humans, the activity of MOC efferent neurons has been studied indirectly through measuring distortion-product otoacoustic emissions (DPOAEs) in conditions with and without presentation of acoustic stimulation designed to activate the MOC reflex. DPOAEs are emitted sounds from the cochlea that are usually inaudible and can be recorded by the placement of a sensitive microphone in the ear canal. The paradigm used most extensively to measure MOC efferent activity involves presentation of a contralateral sound, evoking uncrossed MOC activity, during DPOAE measurements. Broadband noise is believed to be the most effective elicitor of uncrossed MOC activity in humans [12] [13] . During presentation of contralateral noise, DPOAE amplitudes can be suppressed, enhanced, or exhibit no changes relative to measurement conditions without the contralateral noise [14] [15] [16] [17] [18] . The changes seen in DPOAE amplitudes with contralateral noise in humans are similar to MOC efferent-induced effects on the BM in laboratory mammals. Given the putative role of the MOC efferents in signal-in-noise detection [9] , the contralateral noise paradigm potentially provides an index of the efficiency of the MOC efferent system that can be compared with the performance of listeners during psychophysical masking tests. Some studies have compared listener ability to detect tones or tone complexes in noise with the amount of contralateral suppression of evoked otoacoustic emissions (EOAEs), with the results indicating that individuals with stronger MOC efferent suppression either had higher masked thresholds [19] or lower masked thresholds [20] compared with individuals with weaker MOC efferent suppression. However, EOAEs elicited by clicks reflect broad cochlear excitation, and attempts at comparing contralateral suppression of EOAEs with detection of tones at discrete frequencies may not provide optimal results. A more profitable comparison may be realized by configuring the primary tones used to evoke DPOAEs to occur near the frequency of the tone heard by the listener during the psychophysical task. This would make the acoustic stimuli more comparable, and potentially strengthen the association between MOC reflexes induced by contralateral noise with the ability to detect tones in noise. Garinis et al. [21] compared several measures of MOC efferent suppression of DPOAEs obtained with primary tones near 1000 Hz with masked tone thresholds using a 1000 Hz probe obtained with broadband noise, fixed frequency, and random frequency maskers. The results of Garinis et al. [21] for broadband noise and random frequency maskers showed that individuals with stronger MOC efferent suppression tended to have higher masked tone thresholds, findings that conflict with the speculation that increased MOC activation is associated with better tone-in-noise detection ability.
Previous work in humans has emphasized examining MOC reflex strength, measured indirectly via the amount of contralateral suppression of cochlear otoacoustic emissions, in relation to tone-in-noise detection performance. Depending on stimulus parameters, contralateral noise can either enhance or suppress DPOAE levels, and inferring MOC efferent reflex strength from these measures can be problematic [22] . A different approach of studying this topic would be to examine DPOAE I/O function slopes from DPOAE I/O functions obtained with contralateral noise. The derived DPOAE I/O function slopes could then be related to the masked tone thresholds measured in noise. In a previous study conducted in our laboratory [23] , presentation of contralateral noise shifted DPOAE compression thresholds to higher levels. These shifts in DPOAE compression thresholds were negatively correlated with the amount of masking in listeners produced by a noise masker on a signal tone at 1000 Hz. Based on these findings, we hypothesized in the current study that DPOAE I/O functions obtained with contralateral noise would exhibit slopes with higher (more linear) values in listeners exhibiting lower (better) masked tone thresholds measured during a psychophysical tone-in-noise task. Our findings in this report are directly comparable to the results of other studies exploring the role of MOC-in- duced changes in DPOAEs on measurements of masked tone thresholds. Comparison of the evidence presented in this report and findings in other studies can contribute to elucidating the role of the MOC efferent system in tone-in-noise tasks in humans.
2. Methods
2.1. Subjects
Previously, we examined the relationship between DPOAE I/O function compression estimates and absolute tone thresholds in a cohort of subjects and the subjects identified here were subjects in our previous study [24] . They were 16 adults (14 females, 2 males). Subject age ranged from 22 - 42 years (mean = 27.6, SD = 5.9). Subject hearing was screened with an audiometer prior to subject enrollment. All subjects admitted into the study had hearing thresholds at or better than 20 dB HL in both ears for the standard audiometric test frequencies measured at inter-octave intervals from 250 - 8000 Hz. A middle-ear analyzer was used to evaluate middle-ear function, and all subjects had normal tympanograms. Acoustic reflex (AR) thresholds, obtained with a pulsed broadband noise activator presented to the ear contralateral to the test ear, were at or greater than 60 dB HL in both ears of every subject. Subjects signed a consent form approved by the Institutional Review Board at the University of Memphis prior to participating in the study.
2.2. Procedure
Different from our previous study, we focused here on comparing measurements of masked tone thresholds and slopes from DPOAE I/O functions. Measurements of masked tone thresholds and DPOAE I/O functions were obtained in each subject at two test frequencies. A double-walled, sound-treated enclosure was the location for masked tone threshold and DPOAE I/O function testing. Masked tone thresholds were measured in odd-numbered subjects first, and then DPOAE measurements were made. In even-numbered subjects, DPOAE measurements were completed first, followed by measurement of masked tone thresholds. The experimental session at a given test frequency typically was completed in approximately 2 hours. Participants returned on another day to complete testing at the remaining test frequency in order to avoid the effects of fatigue. Preliminary tests, such as hearing screening and tympanometry, were completed on the second testing day and replicated findings seen on the first testing day. Subjects were cautioned to avoid exposure to loud sounds between testing days.
2.2.1. Masked Thresholds
The test signals were 1000 and 2000 Hz tones. These test frequencies were selected to facilitate comparisons with previous work examining the relationship between MOC reflexes and tone-in-noise detection [20] [21] . Thresholds were measured with Tucker-Davis Technologies (TDT) System 3 hardware interfaced with a Dell Optiflex GX 280 computer equipped with SykoFizX v. 2000 software. The tones were digitally generated (TDT, RP2.1) at a nominal rate of 50 kHz. For measurement conditions with the masker, a broadband noise was generated (TDT, RP2.1) at the same sampling rate as the tonal signals. The electrical signals were sent to a headphone buffer (TDT, HB7) before being transduced by one of a pair of Sony MDR-V500 headphones. The duration of the tone signals and the noise masker was 300 msec (milliseconds), including 10 msec cosine- gated rise and fall times. Calibration of stimulus levels was accomplished by placing the headphone on an acoustic coupler that was connected to a sound- level meter (Larson Davis OB800). Frequency accuracy of the tonal signals was verified by the frequency counter of the sound-level meter and was within the tolerance allowed by published standards [25] . The overall level of the noise masker was 60 dB SPL, and its spectral bandwidth (0.3 - 5.0 kHz) was determined using a spectrum analyzer (Hewlett Packard, model 3561A). In masking conditions, the tone signal and noise masker were presented at the same time and were directed to the right ear of each subject. Threshold estimates were provided by a two-interval, two-alternative forced-choice procedure with a two- down one-up adaptive rule that tracked the 71% correct performance level in each subject [26] . Observation intervals were 300 msec in duration and the time between intervals was 350 msec. The initial step size of the procedure was 5 dB and the step size was decreased to 2 dB following the first three reversals. Subjects voted by using a mouse to click on the selected interval icon on a computer monitor. Feedback was provided to the subject after each response indicating the interval that contained the signal tone. Each threshold run consisted of 50 trials, with three threshold runs obtained for each measurement condition. The mean of the estimates obtained from the three runs defined the threshold in dB SPL. Threshold estimates for each of the three runs were consistent from run to run for subjects (usually within 2 - 3 dB). Figure 1 depicts the masked thresholds of the subjects at 1000 and 2000 Hz in box and whisker plots.
2.2.2. DPOAE I/O Functions
Primary tones were generated by an otoacoustic emissions analyzer (Otodyna- mics ILO 296) that was interfaced with the same computer used for threshold testing. DPOAE I/O functions were measured at f2 frequencies of 1000 and 2000
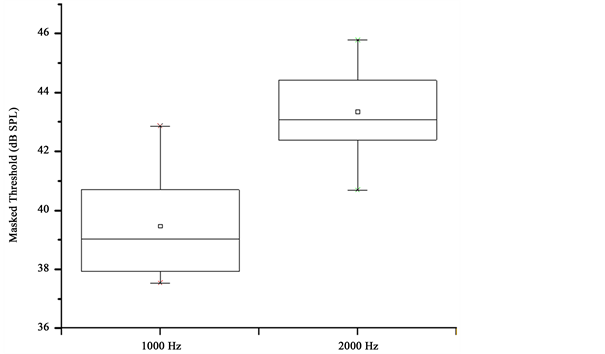
Figure 1. Masked tone thresholds as box and whisker plots. The box is formed by the 25th and 75th percentiles, and the whiskers are formed by the 5th and 95th percentiles.
Hz in each subject. The f2: f1 ratio was constant at 1.22. Primary-tone levels at the higher frequency primary (L2) were incremented in 5-dB steps. They were presented at targeted levels from 45 dB SPL to 70 dB SPL, while primary-tone levels at the lower frequency primary (L1) were calculated using the formula (L1 = 0.4L2 + 39) developed by Kummer et al. [25] . Selection of these inter-primary level differences was based on findings that showed these parameters produce both high-level DPOAEs across a wide f2 frequency range and DPOAE I/O functions that have good correspondence with cochlear mechanical responses in animal models [26] .
A procedure was conducted in each subject prior to data collection in order to set targeted ear-canal primary-tone levels. Previous studies have shown that setting of the primary-tone level in the ear canal can be influenced by standing waves, however, the effects of standing waves at the frequencies used in this study were expected to be minimal [27] . The DPOAE I/O function measurements, obtained from the right ear of all subjects, began at the highest primary- tone levels, and descended in level until the lowest targeted primary-tone level was reached. Each measurement was terminated after three complete primary- tone level sweeps. The contralateral noise was digitally generated (TDT, RP 2.1), attenuated (TDT, PA5), and buffered (TDT, HB7) before being transduced by an insert earphone (Eartone, 3A). Noise duration was 600 msec including 5 msec rise and fall times, and the noise bursts were presented at a rate of 1/sec. The overall level of each noise burst was 60 dB SPL, as measured in a Zwislocki coupler using the peak hold function on the sound- level meter. This level was selected as it has been used in previous studies examining MOC reflexes in humans [10] [14] . It was also below the level of the noise required to measure the AR threshold using the clinical instrumentation in all of the subjects. During conditions with contralateral noise, the noise was applied to the left ear of all subjects. The DPOAE I/O functions were measured twice without the contralateral noise applied, and twice with the contralateral noise applied in an interleaved manner with a break of at least 1 minute between measurements. The levels of the 2f1 − f2 DPOAE measured without presentation of contralateral noise were averaged for the two measurements, and the levels of the 2f1 − f2 DPOAE measured with the contralateral noise were also averaged for the two measurements in each subject. DPOAE I/O functions were constituted from these averaged DPOAE levels (in dB SPL) plotted as a function of L2 level (in dB SPL). The noise floor was estimated by determining the mean level (in dB SPL) of 5 frequency bins above and below the 2f1 − f2 frequency bin. Noise floor estimates from the two measurements without contralateral noise and with contralateral noise were separately averaged together. DPOAE I/O functions from representative subjects are depicted in Figure 2.
2.3. DPOAE I/O Function Slope Estimates
Compression slope estimates were obtained offline from DPOAE I/O functions

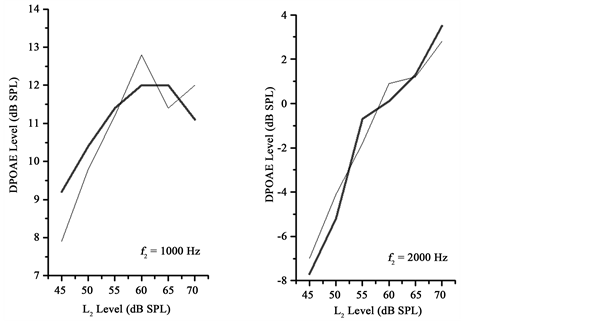
Figure 2. DPOAE I/O functions from individual subjects. Thick lines depict DPOAE levels acquired without contralateral noise and thin lines depict DPOAE levels acquired with contralateral noise. Note the increased slopes for DPOAE levels depicted with the thin lines.
fit with the three-segment linear regression model. The DPOAE I/O functions, in order to be considered for the fitting procedure, were required to have DPOAE signal-to-noise ratios (SNRs) of 3 dB or higher at a minimum of 3 consecutive points on the functions. These criteria are similar to the criteria used in previous studies [28] [29] [30] [31] . DPOAE I/O functions at f2 = 1000 Hz from three subjects and at f2 = 2000 Hz from three subjects which did not meet these criteria were omitted from further analysis. The fmin search function in MATLAB® was used to accomplish the fitting of the three segment linear regression model [32] [33] to DPOAE I/O functions. The model includes linear-com- pressed-linear segments representative of BM I/O functions. Based on the fitted functions, model estimates of lower and upper breakpoints and the slope of the compressed segments were obtained. These estimates were obtained using the following equations:
(1)
(2)
(3)
where G is the gain, c is the slope of the compressed segment (dB/dB), , , Lin (level in dB SPL), and Lout (level of BM response, dB). The parameters free to be varied in the model G, c, BP1 and BP2 were adjusted to provide the best fit to the data (lowest rms error) for each DPOAE I/O function fitted. For the purposes of this study, the slopes of the compressed segments were the measurements of interest. In the case of two DPOAE I/O functions (at 1000 Hz and 2000 Hz respectively), the model provided an estimate of the lower breakpoint that was below the range of input levels (<45 dB SPL) examined. Estimated slopes in these cases would not be representative of the actual data used to constitute the actual DPOAE I/O function. Therefore, model estimates from the fitted functions from these two DPOAE I/O functions were excluded from further data analysis.
2.4. Data Analysis
Statistical procedures were performed with OriginPro 8.0 software. An alpha level of 0.05 was selected for all statistical testing. Correlational analyses were designed to determine the association between DPOAE I/O functions obtained with contralateral noise and masked tone thresholds. Separate evaluations of masked thresholds and compression estimates at the 1000 Hz and 2000 Hz test frequencies were completed. Specifically, Pearson product-moment correlations were calculated that examined the association between masked tone thresholds and DPOAE compression slopes.
3. Results
Masked tone thresholds and DPOAE I/O functions were measured in all 16 subjects. However, DPOAE functions from 12 subjects (aged 23 - 42 years) met the study criteria at the f2 frequency of 1000 Hz, and DPOAE functions from 12 subjects (aged 22 - 42 years) met the study criteria at the f2 frequency of 2000 Hz. There were 9 subjects meeting the study criteria for DPOAEs at both f2 frequencies. Masked tone threshold and DPOAE I/O function slopes were only evaluated for the 12 subjects meeting the study requirements at each test frequency. Masked tone thresholds ranged from 37.5 - 42.9 dB SPL (mean = 39.8, SD = 1.9) at 1000 Hz and from 40.7 - 45.8 dB SPL (mean = 43.4, SD = 1.5) at 2000 Hz. Mean DPOAE levels with noise applied to the contralateral ear ranged from 0.8 to 4.5 dB SPL at 1000 Hz and were from 1.6 to 6.7 dB SPL at 2000 Hz. The average rms errors from model fits of the DPOAE I/O functions obtained with contralateral noise were 0.74 dB at 1000 Hz and 1.05 dB at 2000 Hz, suggesting that the three-segment procedure was accurate in fitting the data.
DPOAE I/O function slopes ranged from −0.5 to 0.1 dB/dB (mean = −0.1, SD = 0.2) at f2 = 1000 Hz, and ranged from −0.3 to 0.4 dB/dB (mean = 0.1, SD = 0.2) at f2 = 2000 Hz. Pearson-product moment correlations were calculated to determine the association between DPOAE I/O function slopes and masked tone thresholds. The association between DPOAE I/O function slopes and masked tone thresholds was significant both at 1000 Hz (r = −0.59, p = 0.044) and at 2000 Hz (r = 0.58, p = 0.048). The associations between DPOAE I/O function slopes and masked tone thresholds at 1000 and 2000 Hz are illustrated in Figure 3.
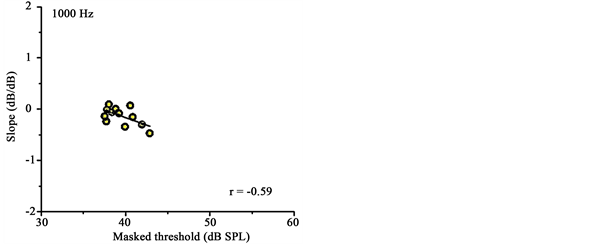

Figure 3. DPOAE I/O function slopes from DPOAE I/O functions acquired with contralateral noise are plotted against masked tone thresholds at 1000 and 2000 Hz. Pearson correlations (in the lower right hand corner) and lines of best fit are shown in each panel.
4. Discussion
The main aim of this study was to examine associations between masked tone thresholds and the slopes of DPOAE I/O functions obtained with presentation of contralateral noise. DPOAE I/O function slopes were statistically significantly associated with masked tone thresholds at both 1000 Hz and 2000 Hz.
4.1. Effects of Contralateral Noise on DPOAE I/O Functions
The effects of contralateral noise on DPOAE levels in this study were consistent with previous reports. DPOAE levels at f2 = 1000 Hz were suppressed on average by 0.38 dB for L2 levels from 60 - 70 dB SPL, and were suppressed on average by 1.06 dB for L2 levels from 45 - 55 dB SPL. Moulin et al. [14] examined DPOAE I/O functions acquired with equal-level primary tones, and found that contralateral noise suppressed DPOAE levels on average by 0.68 dB for 75 dB SPL primaries and by 2 dB for 45 dB SPL primaries at f2 = 1400 Hz. Presentation of contralateral noise can also trigger the AR, leading to stiffening of the ossicular chain and reduction of DPOAE levels due to increased acoustic impedance of the middle-ear mechanism. AR thresholds elicited with pulsed broadband activators were examined with clinical immittance instrumentation in each subject in this study, and all subjects exhibited AR thresholds above the level of contralateral noise (60 dB SPL) selected in this study for suppression of DPOAEs. This suggests that the level of contralateral noise selected in the study was below the AR thresholds of all of the subjects evaluated, and implicates the involvement of the MOC efferent neurons in the observed suppression of DPOAEs. While AR activity below the measured AR thresholds cannot be ruled out, Sun [34] reported that the suppression of DPOAEs for levels of contralateral noise below the AR threshold is most likely is mediated by the MOC reflex pathway. The level of the 2f1 − f2 DPOAEs is known to diminish rapidly within 100 msec of the onset of presentation of the primary tones, presumably due to ipsilateral activation of the crossed MOC reflex [35] . Therefore, DPOAE I/O functions studied in this investigation potentially reflected both crossed and uncrossed MOC reflex effects.
4.2. Masked Tone Thresholds Are Associated with DPOAE I/O Function Slopes
There were statistically significant associations between DPOAE compression slopes and masked tone thresholds at both 1000 and 2000 Hz. At 1000 Hz, there was a tendency for individuals with steeper slope estimates to exhibit lower masked thresholds compared with individuals with lower slope estimates. This finding agrees with the conjecture that individuals with stronger MOC reflexes may exhibit more linear DPOAE growth functions than individuals with weaker MOC reflexes. Linearized DPOAE growth functions presumably reflect linearized BM growth functions under conditions of MOC efferent activation, and this process may have extended the neural response to the signal tone so that it could be more easily detected in the presence of moderate levels of masking noise. In contrast to the results seen at 1000 Hz, the data at 2000 Hz indicated that individuals with lower masked thresholds exhibited shallower slope estimates than individuals with higher masked thresholds. These results are seemingly at odds with the hypothesized explanation for the association between DPOAE compression thresholds and masked thresholds at 1000 Hz. However, it is known that on average in humans, the magnitude of contralateral suppression of DPOAEs generally is greater at lower test frequencies compared to higher test frequencies [14] . Therefore, these results may partly reflect less efficient MOC reflex operation at the higher test frequency. The findings at 2000 Hz were consistent with the earlier results of Garinis et al. [21] , which showed that individuals with stronger contralateral suppression of DPOAEs obtained with primary tones near 1000 Hz tended to have higher masked thresholds when listeners were directed to detect a probe tone at 1000 Hz in the presence of broadband noise. The contemporary evidence concerning the relationship between tone-in- noise detection and contralateral suppression of otoacoustic emissions is inconclusive. As pointed out by Guinan [36] , listeners enter a state of active listening during psychoacoustic tasks involving detection of tones in noise, and this state of listening is not identical to the more passive listening state typically exhibited by listeners during the measurement of otoacoustic emissions. However, there is support for the contention that increased cochlear mechanical response linearization may lead to better tone-in-noise detection by extending the neural response for the signal tone above that of the noise from a recent study that investigated the effects of precursors on fixed-duration masking curves designed to infer cochlear mechanical response growth functions from human listeners [37] .
5. Conclusion
This investigation examined compression estimates derived from a three-segment linear regression model applied to DPOAE I/O functions obtained during conditions with presentation of contralateral noise. These compression estimates were then compared to masked threshold data. The limitations of the study included the fact that a large sample of listeners were not evaluated and that only normal-hearing listeners were studied. The measure of interest in this study was limited to the DPOAE I/O function, which is a proxy measure of the growth of the cochlear mechanical response with increasing stimulus level. It is possible that other DPOAE measures, including DPOAE phase, could also provide additional insights into the role of MOC efferent activity in signal detection. We also only evaluated a single model to fit our data. However, we believe this approach extends application of a three-segment model to enable the study of the effects of MOC reflexes on DPOAE compression estimates and to relate these effects to the ability to detect tones in noise. When measured with contralateral noise, DPOAE I/O function slopes were linked to masked thresholds at both frequencies examined in this study. These findings contribute to increasing evidence indicating a possible role of the reduction of cochlear compression in the detection of tones presented in noise.
Acknowledgements
Portions of this paper were reported as a poster presentation to the Thirty-Ninth Annual Mid Winter Research Meeting of the Association for Research in Otolaryngology, San Diego, California in February, 2016. The authors wish to thank Dr. Enrique Lopez-Poveda for his assistance with the three-segment linear regression model.
Cite this paper
Bhagat, S.P. and Yellamsetty, A. (2017) The Role of Efferent Reduction of Cochlear Compression in the Detection of Tones in Noise. Open Journal of Acoustics, 7, 69-82. https://doi.org/10.4236/oja.2017.73007
References
- 1. Russell, I.J. and Murugasu, E. (1997) Medial Efferent Inhibition Suppresses Basilar Membrane Responses to Near Characteristic Frequency Tones of Moderate to High Intensities. The Journal of the Acoustical Society of America, 102, 1734-1738. https://doi.org/10.1121/1.420083
- 2. Murugasu, E. and Russell, I.J. (1996) The Effect of Efferent Stimulation on Basilar Membrane Displacement in the Basal Turn of the Guinea Pig Cochlea. Journal of Neuroscience, 16, 325-332.
- 3. Housley, G.D. and Ashmore, J.F. (1991) Direct Measurement of the Action of Acetylcholine on Isolated Outer Hair Cells of the Guinea Pig Cochlea. Proceedings of the Royal Society of London B: Biological Sciences, 244, 161-167. https://doi.org/10.1098/rspb.1991.0065
- 4. Evans, M.G. (1996) Acetylcholine Activates Two Currents in Guinea-Pig Outer Hair Cells. The Journal of Physiology, 491, 563-578. https://doi.org/10.1113/jphysiol.1996.sp021240
- 5. Guinan Jr, J.J. (1996) Physiology of Olivocochlear Efferents. In: The Cochlea, Springer, New York, 435-502. https://doi.org/10.1007/978-1-4612-0757-3_8
- 6. Cooper, N.P. and Guinan, J.J. (2006) Efferent-Mediated Control of Basilar Membrane Motion. The Journal of Physiology, 576, 49-54. https://doi.org/10.1113/jphysiol.2006.114991
- 7. Dolan, D.F., Guo, M.H. and Nuttall, A.L. (1997) Frequency-Dependent Enhancement of Basilar Membrane Velocity during Olivocochlear Bundle Stimulation. The Journal of the Acoustical Society of America, 102, 3587-3596. https://doi.org/10.1121/1.421008
- 8. Kawase, T. and Liberman, M.C. (1993) Antimasking Effects of the Olivocochlear Reflex. I. Enhancement of Compound Action Potentials to Masked Tones. Journal of Neurophysiology, 70, 2519-2532.
- 9. Kawase, T., Delgutte, B. and Liberman, M.C. (1993) Antimasking Effects of the Olivocochlear Reflex. II. Enhancement of Auditory-Nerve Response to Masked Tones. Journal of Neurophysiology, 70, 2533-2549.
- 10. Lee, H.Y., Raphael, P.D., Xia, A., Kim, J., Grillet, N., Applegate, B.E., et al. (2016) Two-Dimensional Cochlear Micromechanics Measured in Vivo Demonstrate Radial Tuning within the Mouse Organ of Corti. Journal of Neuroscience, 36, 8160-8173. https://doi.org/10.1523/JNEUROSCI.1157-16.2016
- 11. Ren, T., He, W. and Kemp, D. (2016) Reticular Lamina and Basilar Membrane Vibrations in Living Mouse Cochleae. Proceedings of the National Academy of Sciences, 113, 9910-9915. https://doi.org/10.1073/pnas.1607428113
- 12. Guinan Jr, J.J. (2006) Olivocochlear Efferents: Anatomy, Physiology, Function, and the Measurement of Efferent Effects in Humans. Ear and Hearing, 27, 589-607. https://doi.org/10.1097/01.aud.0000240507.83072.e7
- 13. Lilaonitkul, W. and Guinan, J.J. (2009) Human Medial Olivocochlear Reflex: Effects as Functions of Contralateral, Ipsilateral, and Bilateral Elicitor Bandwidths. Journal of the Association for Research in Otolaryngology, 10, 459-470. https://doi.org/10.1007/s10162-009-0163-1
- 14. Moulin, A., Collet, L. and Duclaux, R. (1993) Contralateral Auditory Stimulation Alters Acoustic Distortion Products in Humans. Hearing Research, 65, 193-210.
- 15. Bhagat, S.P. and Champlin, C.A. (2004) Evaluation of Distortion Products Produced by the Human Auditory System. Hearing Research, 193, 51-67.
- 16. Abdala, C., Mishra, S.K. and Williams, T.L. (2009) Considering Distortion Product Otoacoustic Emission Fine Structure in Measurements of the Medial Olivocochlear Reflex. The Journal of the Acoustical Society of America, 125, 1584-1594. https://doi.org/10.1121/1.3068442
- 17. Deeter, R., Abel, R., Calandruccio, L. and Dhar, S. (2009) Contralateral Acoustic Stimulation Alters the Magnitude and Phase of Distortion Product Otoacoustic Emissions. The Journal of the Acoustical Society of America, 126, 2413-2424. https://doi.org/10.1121/1.3224716
- 18. Müller, J., Janssen, T., Heppelmann, G. and Wagner, W. (2005) Evidence for a Bipolar Change in Distortion Product Otoacoustic Emissions during Contralateral Acoustic Stimulation in Humans. The Journal of the Acoustical Society of America, 118, 3747-3756. https://doi.org/10.1121/1.2109127
- 19. Micheyl, C., Morlet, T., Giraud, A.L., Collet, L. and Morgon, A. (1995) Contralateral Suppression of Evoked Otoacoustic Emissions and Detection of a Multi-Tone Complex in Noise. Acta Oto-Laryngologica, 115, 178-182. https://doi.org/10.3109/00016489509139286
- 20. Micheyl, C. and Collet, L. (1996) Involvement of the Olivocochlear Bundle in the Detection of Tones in Noise. The Journal of the Acoustical Society of America, 99, 1604-1610. https://doi.org/10.1121/1.414734
- 21. Garinis, A., Werner, L. and Abdala, C. (2011) The Relationship between MOC Reflex and Masked Threshold. Hearing Research, 282, 128-137.
- 22. Guinan, J.J., Backus, B.C., Lilaonitkul, W. and Aharonson, V. (2003) Medial Olivocochlear Efferent Reflex in Humans: Otoacoustic Emission (OAE) Measurement Issues and the Advantages of Stimulus Frequency OAEs. Journal of the Association for Research in Otolaryngology, 4, 521-540. https://doi.org/10.1007/s10162-002-3037-3
- 23. Bhagat, S.P. and Carter, P.H. (2010) Efferent-Induced Change in Human Cochlear Compression and Its Influence on Masking of Tones. Neuroscience Letters, 485, 94-97.
- 24. Bhagat, S.P. (2014) Modeling DPOAE Input/Output Function Compression: Comparisons with Hearing Thresholds. Journal of the American Academy of Audiology, 25, 746-759. https://doi.org/10.3766/jaaa.25.8.5
- 25. American Speech-Language-Hearing Association (2005) Guidelines for Manual Pure-Tone Threshold Audiometry.
- 26. Levitt, H.C.C.H. (1971) Transformed Up-Down Methods in Psychoacoustics. The Journal of the Acoustical society of America, 49, 467-477. https://doi.org/10.1121/1.1912375
- 27. Siegel, J.H. (1994) Ear-Canal Standing Waves and High-Frequency Sound Calibration Using Otoacoustic Emission Probes. The Journal of the Acoustical Society of America, 95, 2589-2597. https://doi.org/10.1121/1.409829
- 28. Boege, P. and Janssen, T. (2002) Pure-Tone Threshold Estimation from Extrapolated Distortion Product Otoacoustic Emission I/O-Functions in Normal and Cochlear Hearing Loss Ears. The Journal of the Acoustical Society of America, 111, 1810-1818. https://doi.org/10.1121/1.1460923
- 29. Kummer, P., Janssen, T. and Arnold, W. (1998) The Level and Growth Behavior of the 2 f1-f2 Distortion Product Otoacoustic Emission and Its Relationship to Auditory Sensitivity in Normal Hearing and Cochlear Hearing Loss. The Journal of the Acoustical Society of America, 103, 3431-3444. https://doi.org/10.1121/1.423054
- 30. Johannesen, P.T. and Lopez-Poveda, E.A. (2008) Cochlear Nonlinearity in Normal-Hearing Subjects as Inferred Psychophysically and from Distortion-Product Otoacoustic Emissions. The Journal of the Acoustical Society of America, 124, 2149-2163. https://doi.org/10.1121/1.2968692
- 31. Neely, S.T., Johnson, T.A., Kopun, J., Dierking, D.M. and Gorga, M.P. (2009) Distortion-Product Otoacoustic Emission Input/Output Characteristics in Normal-Hearing and Hearing-Impaired Human Ears. The Journal of the Acoustical Society of America, 126, 728-738. https://doi.org/10.1121/1.3158859
- 32. Yasin, I. and Plack, C.J. (2003) The Effects of a High-Frequency Suppressor on Tuning Curves and Derived Basilar-Membrane Response Functions. The Journal of the Acoustical Society of America, 114, 322-332. https://doi.org/10.1121/1.1579003
- 33. Plack, C.J., Drga, V. and Lopez-Poveda, E.A. (2004) Inferred Basilar-Membrane Response Functions for Listeners with Mild to Moderate Sensorineural Hearing Loss. The Journal of the Acoustical Society of America, 115, 1684-1695. https://doi.org/10.1121/1.1675812
- 34. Sun, X.M. (2008) Contralateral Suppression of Distortion Product Otoacoustic Emissions and the Middle-Ear Muscle Reflex in Human Ears. Hearing Research, 237, 66-75.
- 35. Liberman, M.C., Puria, S. and Guinan Jr, J.J. (1996) The Ipsilaterally Evoked Olivocochlear Reflex Causes Rapid Adaptation of the 2 f 1-f 2 Distortion Product Otoacoustic Emission. The Journal of the Acoustical Society of America, 99, 3572-3584. https://doi.org/10.1121/1.1675812
- 36. Guinan, J.J. (2014) Olivocochlear Efferent Function: Issues Regarding Methods and Interpretation of Results. Frontiers in Systems Neuroscience, 142, 1-5. https://doi.org/10.3389/fnsys.2014.00142
- 37. Yasin, I., Drga, V. and Plack, C.J. (2014) Effect of Human Auditory Efferent Feedback on Cochlear gain and Compression. Journal of Neuroscience, 34, 15319-15326. https://doi.org/10.1523/JNEUROSCI.1043-14.2014