Open Journal of Acoustics
Vol.04 No.04(2014), Article ID:51613,6 pages
10.4236/oja.2014.44018
Measurement of Surface SH-Wave Velocities Generated on the Surface of Japanese Cypress Column
Masumi Hasegawa*, Junji Matsumura
Department of Agro-Environmental Science, Faculty of Agriculture, Kyushu University, Fukuoka, Japan
Email: *kmgtmsm@agr.kyushu-u.ac.jp
Copyright © 2014 by authors and Scientific Research Publishing Inc.
This work is licensed under the Creative Commons Attribution International License (CC BY).
http://creativecommons.org/licenses/by/4.0/


Received 17 September 2014; revised 20 October 2014; accepted 15 November 2014
ABSTRACT
Polyetherimide resin wedge transducers were used to generate a shear wave that was obliquely incident relative to the surface of a Japanese cypress column for measuring the surface SH-wave velocity. As the inter-transducer distance increased, the propagation time increased and the amplitude became smaller. The propagation time and the amplitude were significantly correlated with the inter-transducer distance. The SH-wave velocity ranged from 1270 m/s to 1496 m/s. Surface SH-wave velocity was lower in the central part of the column and higher in the outer part. Velocity was negatively correlated with moisture content at 1% of significance level. These results suggest the accomplishment of the first target for applying the surface SH-wave acoustoelastic technique to nondestructive evaluation of drying stress in wood.
Keywords:
Surface SH-Wave, Moisture Content, Acoustoelasticity, Velocity, Wood

1. Introduction
Wood contains significant amount of water after cutting. Prior to it being used as a timber material, it is necessary to dry the wood to obtain an adequate water content as required by timber manufacturers. However, the wood water content affects its drying characteristics [1] . During the drying process, a water content gradient is generated due to the difference between the bulk and surface drying rates. This water content gradient generates drying stress, manifested as checks that appear on the wood surface. The checks depreciate the lumber’s ornamental value. Recently, in Japan, a trend has emerged to use decorative wood as structure wood. Wood distributors are making posts and beams visible, obtaining what is known as “the bare wood”, allowing residential customers to observe beautiful wood grains. Given this trend in wood industry, the wood distributors are interested in reducing the amount of drying-related wood checks.
Significant attention has been devoted to determining the pretreatment and drying conditions that do not lead to the appearance of surface checks [2] [3] . Lee et al. demonstrated that surface checks in Japanese cedar (Cryptomeria japonica D. Don) pillars can be effectively prevented by pretreatment with high temperature and low humidity [2] . Matsumoto et al. demonstrated that the surface checks area in Japanese cedar columns could be reduced by pretreatment (hot pressing); however, internal checks occurred depending on the drying conditions [3] .
On the other hand, it is important to control the drying stress during the drying process in order to avoid the surface checks. Kodama et al. demonstrated that the slice method was useful for the drying stress control [4] . It is difficult to determine the drying stress in wood nondestructively. Watanabe et al. reported that using NIR spectroscopy it might be possible to predict the drying stress for the timber surface [5] [6] . However, there are few reports related to a useful nondestructive evaluation of drying stress. In this study, we utilized the acoustoelastic technique for evaluating the drying stress. The acoustoelastic technique is one of the methods for nondestructive stress measurement. Acoustoelasticity implies that the velocities of ultrasonic waves that propagate through an elastic material under stress conditions change due to the applied stress [7] [8] . Many researchers have reported that this technique is simple and useful for evaluating various properties of various materials [9] - [13] . Hasegawa et al. have reported that the acoustoelastic technique is a useful way to determine the applied stress in wood [12] [13] . In this study, the acoustoelastic technique was used with surface SH-waves. Surface SH-waves (horizontally polarized shear waves) allow evaluation of the physical and mechanical properties on the material surface [14] [15] . Tohmyoh et al. used surface SH-wave technique for evaluating the length and depth of cracks in steel (SS304) [14] . In addition, Yamagishi et al. demonstrated that surface SH-waves were suitable for evaluating aluminum alloy fatigue [15] . However, only few studies reported nondestructive wood stress measurement by using surface SH-waves.
The broader goal of this study was to determine the drying stress on the wood surface during the drying process, by utilizing the surface SH-wave acoustoelastic technique. As a first step, velocities of a surface SH- wave that propagated through the wood were measured in order to establish the possibility of surface SH-waves as a novel nondestructive stress measurement technique.
2. Materials and Methods
2.1. Materials
Air-dried Japanese cypress (Chamaecyparis obtusa Endl) was used as the test specimen. The test specimen dimensions were 390 mm (longitudinal) × 80 mm (radial) × 80 mm (tangential). Moisture content and density were 7.9% and 0.45 g/cm3, respectively.
2.2. Ultrasonic Measurement
A surface SH-wave was generated on the surface of a Japanese cypress column as shown in Figure 1. Wedge transducers made a shear wave incident obliquely with respect to the lumber surface. The angle of incidence was 48.59˚. The wedges were made from polyetherimide resin. The measurement of receiving waveforms was performed by using an ultrasonic pulser-receiver (models JPR-10CK by Japan probe, Japan) and shear wave transducers with a natural frequency of 500 kHz and diameter of 1 inch (models CR-0016-SA by Staveley Instruments, USA), as shown in Figure 1. In addition, epoxy resin (SH111) was used as the coupling medium to improve the bonding between the transducers, the wood specimen and the wedges.
The wedge transmitter was fixed at the wood specimen edge. The wedge receiver was slid along the wood longitudinal direction, as shown in Figure 2. The receiving waveforms of surface SH-wave were recorded on a personal computer every 50 mm. The measurement positions were the four sides of the wood specimen (A, B, C, D), three lines per one side (L1, L2, L3).
Propagation time was calculated by using the peak amplitude of the first receiving waveform with zero crossing method. The propagation time measurement was repeated three times, and the resulting experimental values were averaged.

Figure 1. Schematic of surface SH-wave velocity measurement.

Figure 2. Measurement positions of surface SH-wave velocity.
The surface SH-wave velocity  was calculated from Equation (1):
 (n = 1, 2, 3, 4, 5) (1)
where T is the propagation time and n is the receiver’s position.
2.3. Density and Moisture Content
Following the ultrasonic measurements, wood specimen was cut into small pieces, each 10-mm thick. These pieces were used for measuring air-dried density and moisture content. Air-dried density was measured using the water displacement method. Sliced specimen pieces were dried overnight in a constant-temperature oven at 105˚C. The moisture content of wood was calculated as the ratio of the water content weight to the oven-dried weight.
3. Results and Discussion
3.1. Receiving Waveforms of Surface SH-Wave
Figure 3 shows the typical receiving waveforms of the surface SH-wave. The inter-wedge distances were 100, 150, 200, 250, and 300 mm. As the inter-transducer distance increased, the receiving waveforms moved to the right. Figure 4 shows the propagation time TR and the receiving wave amplitude AR vs. the measurement position. TR and AR were obtained from the waveform in Figure 3. As shown in Figure 4, TR increased from 130 µs to 270 µs as the wedge distance LW increased. TR was positively correlated with LW at 1% of significance level (r = 1.00). On the other hand, AR decreased from 2.0 mV to 0.6 mV as the wedge distance LW increased. AR was negatively correlated with LW at 1% of significance level (r = 0.99).
When the knots were located between the wedges, the amplitude of the receiving waves became smaller or non-detectable. Sandoz reported that ultrasonic wave velocities in the longitudinal direction were negatively
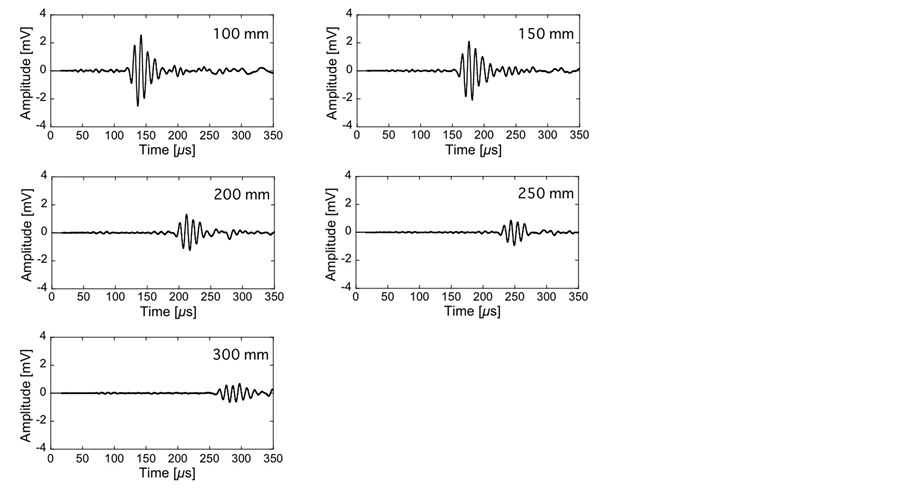
Figure 3. Surface SH-wave receiving waveforms at different measurement positions.

Figure 4. Propagation time and amplitude vs. the measurement position. Closed circles: propagation time. Open circles: amplitude.
correlated (r = −0.48) with the number of knots on the spruce lumber surface [16] . Additional experiments are needed to determine the effect of knot size on the propagation characteristics of SH-waves.
3.2. Distribution of Surface SH-Wave Velocities
Figure 5 shows the distribution of surface SH-wave velocity. Velocity ranged from 1270 m/s to 1496 m/s. The averaged velocity was 1384 ± 57 m/s. Bucur et al. reported surface wave velocity for spruce timber ranging from 1113 m/s to 1210 m/s [17] . The experimental values in this study almost agreed with those obtained in the previous studies. The value of velocity varied depending on the measurement location. The averaged velocities in the outer part (L1, L3) and the central part (L2) were 1406 ± 52 m/s and 1342 ± 44 m/s, respectively. As shown in Figure 5, the velocities in the central part were slower than those in the outer part. Wood is a biomaterial with three orthotropic axes. Specifically, for softwood such as Japanese cypress more than 90% is contributed by the axial cells (i.e., tracheids), which are highly elongated in the grain direction. Tracheid structures determine the physical and mechanical properties of wood. An ultrasonic wave velocity is different in the propagation direction and polarization direction [17] - [20] . Bucur et al. concluded that for softwood and hardwood the longitudinal and shear wave velocities depend on the three orthotropic directions [17] . For Japanese cypress, Hasegawa et al. reported the longitudinal wave velocities in the three directions as 4492 m/s, 1865 m/s, and 1389 m/s [18] . In addition, Mishiro reported the longitudinal wave velocities in the three directions as 5010 m/s, 2050 m/s, and 1220 m/s [19] . Bucur reported the shear wave velocity polarized into the radial and tangential directions in wood as 1322 m/s and 1229 m/s for spruce (Picea abies (L.) Karst) and as 1517 m/s and 1273 m/s for beech (Fagus sylvatica L) [20] . In the present study, the SH-wave polarization direction corresponded to the tangential direction in the central part, and to the radial direction in the outer part. For these reasons, the velocities in wood were different for different locations in the same symmetry plane.
Figure 6 shows the relationship between the velocity and the moisture content. Velocity and moisture content were negatively correlated at 1% of significance level (r = 0.38). Longitudinal wave velocity in the longitudinal direction decreased with increasing moisture content until the fiber saturation point (FSP) was reached [21] [22] . In this study, the moisture content was 6.4% to 8.7% below FSP. The dependence of velocity on the moisture content was the same as that observed in the previous study. However, few studies have reported the relationship between shear wave velocity and moisture content. In this study, both dependences were experimentally confirmed for the first time. These results suggest that the moisture content effect has to be considered for applying surface SH-wave acoustoelastic technique to drying stress measurement in wood.

Figure 5. Distribution of surface SH-wave velocities.
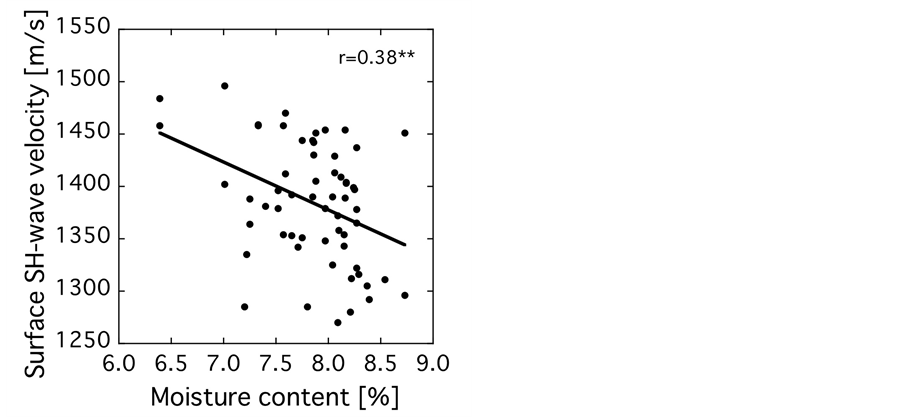
Figure 6. Surface SH-wave velocity vs. the moisture content.
4. Conclusions
A surface SH-wave was generated on the surface of a Japanese cypress column, and its velocity distribution was measured. Surface SH-wave velocity was lower in the central part of the test lumber and higher in the outer part. Surface SH-wave velocity was negatively correlated with the moisture content at 1% of significance level. Most importantly, this study could be considered as the first step toward the application of a surface SH-wave acoustoelastic technique to nondestructive drying stress measurement in wood. In the future, the following issues will have to be addressed:
1) Propagation direction: In this report, the surface SH-wave propagated in the longitudinal direction. It is important to determine the propagation characteristics for the tangential and radial directions.
2) The effect of the moisture content: Ultrasonic wave velocity was changed for moisture content below the fiber saturation point (30%). It is necessary to measure the velocity change as the wood specimen moisture content changes over time.
3) The effect of the applied stress on surface SH-wave velocity: For acoustoelastic technique, the ultrasonic wave velocity changes due to a drying stress are evaluated. It is necessary to investigate the effect of the applied stress on the surface SH-wave velocity.
Acknowledgements
This research was supported by the Japanese Society for Non-Destructive Inspection. The cost of publication was supported in part by LIXIL JS Foundation.
References
- Simpson, W.T. (1983) Drying Wood: A Review―Part I. Drying Technology, 2, 235-264. http://dx.doi.org/10.1080/07373938308959827
- Lee, N.H., Li, C., Zhao, X.F. and Park, M.J. (2010) Effect of Pretreatment with High Temperature and Low Humidity on Drying Time and Prevention of Checking during Radio-Frequency/Vacuum Drying of Japanese cedar Pillar. Journal of Wood Science, 56, 19-24. http://dx.doi.org/10.1007/s10086-009-1050-4
- Matsumoto, A., Oda, H., Arima, T. and Fujimoto, N. (2012) Effect of Hot-Pressing as a Pre-Treatment for Prevention of Surface Checks in Sugi Columns with Pith. Mokuzai Gakkaishi, 58, 34-43. http://dx.doi.org/10.2488/jwrs.58.34
- Kodama, Y. and Kawasaki, Y. (1994) An Estimating Method of Drying Stress for Column Lumber. Mokuzai Kougyo, 49, 120-123.
- Watanabe, K., Kobayashi, I., Matsushita, Y., Saito, S., Kuroda, N. and Noshiro, S. (2014) Application of Near-Infrared Spectroscopy for Evaluation of Drying Stress on Lumber Surface. Drying Technology, 32, 590-596. http://dx.doi.org/10.1080/07373937.2013.846911
- Watanabe, K., Kobayashi, I., Saito, S., Kuroda, N. and Noshiro, S. (2013) Nondestructive Evaluation of Drying Stress Level on Wood Surface Using Near-Infrared Spectroscopy. Wood Science and Technology, 47, 299-315. http://dx.doi.org/10.1007/s00226-012-0492-9
- Benson, R.W. and Raelson, V.J. (1959) Acoustoelasticity. Production Engineering, 30, 56-59.
- Crecraft, D.I. (1967) The Measurement of Applied and Residual Stresses in Metals Using Ultrasonic Waves. Journal of Sound and Vibration, 5, 173-192. http://dx.doi.org/10.1016/0022-460X(67)90186-1
- Fukuoka, H., Toda, H. and Naka, H. (1983) Nondestructive Residual-Stress Measurement in a Wide-Flanged Rolled Beam by Acoustoelasticity. Experimental Mechanics, 23, 120-128. http://dx.doi.org/10.1007/BF02328690
- Chaki, S. and Bourse, G. (2009) Stress Level Measurement in Prestressed Steel Strands Using Acoustoelastic Effect. Experimental Mechanics, 49, 673-681. http://dx.doi.org/10.1007/s11340-008-9174-9
- Lillamand, I., Chaix, J.F., Ploix, M.A. and Garnier, V. (2010) Acoustoelastic Effect in Concrete Material under Uni- Axial Compressive Loading. NDT & E International, 43, 655-660. http://dx.doi.org/10.1016/j.ndteint.2010.07.001
- Hasegawa, M., Yano, Y., Matsumura, J. and Oda, K. (2012) Prospects for Within-Tree Variation of the Acoustoelastic Behaviors in Japanese Cedar. NDT & E International, 49, 57-63. http://dx.doi.org/10.1016/j.ndteint.2012.03.010
- Hasegawa, M., Matsumura, J., Kusano, R., Tsushima, S., Sasaki, Y. and Oda, K. (2010) Acoustoelastic Effect in Melia azedarach for Nondestructive Stress Measurement. Construction and Building Materials, 24, 1713-1717. http://dx.doi.org/10.1016/j.conbuildmat.2010.02.018
- Tohmyoh, H., Ochi, Y. and Matsumura, T. (2001) Study on Detection and Quantitative Evaluation of Fatigue Cracks Using Surface SH Waves. Transactions of the Japan Society of Mechanical Engineers Series A, 67, 1508-1513.
- Yamagishi, H. and Fukuhara, M. (2007) Determination of Cyclic-Tension Fatigue of Al-4Cu-1Mg Alloy Using Ultrasonic Shear Waves. Materials Transactions, 48, 550-555. http://dx.doi.org/10.2320/matertrans.48.550
- Sandoz, J.L. (1989) Grading of Construction Timber by Ultrasound. Wood Science and Technology, 23, 95-108. http://dx.doi.org/10.1007/BF00350611
- Bucur, V. (2006) Acoustics of Wood. Springer-Verlag, Berlin.
- Hasegawa, M., Takata, M., Matsumura, J. and Oda, K. (2011) Effect of Wood Properties on Within-Tree Variation in Ultrasonic Wave Velocity in Softwood. Ultrasonics, 51, 296-302. http://dx.doi.org/10.1016/j.ultras.2010.10.001
- Mishiro, A. (1996) Ultrasonic Velocity and Moisture Content in Wood II. Ultrasonic Velocity and Average Moisture Content in Wood During Desorption (1). Mokuzai Gakkaishi, 42, 612-617.
- Bucur, V. and Rocaboy, F. (1988) Surface Wave Propagation in Wood: Prospective Method for the Determination of Wood Off-Diagonal Terms of Stiffness Matrix. Ultrasonics, 26, 344-347. http://dx.doi.org/10.1016/0041-624X(88)90033-9
- Sakai, H., Minamisawa, A. and Takagi, K. (1990) Effect of Moisture Content on Ultrasonic Velocity and Attenuation in Woods. Ultrasonics, 28, 382-385. http://dx.doi.org/10.1016/0041-624X(90)90060-2
- Sandoz, J.L. (1993) Moisture Content and Temperature Effect on Ultrasound Timber Grading. Wood Science and Technology, 27, 373-380. http://dx.doi.org/10.1007/BF00192223
NOTES

*Corresponding author.