Journal of Electronics Cooling and Thermal Control
Vol.3 No.4(2013), Article ID:40806,11 pages DOI:10.4236/jectc.2013.34016
STAR CCM+ CFD Simulations of Enhanced Heat Transfer in High-Power Density Electronics Using Forced Air Heat Exchanger and Pumped Fluid Loop Cold Plate Fabricated from High Thermal Conductivity Materials
1Nonlinear FEA/CFD Multi-Physics Simulation Laboratory, Department of Mechanical Engineering, California State Polytechnic University, Pomona, USA
2Department of Mechanical Engineering, Faculty of Engineering, Thammasat University (Rangsit Campus), Bangkok, Thailand
3CD-Adpaco, One Technology Drive, Irvine, CA, USA
Email: kranderson1@csupomona.edu, medevost@csupomona.edu, pwatit@engr.tu.ac.th, niveditha.krishnamoorthy@cd-adapco.com
Copyright © 2013 Kevin R. Anderson et al. This is an open access article distributed under the Creative Commons Attribution License, which permits unrestricted use, distribution, and reproduction in any medium, provided the original work is properly cited.
Received November 12, 2013; revised December 5, 2013; accepted December 12, 2013
Keywords: CFD; High Thermal Conductivity; Heat Sink; Cooling Plate; Thermal Control
ABSTRACT
As telecommunication and RF power electronics applications continue to push the envelope of waste heat dissipation, more and more, we see a need for active thermal control employing forced air electronic cooling fans in unison with pumped fluid loops in order to meet temperature and performance requirements. This research paper presents results of applying Computational Fluid Dynamics (CFD) commercial industry STAR-CCM+ software for heat transfer and fluid flow simulation of a novel heat exchanger/cold plate fabricated from k-core high thermal conductivity material in order to realize thermal control system hardware design for very much applications to very large power density (~1 kW/m2) electronics packaging scenarios. Trade studies involving different heat exchanger/cold plate materials, as well as various fault scenarios within a mock-up of a typical electronics system, are used to illustrate the upper bounds placed on the convective heat transfer coefficient. Agreement between our present findings and previous research in the field of electronics cooling is presented herein.
1. Introduction
The novelty of the current research focuses on a system’s level approach to using CFD to examine “cause-and-effect” scenarios in an electronics cooling application. In particular, our thermal control solution uses a very high thermal conductivity material known as “k-core” [1] in order to implement a heat exchanger/cold plate used to cool high power density electronics packaging. Effective heat spreading has been implemented by previous investigators interested in heat transfer augmentation including the work of [2], which used anisotropic heat plate with preferential thermal conductivity to augment thermal performance. In the study of [3], the critical heat flux of a heat spreader was quantified. While in [4], the use of diamond coated materials was researched. This current paper utilizes Computational Fluid Dynamics (CFD) in order to study various causes and effects at a system’s level. The CFD work related to electronics currently available in the literature can be broken into the following categories based on level of characteristic thermal/fluid length scale, or overall size of the hardware being analyzed: MEMS level; chip/component level; Printed Circuit Board (PCB) board level; hand-held devices (cell phones, instrumentation, etc.); desk-top computer level; intermediate compact packaging level; rack-mounted server level; very large length scale (i.e. power grid distribution applications, etc.). Herein we are interested in the intermediate compact packaging level.
At the chip/component/PCB level, various researchers have used CFD to study electronics cooling with the use of a heat sink including the work of [5], which implements CFD to characterize the performance of carbon composite and copper heat sinks on the heat transfer in a computer CPU. The work of [6] utilizes CFD to perform trade studies on the modeling of finned heat sinks, while [7] has married experimental and CFD analysis to quantify the effects of heat sinks and base plates on heat transfer behavior. Finally the work of [8] performs CFD and presents heat transfer correlations for the optimization of fin heat sinks. At a desk-top computer level, CFD has been used to study the heat transfer in computer chassis and computer box such as the work in [9] which focuses on computer chassis heat transfer performance. The study of [10] implements CFD to investigate PCB heat transfer in a computer. The study of [11] investigates computer heat transfer and cooling using a heat-pipe. More generic analyses of using CFD to electronic systems are given in the work of [12-14], wherein system’s level analysis is performed using CFD to gain insight on heat transfer and thermal performance of various electronic devices, ranging from hand-held devices to desktop computers. The tutorial offered by [15] allows the novice to gain insight on how to use electronics packaging design lay-out strategies to realize more effective heat transfer flow field patterns. In the arena of rack mounted servers, several pertinent CFD based investigations have been carried out over the last decade or so. The most noteworthy of these is the study of [16], wherein a CFD tool is implemented to study the temperature distribution in rack mounted servers. The investigation of [17] uses a liquid cooling thermal management system to enhance the heat transfer in a rack cooling data center application, while the work of [18] outlines a road-map for future CFD work related to rack mounted cooling systems. For the intermediate length scale, the works of [19,20] address this type of hardware, but the studies only address moderate power density heat transfer thermal control strategies. The work of [19] includes the fidelity of the thermal vias, solder, PCB, and shelf interface. Other applications of using numerical heat transfer and CFD in electronic and avionic systems are given in [21,22]. Presently, there appears to be a void of CFD simulation databases addressing the so-called intermediate application level. The goal of this current study is to address this absence of literature by simulation of an intermediate sized electronics enclosure, which is subject to very large power densities. This is in an effort to address the ever changing requirements of affording more power in a smaller packaging level.
To date, CFD of intermediate level packaging highpower density enclosures has not been carried out comprehensively. Furthermore, there have been few or no CFD simulations of electronics cooling using CD-Adapco’s STAR-CCM+ CFD software in the literature, mainly ICEPAK and FLOTHERM, which have the tools of choice as evidenced in the works of [5,6,9,12-15]. To address this absence in the literature, the current CFD simulations focus on using STAR-CCM+ CFD to simulate heat transfer and fluid dynamic behavior in intermediate sized Telecommunication/Observatory Science/Electronics/RF/Avionics systems fabricated primarily from COTS (Commercially Available Off The Shelf) components (i.e. fans, heat-sinks, cold plates, etc.) to implement the thermal control solution. This current study focuses on cost-effective thermal control system alternative, in contrast to more cost-prohibitive solutions such as those involving heat pipes, nano-fluids and/or phase change materials. The current study uses CFD to quantify the effects of heat transfer augmentation using high thermal conductivity materials in high power density electronics cooling scenarios.
2. Heat Spreader Thermal Technology
Herein, “k-core” thermal conduction plates available from Thermacore, Inc. [1] are used in conjunction with a pumped fluid loop to illustrate the effects of heat transfer spreading. K-core heat spreader cold plates afford highefficiency heat transfer in the absence of moving parts, and are invaluable in applications where space, volume, seamless hardware integration and weight constraints dictate thermal design solutions. Physically, k-core base heat spreader cold plates transfer heat from sources such as high power dissipating electronic components, rejecting it to ambient air (through forced or natural convection) or liquid coolants (water, glycol/water mixtures, dielectric fluids, polyalphaolefin or PAO). These types of k-core cold plates are well suited for operating in harsh environments, including extreme temperatures/humidity, shock and vibration. For cooling high-power density applications, such as semiconductors, lasers, power generation, medical equipment, transportation, military electronics, etc., and other demanding applications where air cooling is insufficient, liquid cooling (pumped fluid loop) is essential. In this case Thermacore k-core based liquid cooled cold plates offer a feasible thermal control system solution. Thermacore’s custom liquid cooling component cold plates include tube-in-plate, aluminum vacumnbrazed and copper brazed types for various applications. Tube-in-plate cold plate materials consist of copper or stainless steel tubes pressed into a channeled aluminum or copper extrusion or machined plate. Thermacore also offers copper cold plates that incorporate vertical fin (micro-channel) technology or, for higher performance, our specialized powdered metal construction. Thermacore’s custom liquid-cooled assemblies are designed specifically for each application’s unique thermal/mechanical requirements. The physical concept of Thermacore’s k-core heat transfer technology is illustrated in Figure 1.
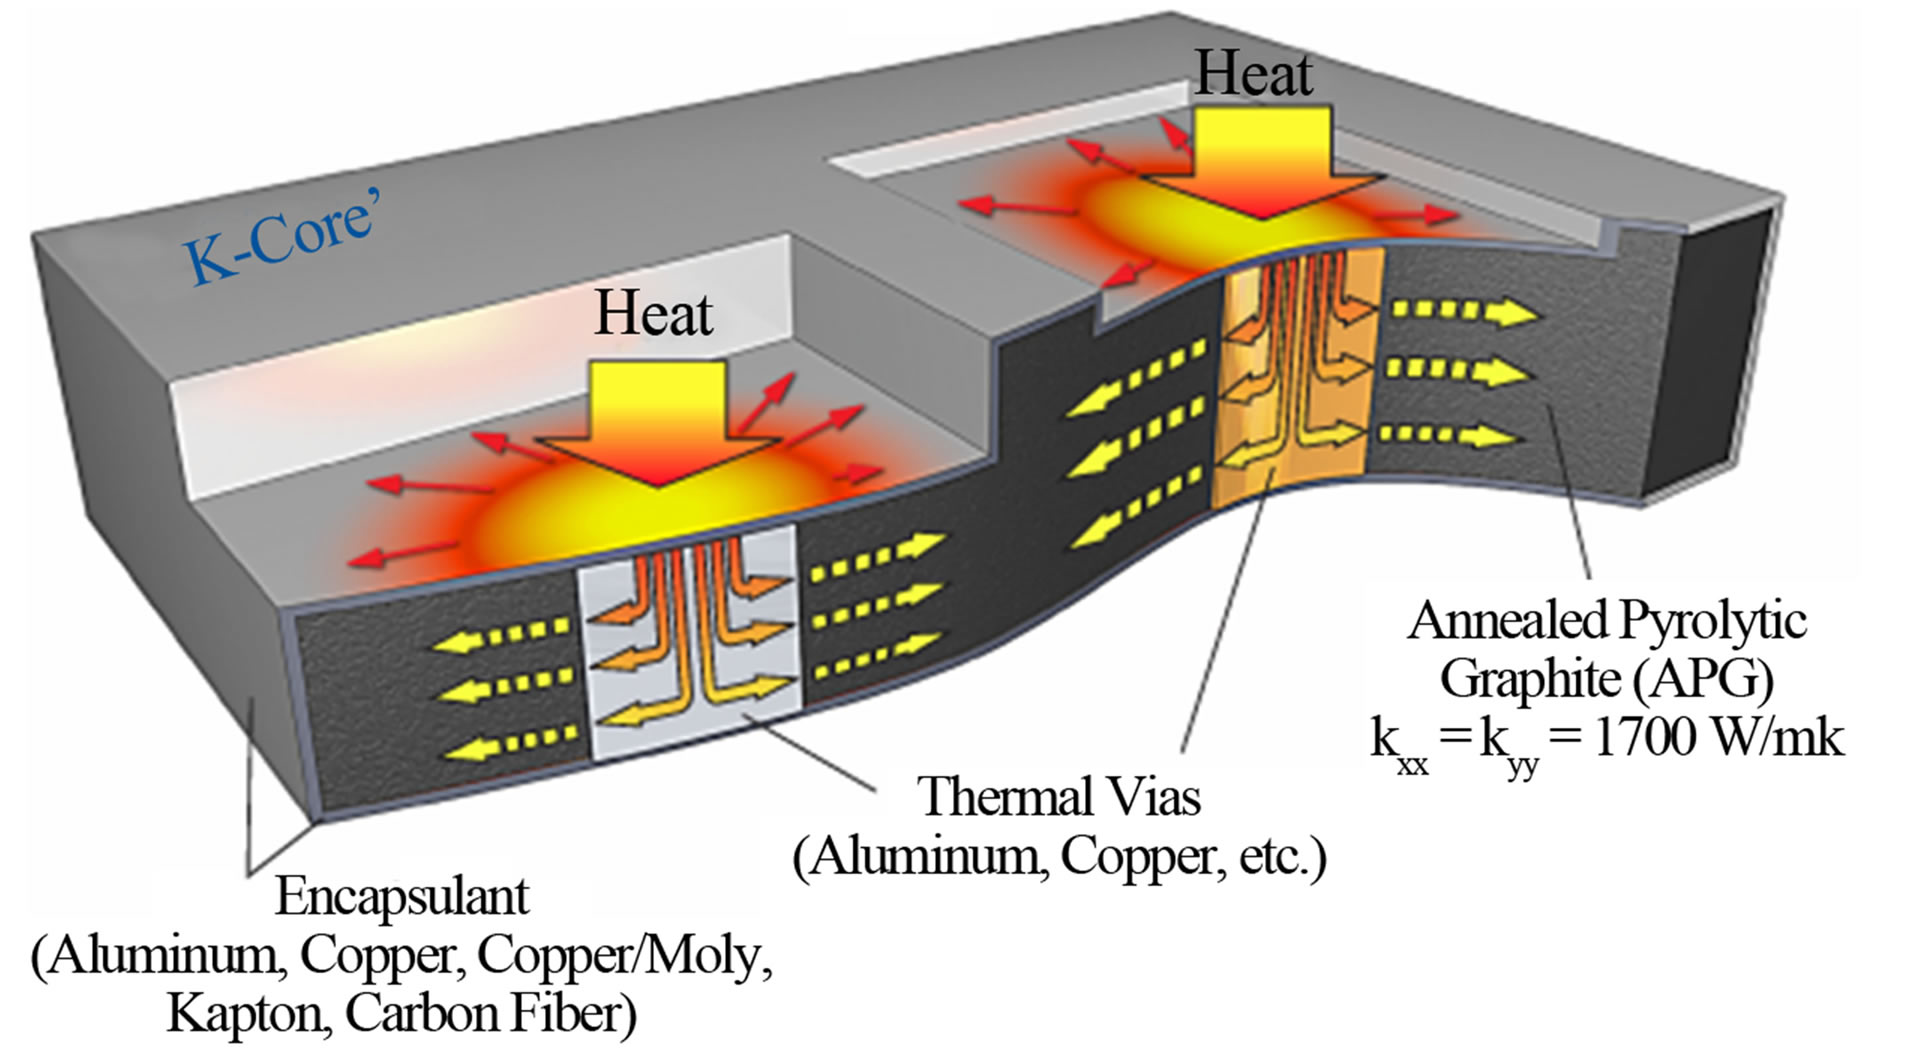
Figure 1. Thermacore k-core technology [1].
Figure 1 shows the various thermal technologies offered by Thermacore, Inc. Using Encapsulated Annealed Pryrolytic Graphite (APG) allows one to manufacture a device such as a heat spreader with heat sink integrated on one face while a labyrinth of tubing for a pumped fluid loop can be fabricated on the opposing face.
The encapsulant of Figure 1 sets the Coefficient of Thermal Expansion (CTE) and other structural properties. The encapsulant material is selected to satisfy requirements such as ease of integration into the overall system. Since the APG is anisotropic in thermal conductivity, i.e. the x-component, and y-component of thermal conductivity is very large with respect to the y-component of the thermal conductivity, the APG acts as an excellent mechanism with which to realize heat transfer enhancement via preferential heat spreading. Figure 2 illustrates the temperature dependency of the thermal conductivity of APG.
From Figure 2 it can be seen the APG has its largest thermal conductivity at 150 K (−123 C) where k= 2800 W/m-K making is a valuable thermal heat transfer material for spacecraft applications. For electronics cooling applications where the nominal temperature is on the range of 350 to 400 K (77 C to 127 C) the APG has a thermal conductivity of k = 1500 W/m-K (as compared to Copper have k = 400 W/m-K, and Aluminum = 200 W/m-K). In this current study we investigate the use of APG k-core technology for temperatures in the range of 266 K to 373 C (29 C to 100 C), k = 1600 W/m-K to k = 1100 W/m-K.
3. System Hardware Description
Figure 3 shows the layout of the electronics being investigated in this paper. The configuration of Figure 4 was selected in order to mimic an intermediately sized high power density power electronics application. The overall system consists of a very large housing with eight identical sub-modules arranged in order to minimize overall system volume. The sub-modules were each populated with various components, totaling twelve each per submodule. These components were left to be very generic
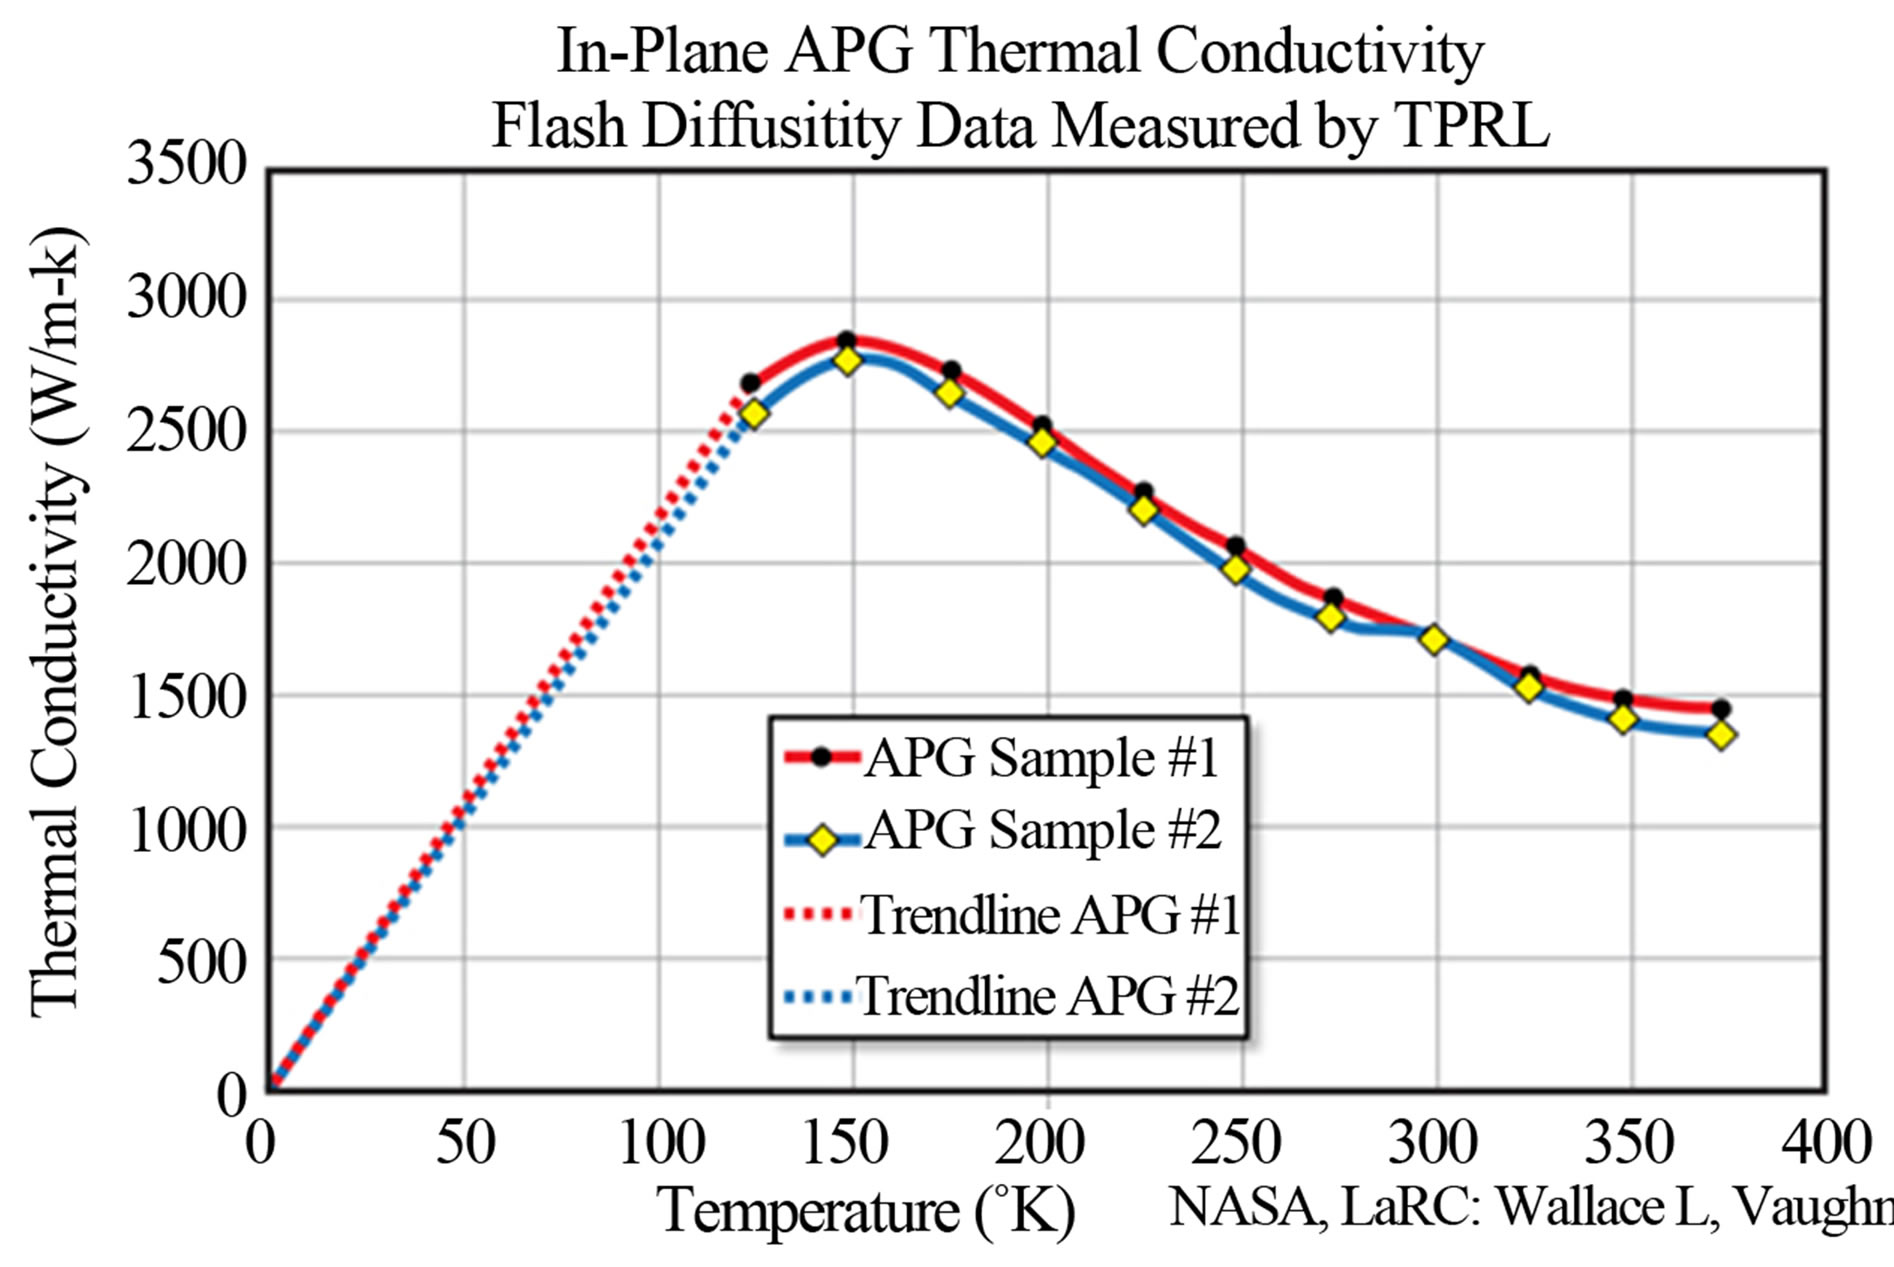
Figure 2. Thermal conductivity for APG material [1].
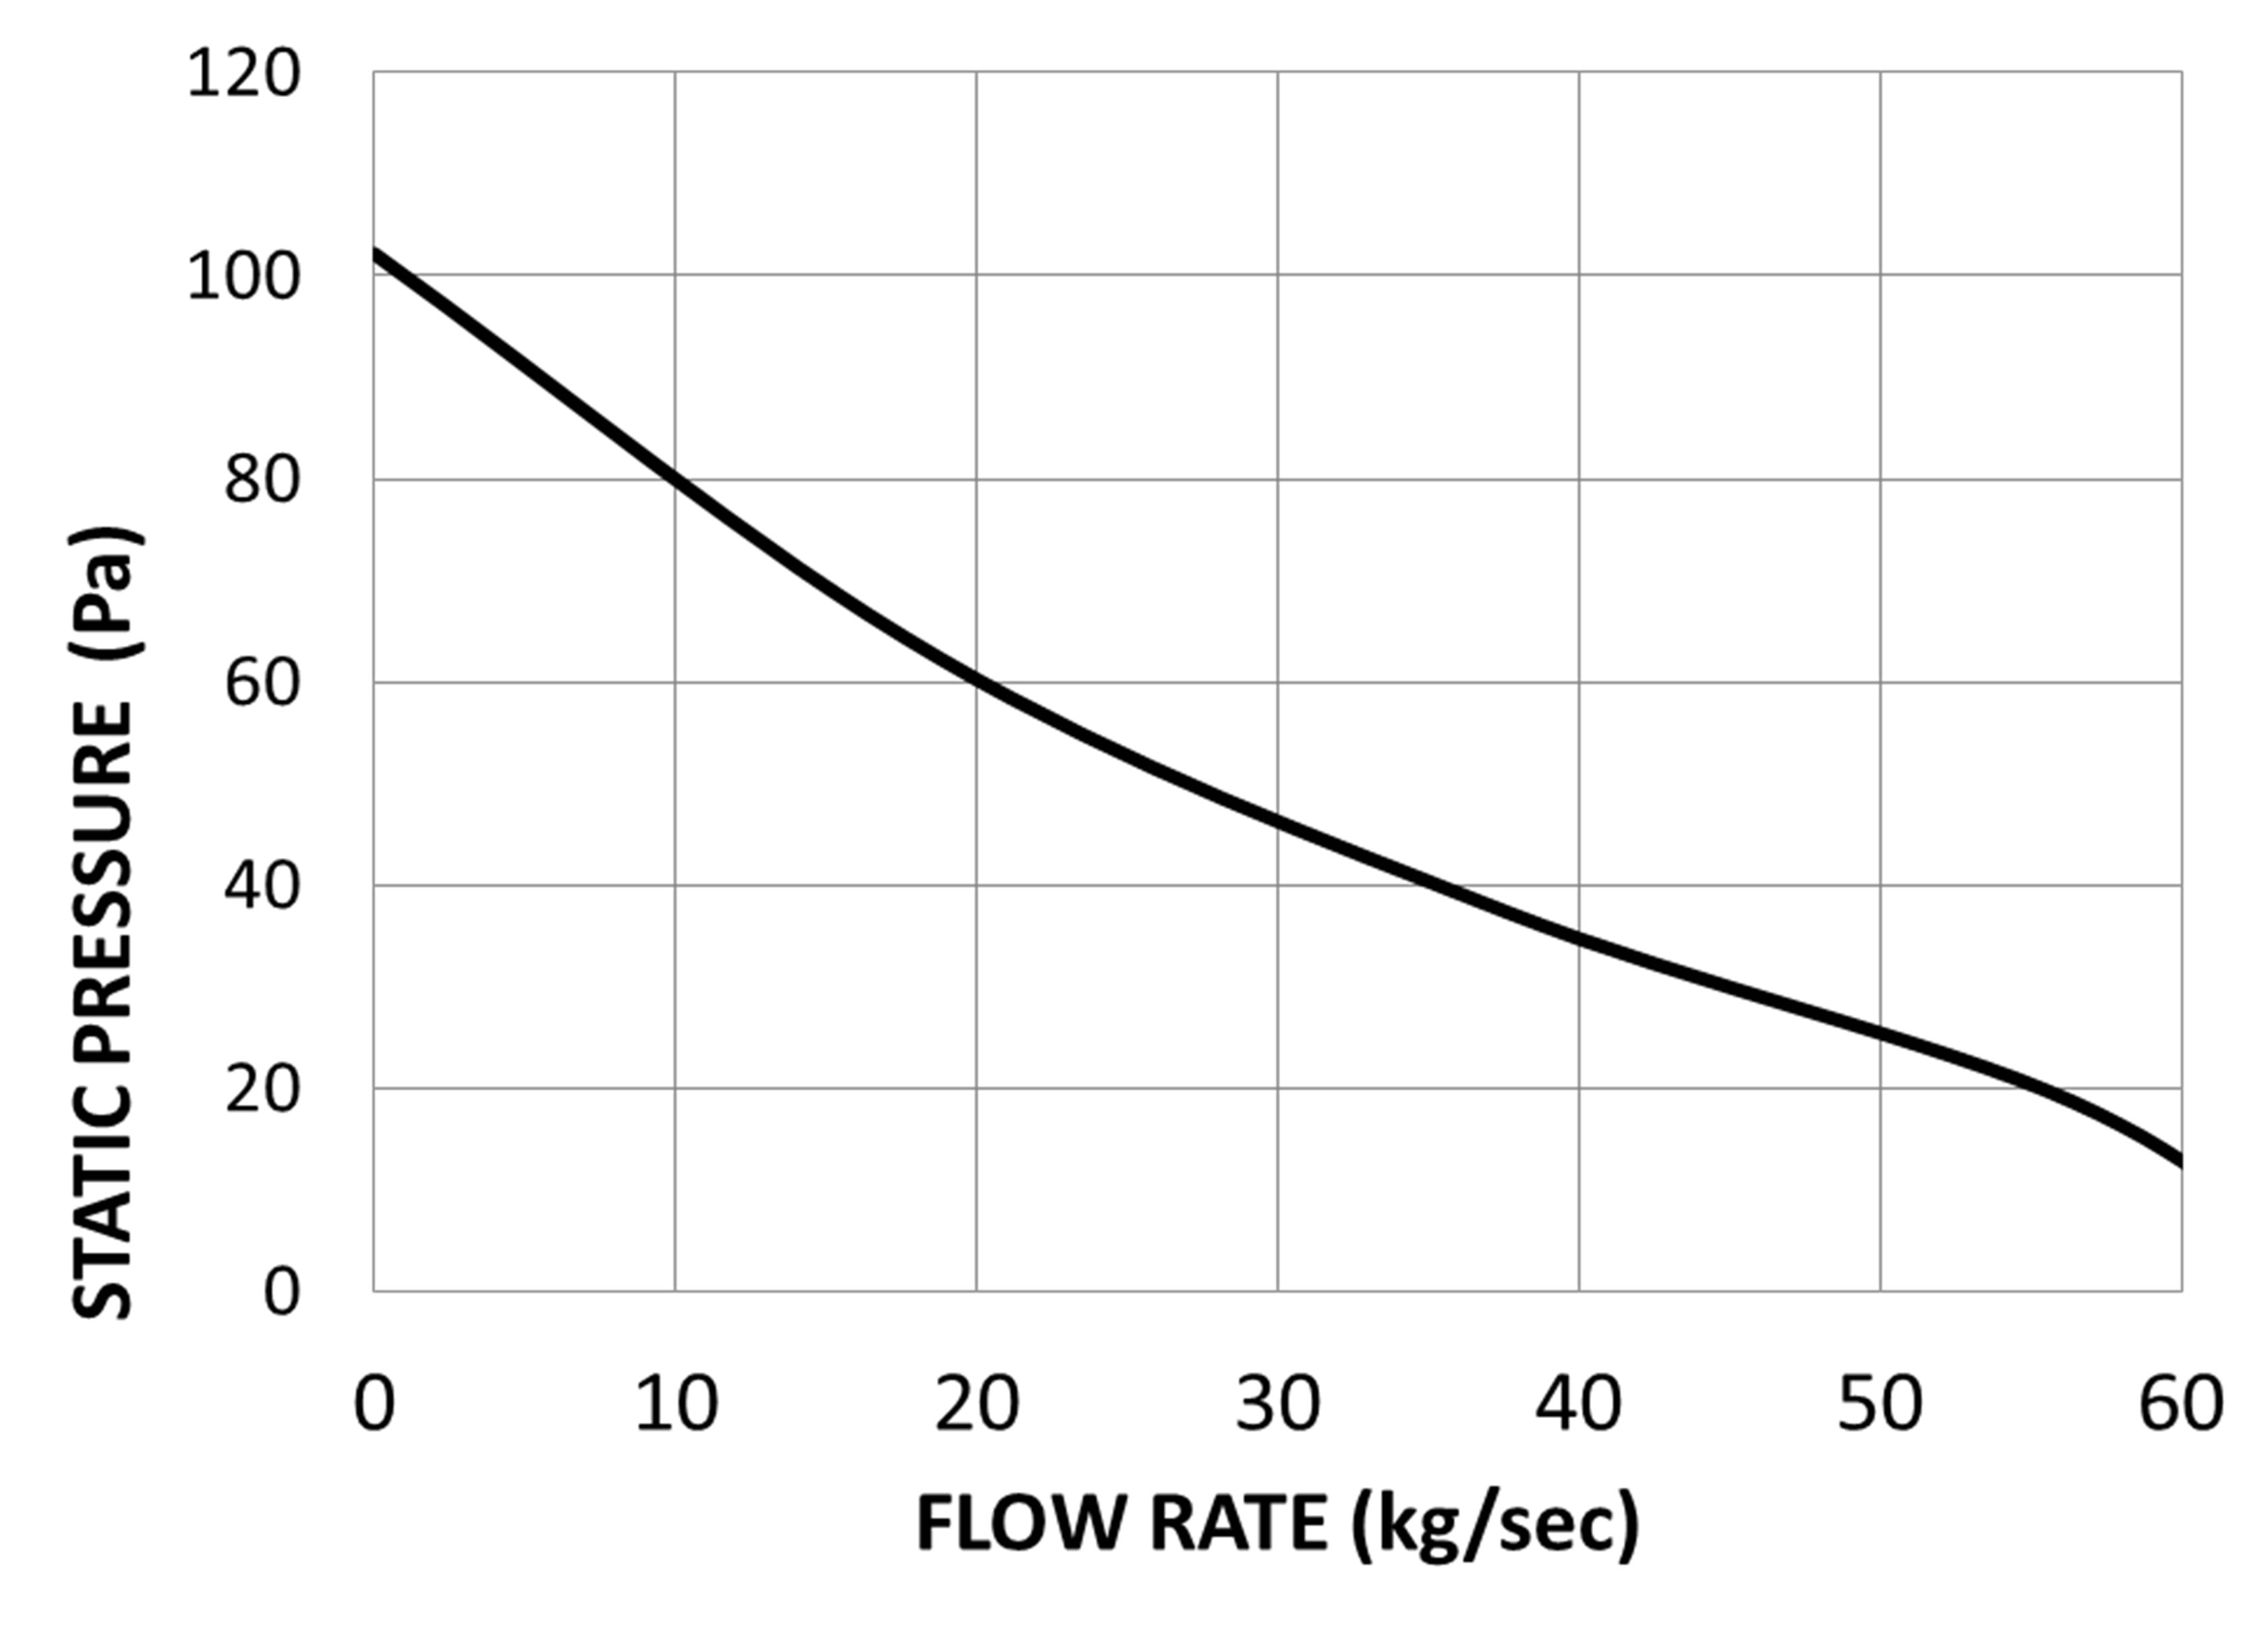
Figure 3. Fan curve specifications for thermal control hardware simulations.
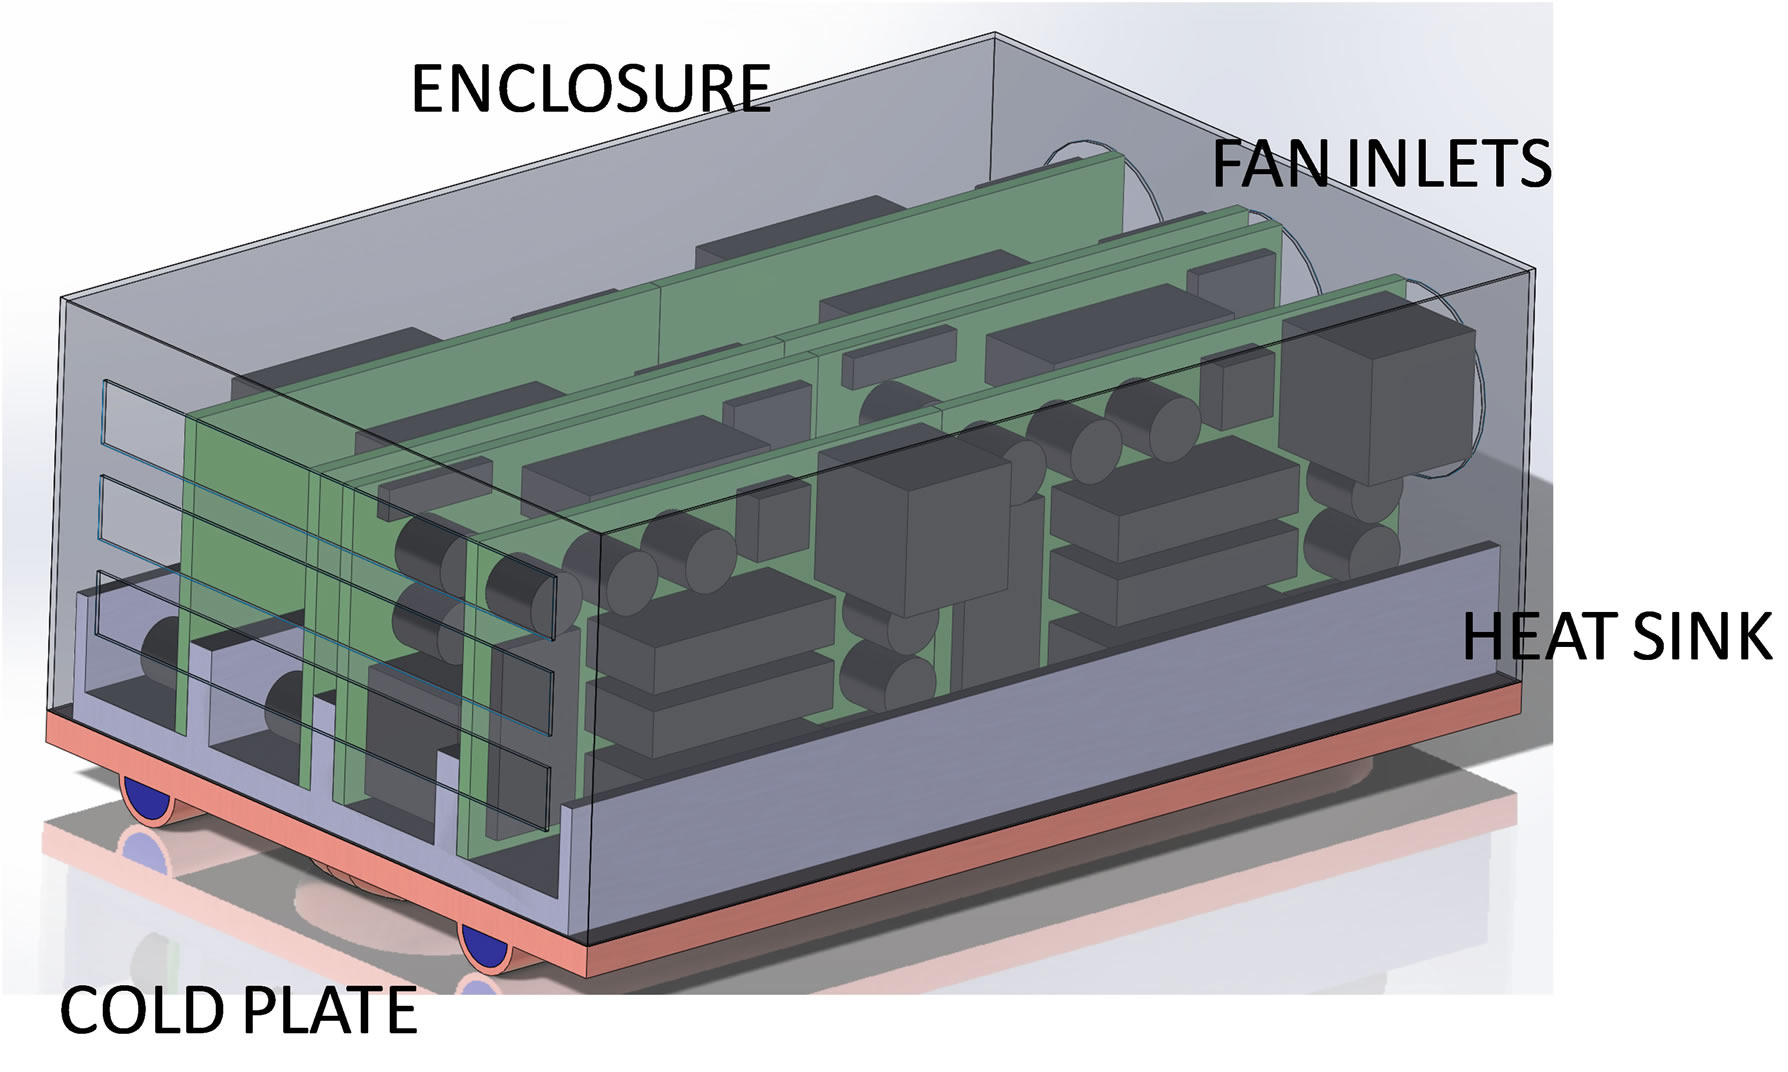
Figure 4. Electronics System Components.
in order to facilitate our trade study involving simulation of system level electronics using CFD.
As seen in Figure 4, the thermal control system is comprised of three major components; the heat sink, the cold plate and the forced convection fans/housing enclosure. The majority of heat transfer removal capacity is accomplished via the forced convection air flow of the fans, while the cold plate serves to hold a constant boundary temperature in order to act as a heat sink. This enclosure measures overall dimensions W*L*H = 0.5 m by 1.0 m by 0.5 m (19.7 inches by 39.4 inches by 19.7 inches, thus it is roughly the size of a foot-locker, smaller than a typical rack-mounted server, and larger than a typical PC workstation tower. As is traditionally done in practice in electronics manufacturing, no particular attention was paid to the exact layout of the overall system, i.e. the eight sub-modules were placed into the overall enclosure in a staggered configuration. This of course is not optimum, since some components on some of the submodules will be exposed to fans while others will not. The effects of material selection for the manufacturing of the heat exchanger and fluid loop cold plate has profound ramifications on the optimization of the heat transfer enhancement of the electronics package as a whole. Thus, the current study focuses on the effects of using the previously motivated APG k-core high thermal conductivity material in the fabrication of an integrated heat exchanger, cold plate on the convection heat transfer coefficient (aka h-value) in electronics cooling applications.
The CFD simulations presented herein utilized fully 3-d conjugate heat transfer; forced external air convection; forced internal cooling loop; solid conduction; surface to surface gray body radiation, turbulent. To mimic typical COTS cooling fans, the fan-curve of Figure 3 below was used in the simulations. Figure 3 gives fancurve characteristics for a fan rated at 30 kg/sec with 50 Pa static pressure (60 cfm with 0.2 inches W.G.).
The parametric trade space investigated over the course of our investigation is shown below in Table 1.
The electronics power listed as 500 to 1000 W in Table 1 was accomplished as per the following example, for a 720 W system, each component was assign 7.5 W, thus 7.5 W/component*12 components/sub-module*8 sub-modules/housing*1 housing = 720 W. Using the footprint of 1 m*0.5 m of the cold plate, this affords and electronics power density of 1440 W/m^2. According to Figure 5, the viable technologies for a tolerated temperature delta of 20 C involves direct air, forced convection, while for temperature deltas on the order of 100 C, a
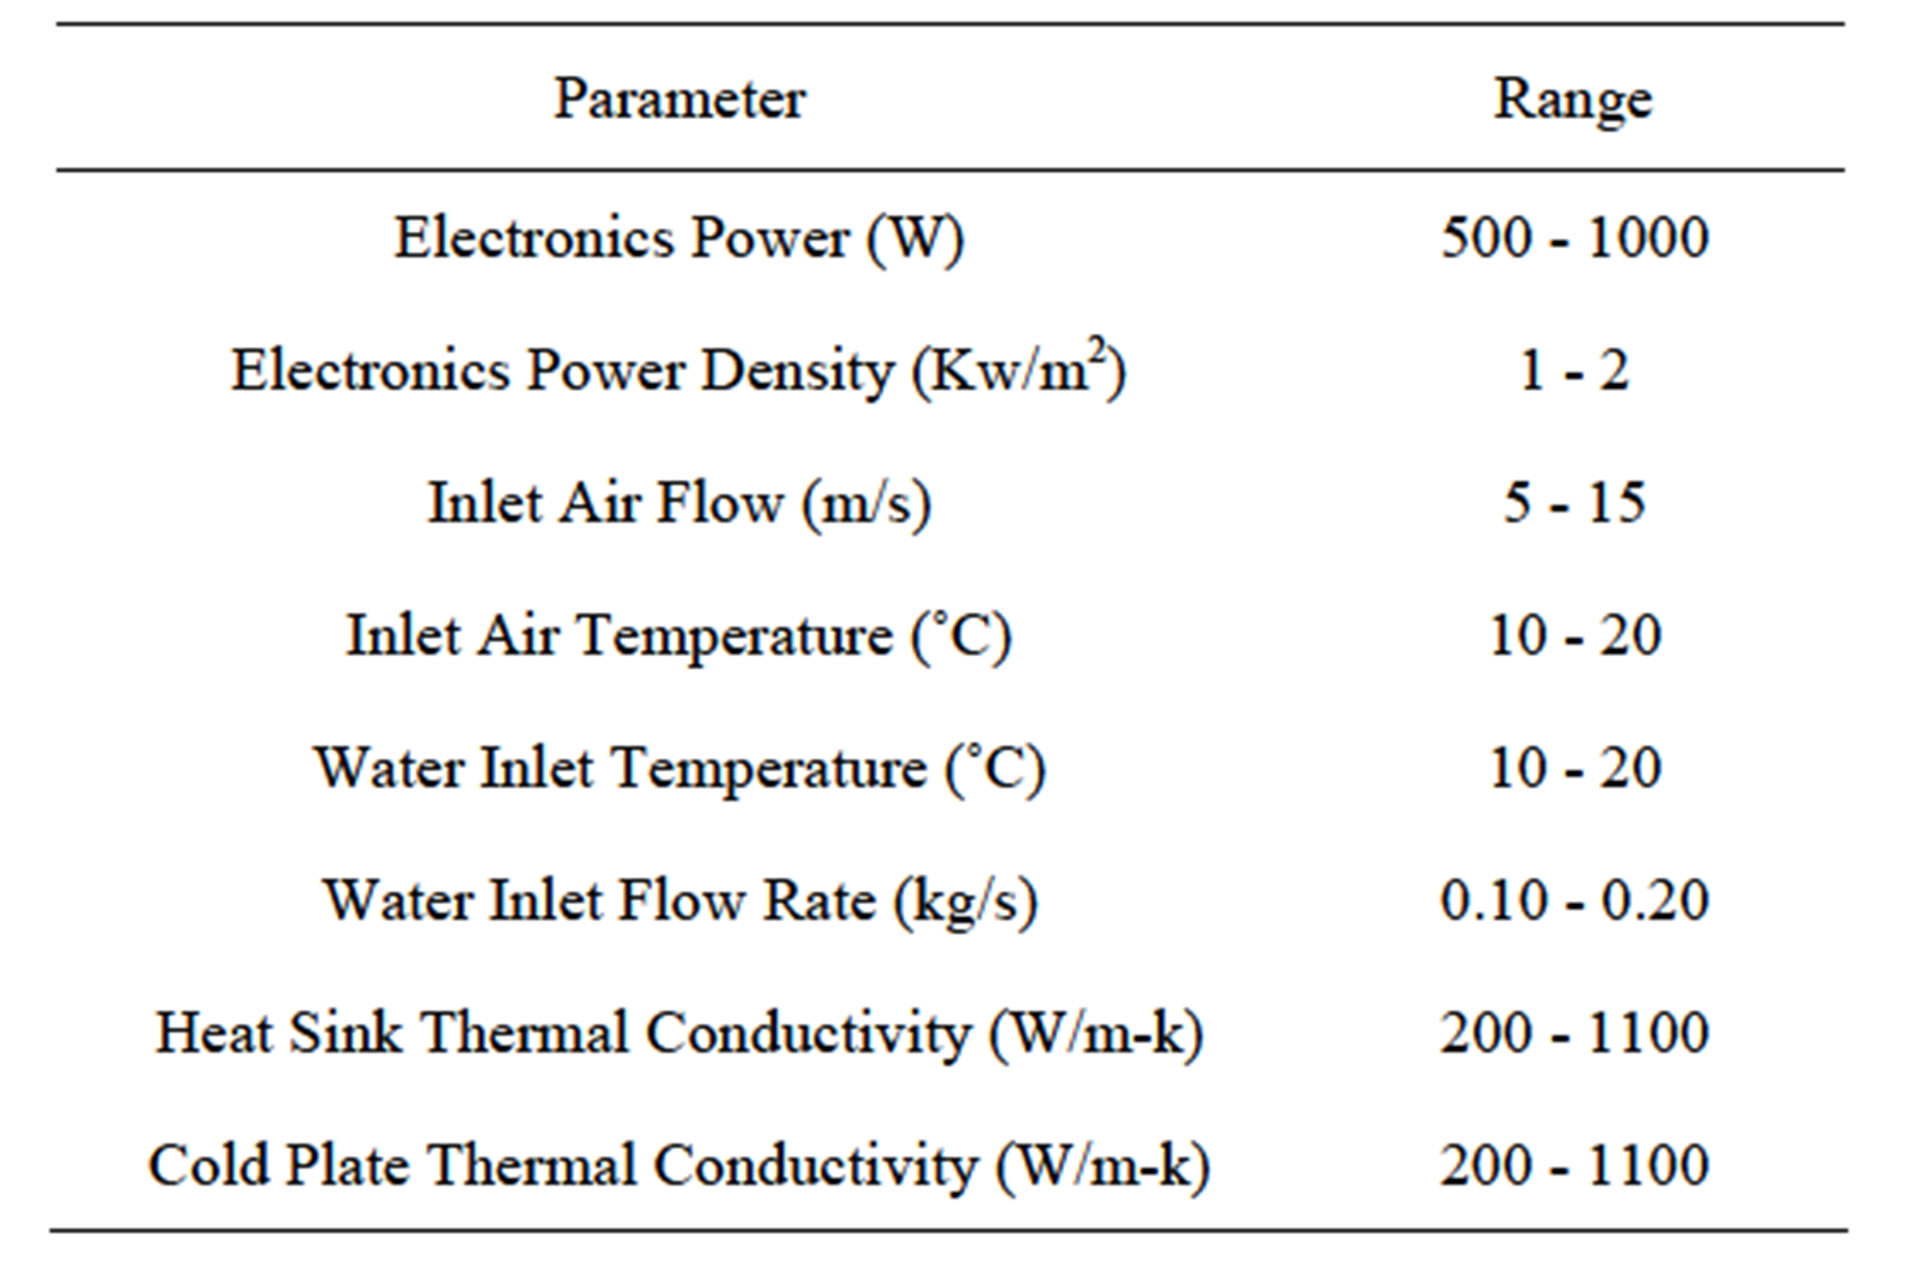
Table 1. Parametric trade space for k-core thermal control system study.
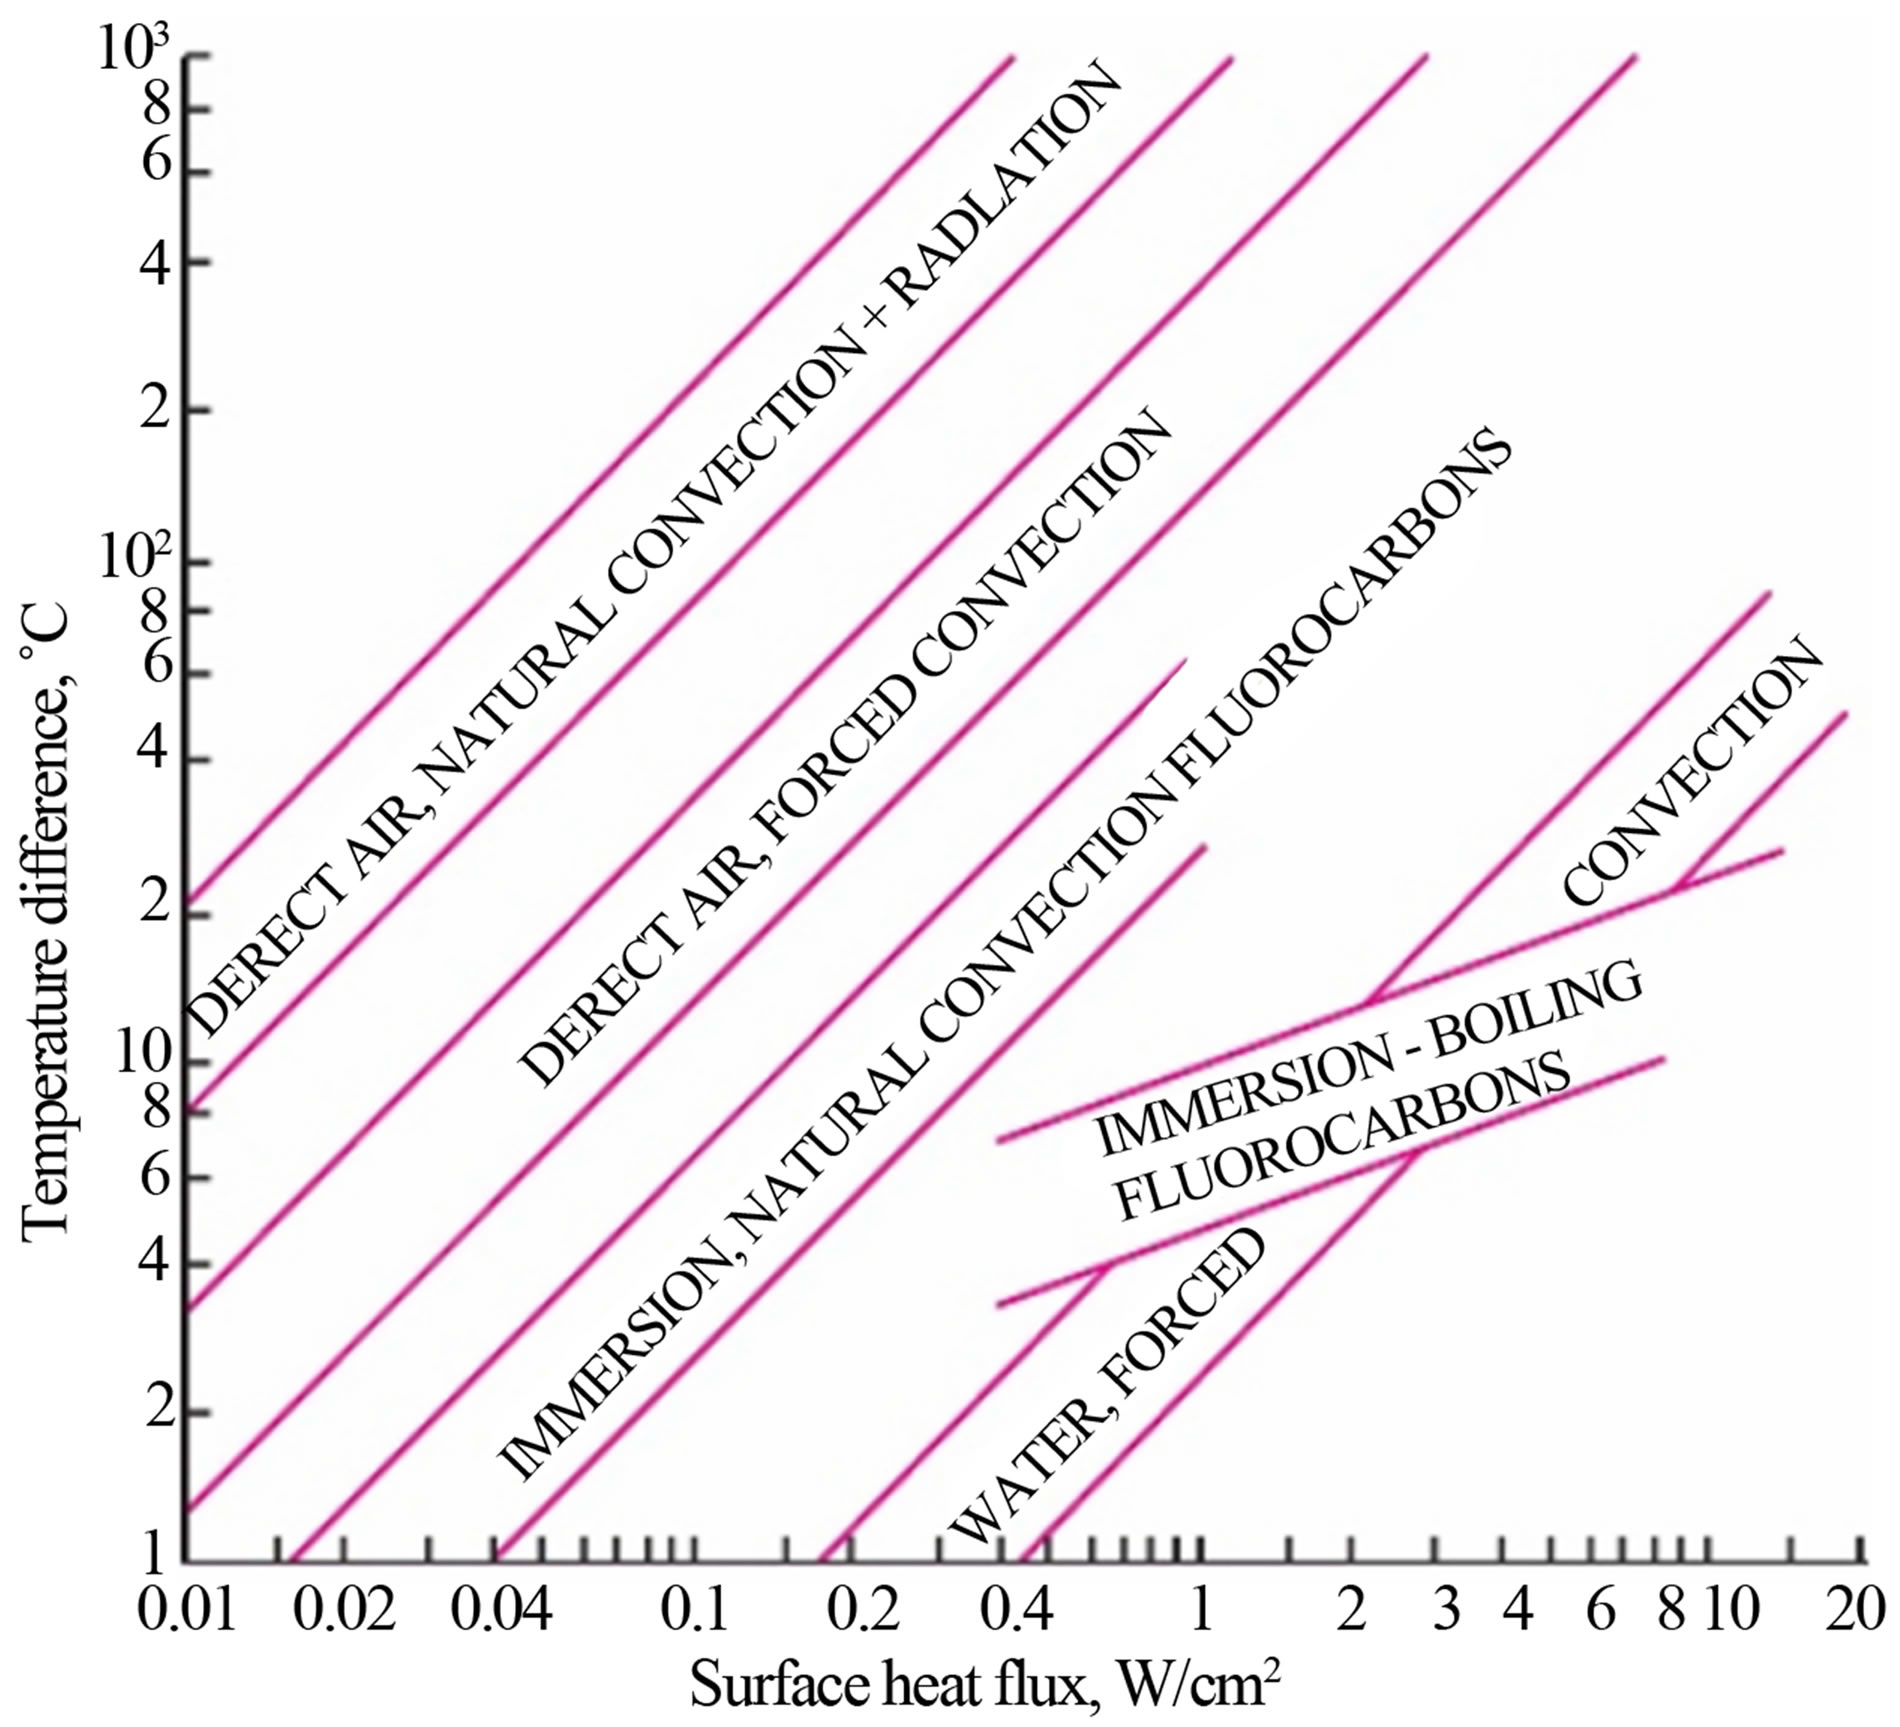
Figure 5. Roadmap of thermal technologies [23].
hybrid of forced air and natural convection in addition to radiation is recommended. However, in spacecraft and terrestrial applications of high power density heat transfer there is no gravity, thus natural convection cannot be relied on. Additionally, radiation effects in the presence of forced convection have been found to be minimal by prior CFD investigations [9,12,14].
Thus a hybrid solution of forced convection and highly thermally conductive heat sink/pumped fluid looped thermal control system architecture is proposed herein to address spacecraft and terrestrial and avionics applications which continue to push the envelope of power size to area ratio to the extreme limits of today’s capable “stateof-the-art” technologies.
4. CFD Model Description
The CFD package STAR-CCM+ from CD-Adapco was used to import the system geometry of Figure 3. The workflow in STAR-CCM CFD modeling is mush the same as in other packages, such as ANSYS-FLUEN, Flotherm, NX-Space Systems Thermal, COMSOL, etc. First the geometry is imported, then materials are assigned to components, boundary conditions are assigned, mesh is generated, solvers/models are selected, the equations of motion are then solved and results are post-processed. For the simulations outlined herein the STAR-CCM+ CFD software uses Polyhedral Unstructured Mesh with Prismatic Boundary Layer enhancement. The mesh used in the CFD simulations presented herein is shown below in Figure 6.
The software package STAR-CCM+ allows the user to specify the regions (parts) as well as the thermal interface between each part. The cooling fans are modeled in STAR-CCM using an in-place interface whereby in Figure 5 this is illustrated with the dark blue circles situated at the northwest portion of the diagram. These in-place interface fans allow the used to assign a fan-curve of the form of that given in Figure 5 to be keyed in as a polynomial curve fit. STAR-CCM+ also allows the user to model the swirl of the fan, however for this system’s level study, this option was found to be too computationally expensive, since we have three fans at the inlet of the housing to simulate. The impact of this modeling assumption if felt to be minimal, since our primary objecttive herein was to simulate the flow of air through the entire enclosure with a fan rated at a certain volumetric flow rate and static pressure drop, the use of interface fans is warranted. The study of swirl around the vicinity of the fans is not within the current scope of investigation.
4.1. Grid Independence Study
Typical cell count for the system level CFD model was on the order of 2.5 million cells. Five prismatic boundary layer cells were employed to resolve the boundary layer at all solid-fluid interfaces. Various trades were run in order to determine the optimum mesh size, for 2.5 million polyhedral cells, a base element size of 0.01 m was used, mesh independence studies centered around this value were performed, i.e. the base element size was varied from 0.005 m (more cells, highest fidelity mesh) to 0.02 m (fewer cells, coarsest mesh). A monitor point was selected in the model, and the primitive variables were monitored as the cell size was halved, resulting in the choice of 0.01 m (2.5 million cells) as the baseline model size. CPU run-time on a 64-bit quad-core DELL PC workstation was on the order of six hours.
4.2. Governing Equations
Headings, The governing equations solved in STARCCM+ via the Finite Volume Method for our laminar, conjugate heat transfer simulations are the incompressible Navier-Stokes equations stated below in continuous integral form
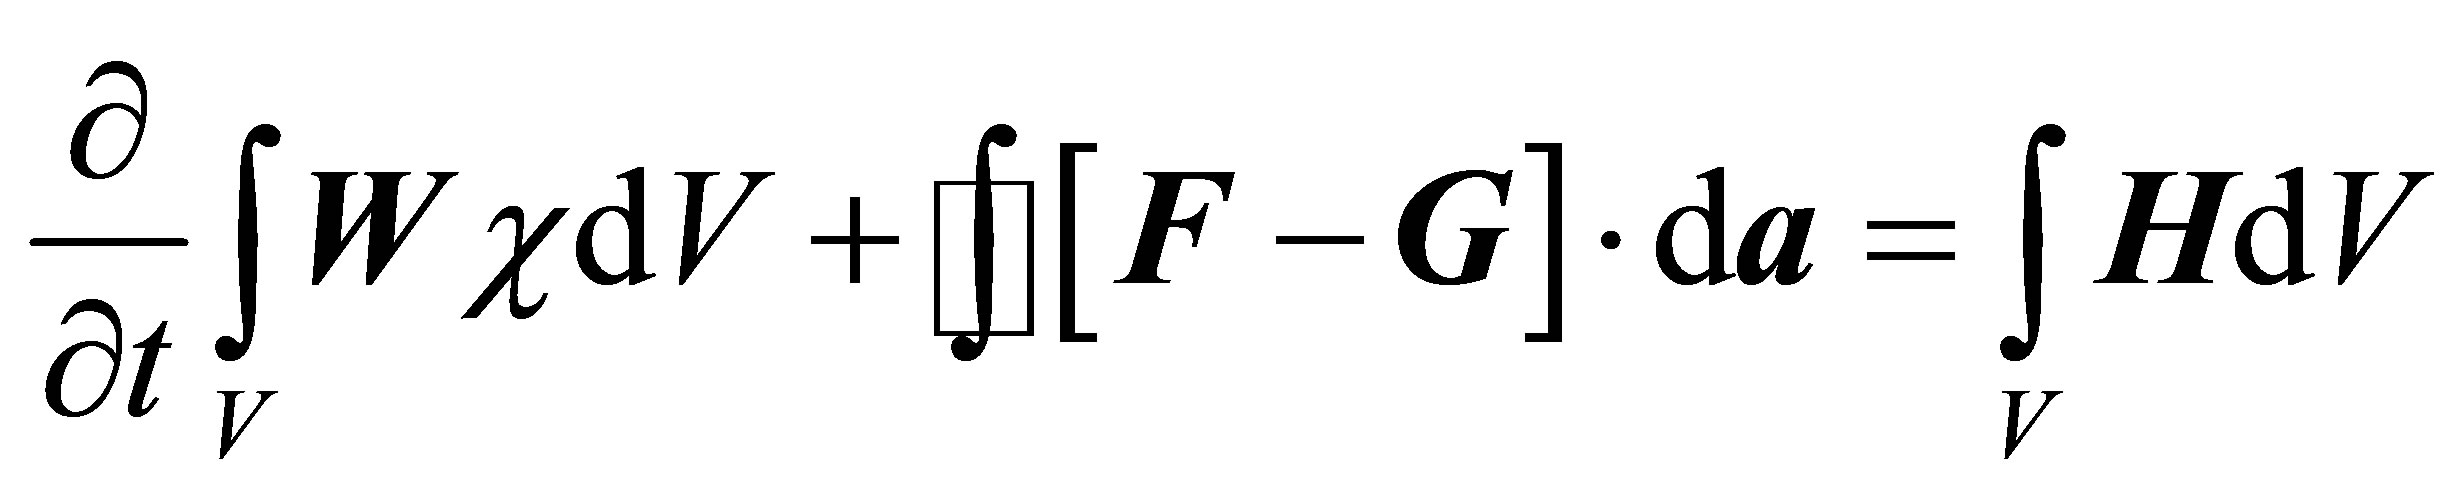 (1)
(1)

Figure 6. CFD mesh used in simulations.
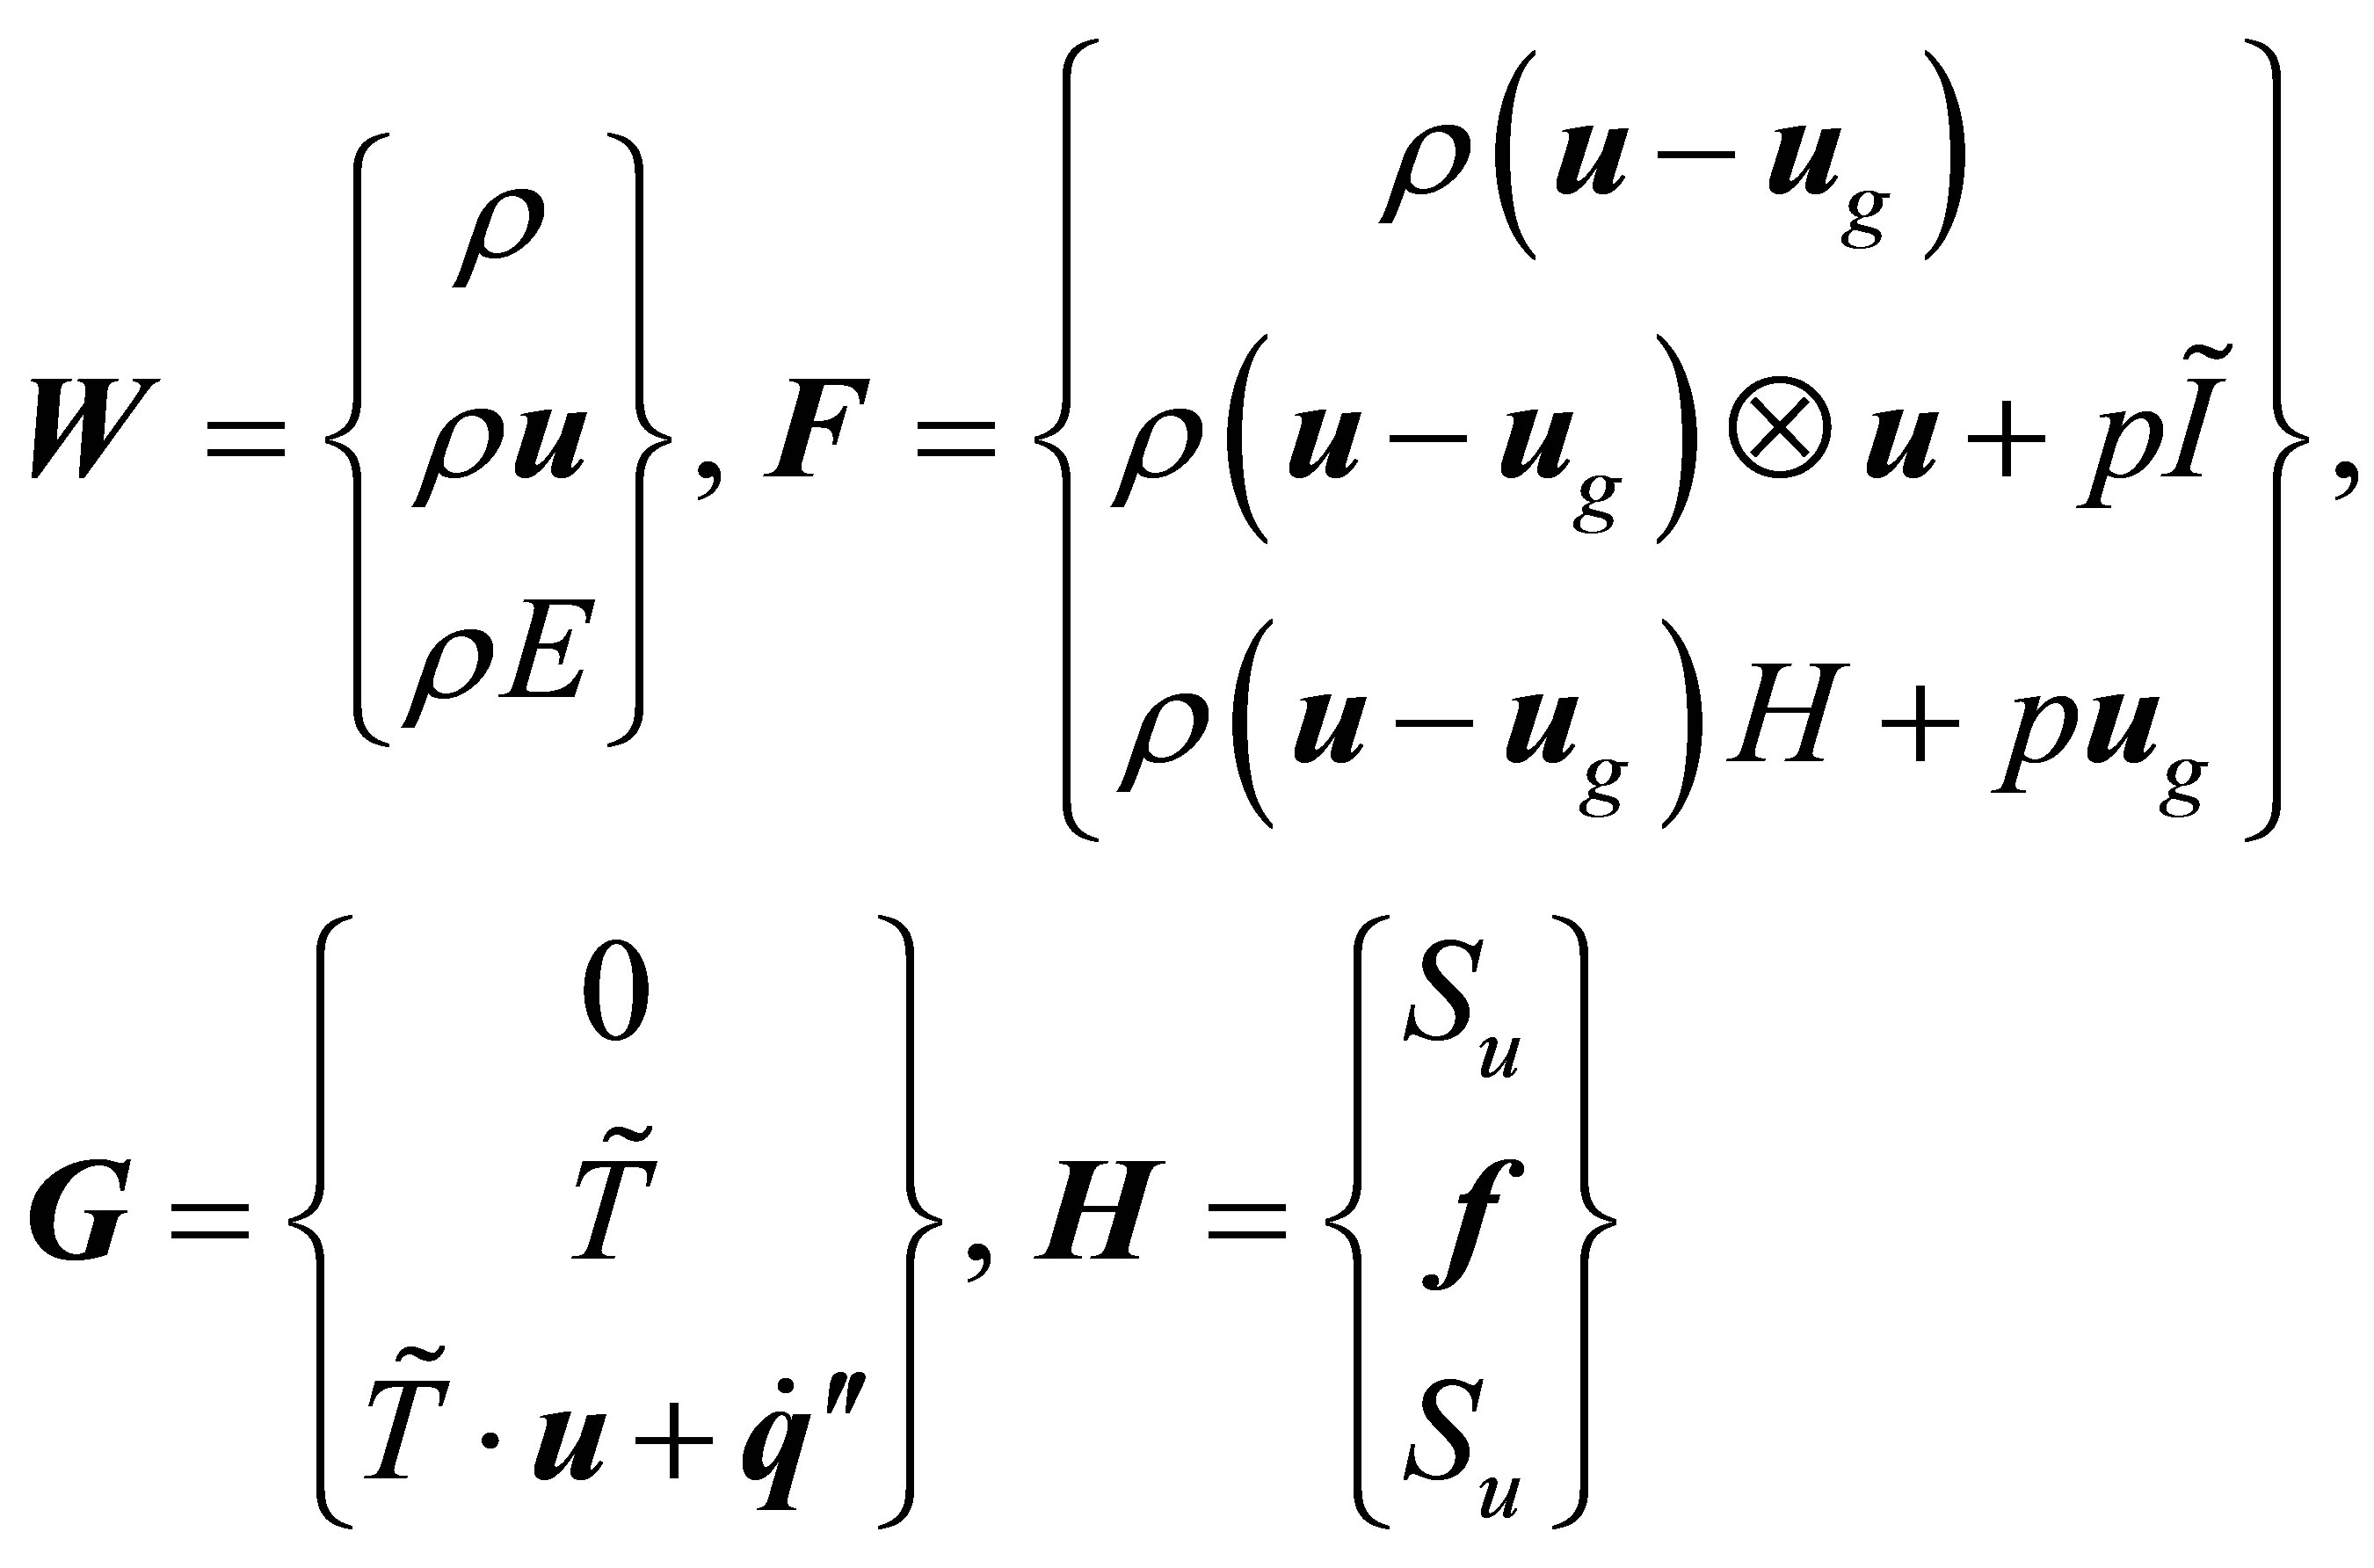 (2)
(2)
where r,  , E, and p denote the density, velocity, total energy per unit mass, and pressure of the fluid, respecttively. The parameter
  is the viscous stress tensor, while
  denotes the heat flux vector and
  is the grid velocity vector. The total energy is related to the total enthalpy via the caloric equation of state
 (3)
(3)
where the total enthalpy is the sum of the internal energy and the kinetic energy via
 (4)
(4)
For the remaining terms in the Navier-Stokes equation,  denotes the body force vector,
  is the vector of conserved quantities
  is the vector of inviscid terms,
  is the vector of viscous terms,
  is the identity tensor, c denotes the porosity, and m is the dynamic viscosity. The constitutive equation modeling heat conduction in the solid bodies is taken to by Fourier’s Law stated below in differential form
 (5)
(5)
The above equations are implemented on an unstructured polyhedral mesh and the resulting algrebraic equations are solved using the algebraic multi-grid method.
5. Results
The results for temperature distribution, flow vectors and streamlines in our simulations are illustrated in Figures 7-9. The parameters for the simulation were as follows: each component has 7.5 W giving 720 W for 12 components and 8 sub-modules. Additionally, each PCB card had an additional 10 W of power applied to it, thus 80 W for the total package of eight cards. Hence, this simulation is 800 W over a 1 m × 0.5 m footprint giving 1600 W/m2 = 1.6 kW/m2, which is in the category of a very high power density application. Figure 7 shows the inlet air coming from the fans at 303 K (30˚C) and a heat sink/cooling plate temperature of 283 K (10˚C). Figure 8 shows the velocity vectors for the situation of Figure 7, while Figure 9 illustrates streamlines of the flow field for the system of Figure 7.

Figure 7. Component temperatures.
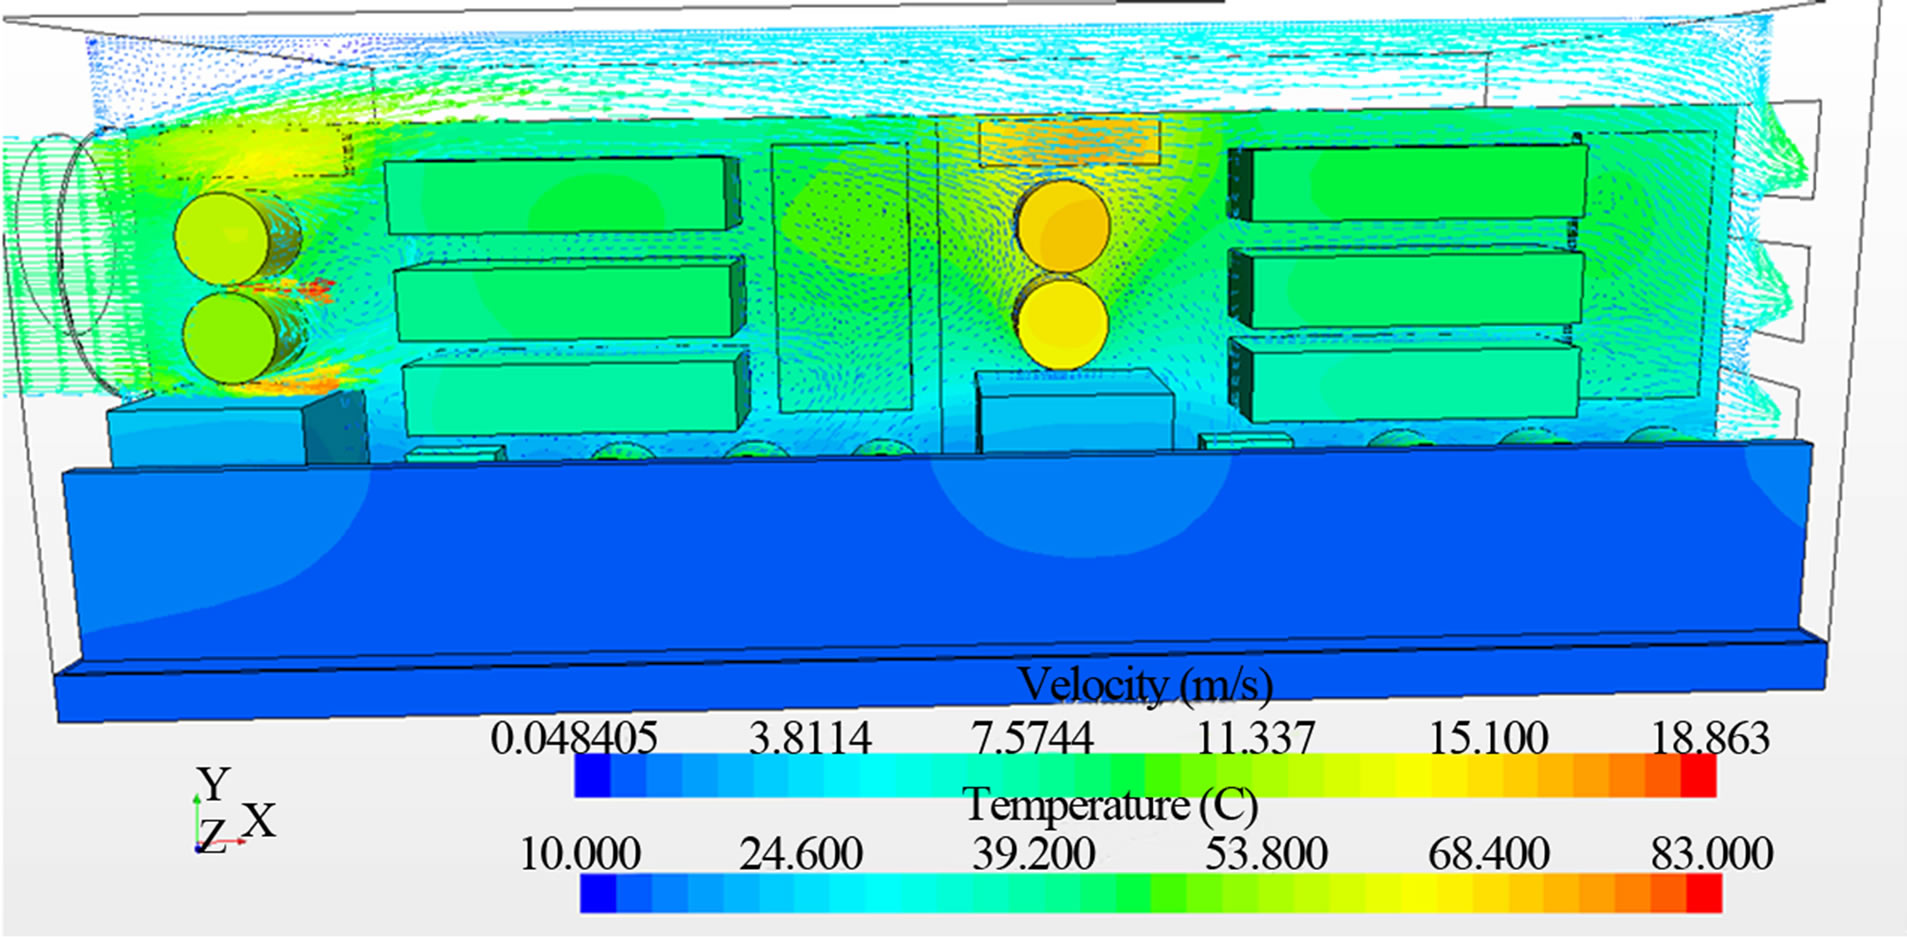
Figure 8. Velocity vectors colored by air speed and electronics components colored by temperature.

Figure 9. Streamlines colored by air stream speed and electronics components colored by temperature.
The heat sink/cooling plate assemblage serve to keep the baseplate of the system at 10˚C, serving as an effective heat sink. The isothermal contours of Figures 7-9 indicate that the components witness a maximum temperature of 356.4 K (83.4˚C), thus there is temperature difference of 73.4˚C in this system. Next, a series of parametric studies was completed each of which is discussed in detail below.
5.1. Effect of Thermal Conductivity on Heat Transfer
The primary objective of this current research is to demonstrate the heat spreading characteristics of APG k-core material. Thus, the CFD model described above was exercised by changing the thermal conductivity of the heat sink/cold plate from a very low (bare Aluminum) to a very high value (APG k-core). The results of this parametric study are shown below in Figure 10 which shows the system temperature delta, DT (˚C) plotted as a function of the heat sink/cold plate thermal conductivity k (W/m-K).
By inspecting Figure 10 the spreading effects of APG k-core become immediately obvious. The relationship between thermal conductivity and maximum system temperature delta is expected to be linear via the relationship for heat conduction given by the first law of thermodynamics
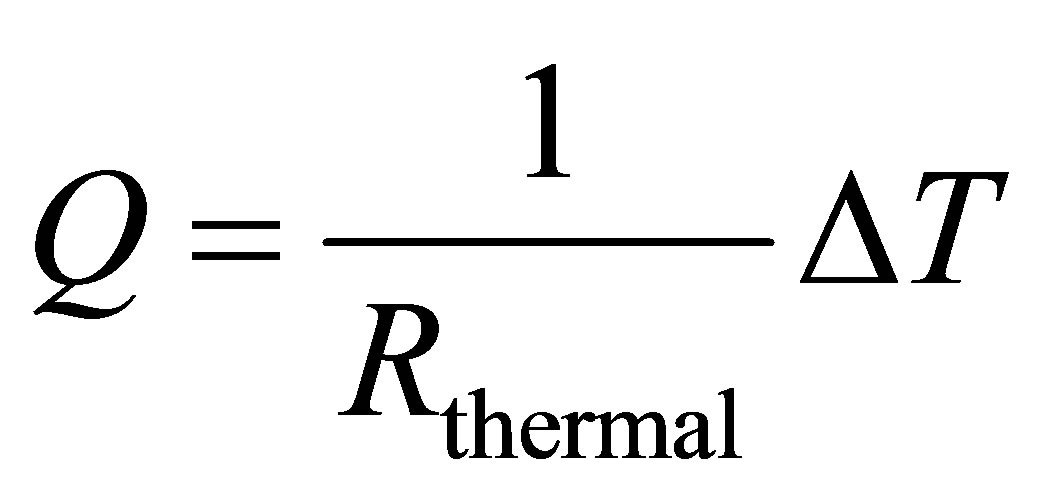 (6)
(6)
where the thermal resistance for conduction and contact interface is given by
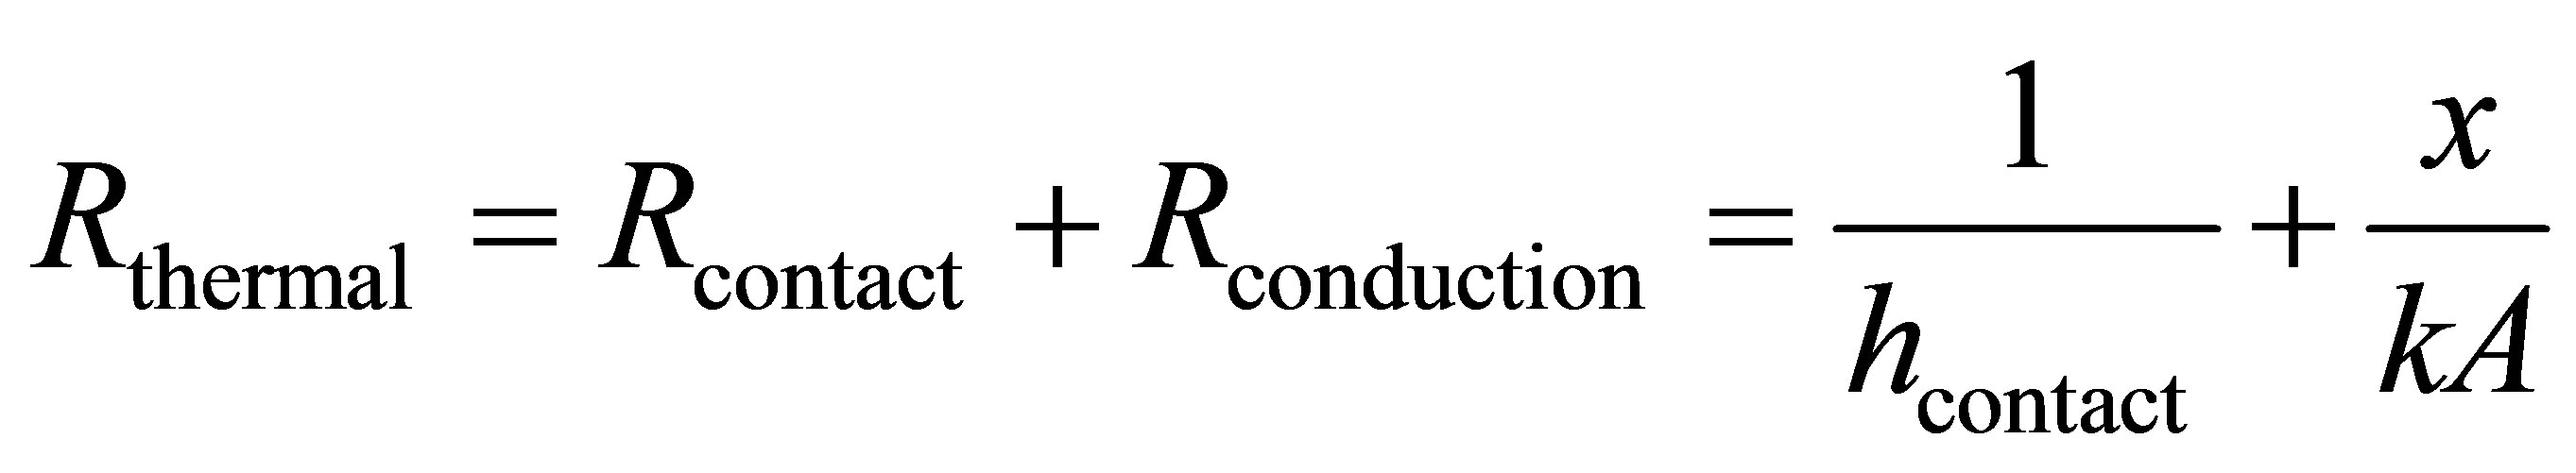 (7)
(7)
The terms are written in series to indicate that the heat must flow from the heat sink via conduction to the cold plate with an intermediate resistance due to contact in between them. For this study we assumed that the contact h-value for the contact conductance was very large, i.e. since the heat sink/cold plate will ultimately be fabricated as one cohesive unit.
5.2. Heat Transfer Coefficient Comparison
One very important piece of information valuable to the electronics cooling community continues to be the elusive film convection heat transfer coefficients. To this end, Figure 11 shows values of convective heat transfer coefficient (W/m2-K) for a typical CFD simulation of our study. From Figure 11, the convective heat transfer values are found to range from 20 < h < 70 W/m2-K for the sub-modules, PCB cards, and component assembly. These values are in agreement with the heat transfer literature [24] for systems of this category.
In order to quantify the effect of inlet fan air speed upon the heat transfer coefficient behavior, a series of
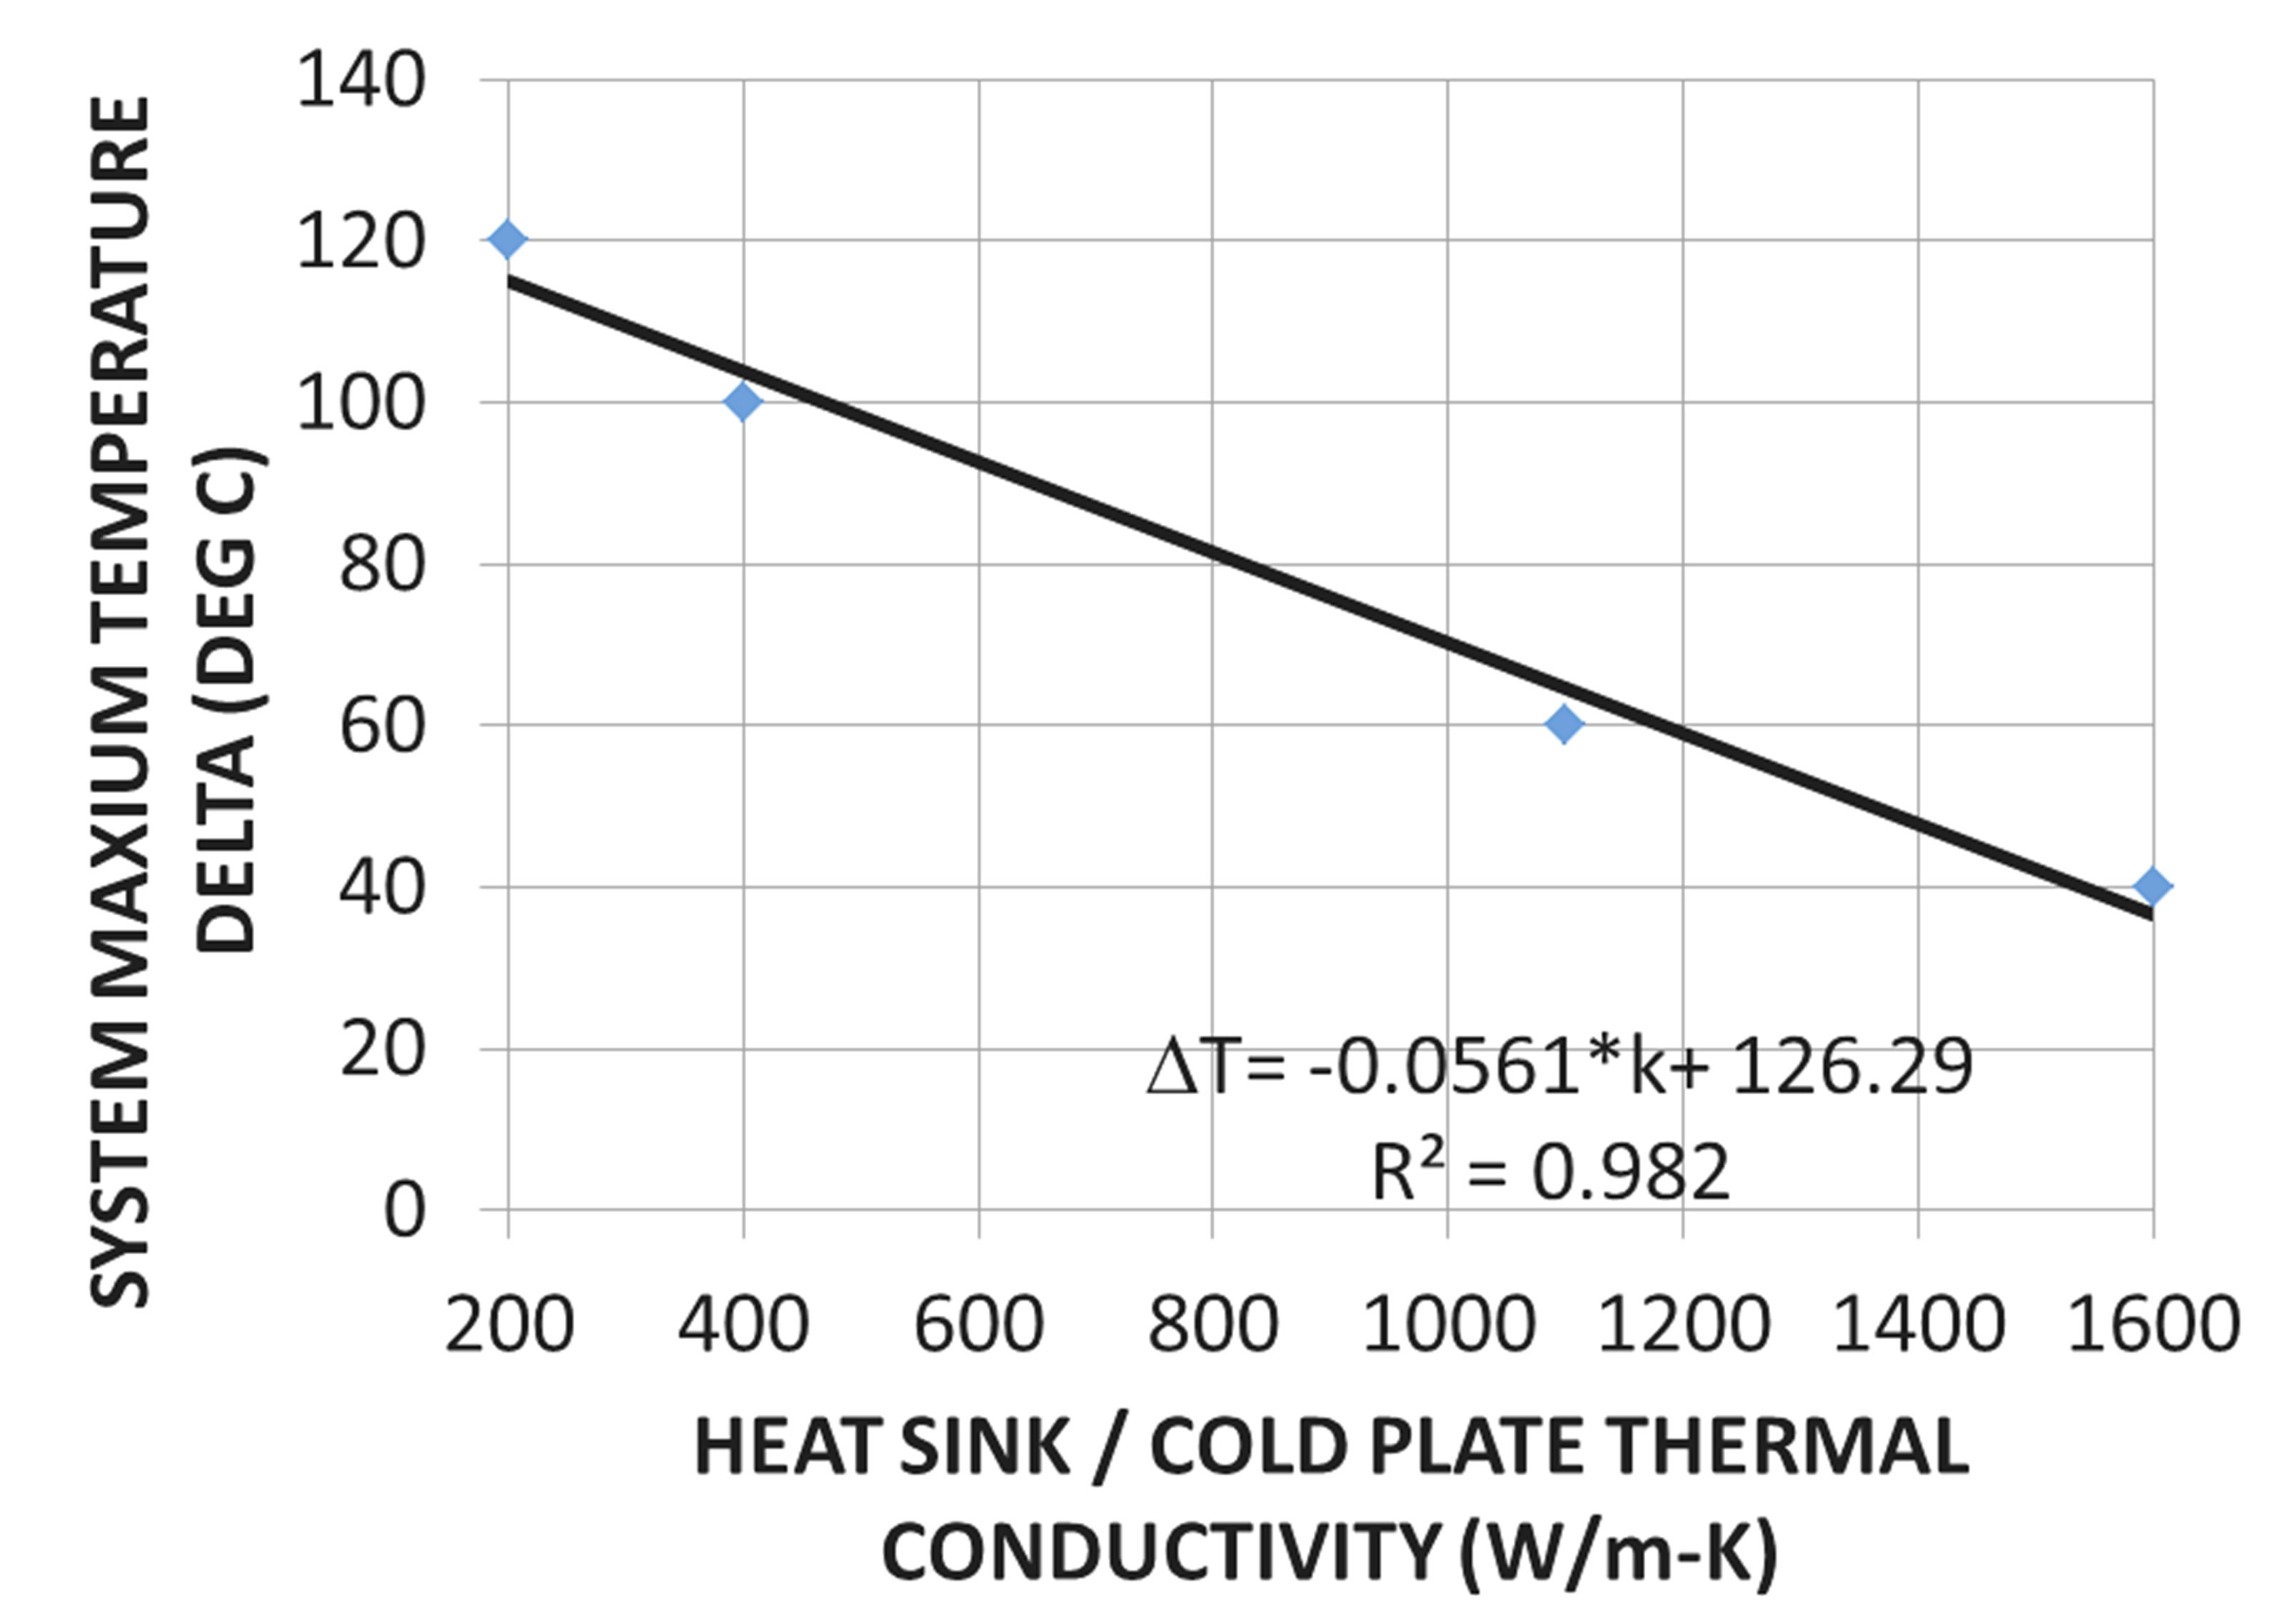
Figure 10. Thermal conductivity effect on heat spreading in CFD simulations.

Figure 11. Convective heat transfer coefficient contours.
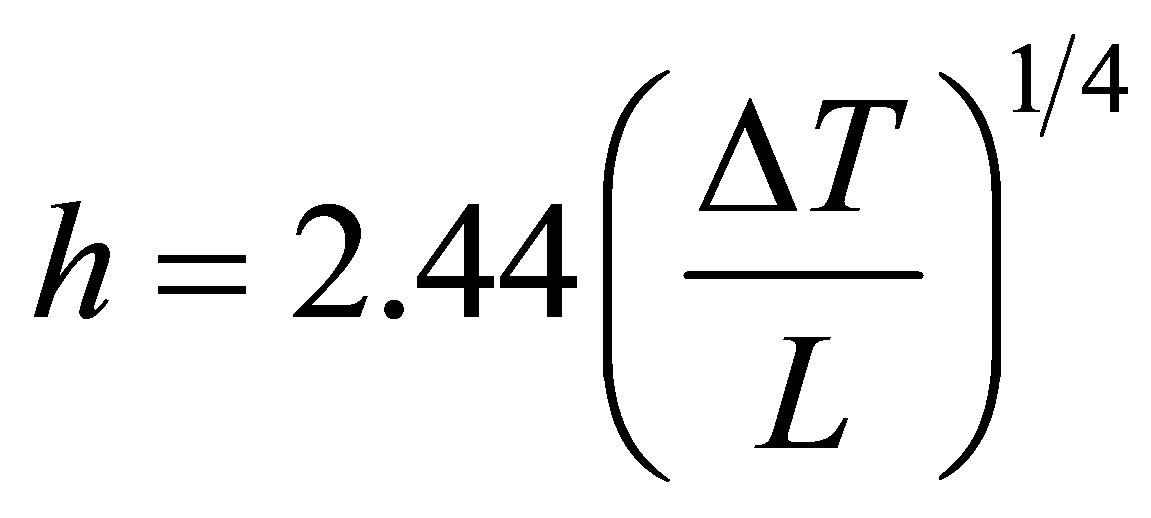
CFD simulation were performed whereby the flow rate of air was varied, thus resulting in a different average velocity emanating from the fan. Figure 12 shows the results of our CFD simulations in comparison with the laminar flat plate Nusselt number based correlation of [25]. The correlation of [25] is based on the Nusselt number for flat plate laminar flow, and is written as
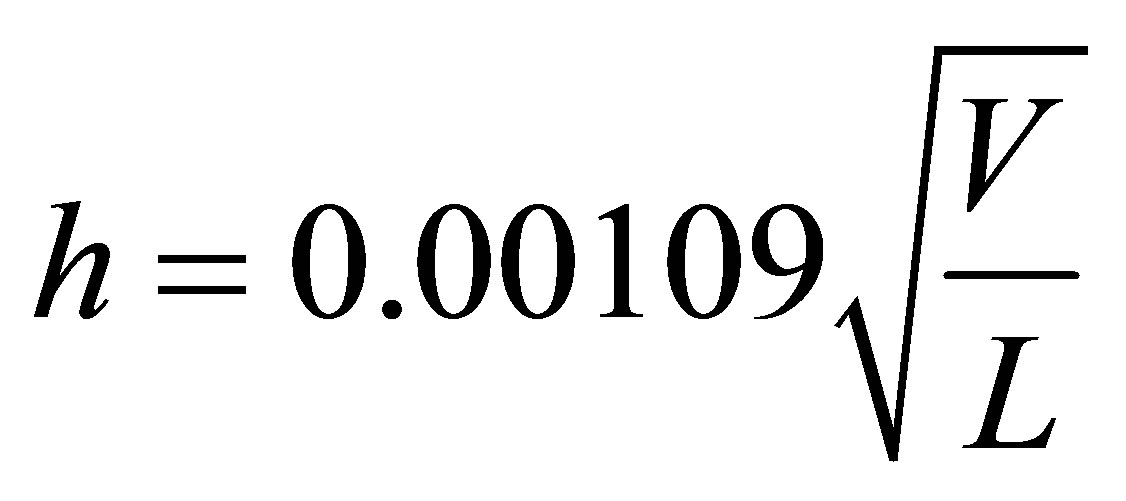 (8)
(8)
with V (ft/min) and L (in). As expected, the handbook correlation of [25] is conservative, i.e. it over predicts the heat transfer coefficient for the range of flow speeds investigated. This is expected, as the uncertainty in a standard textbook based correlation is at least 25% and that the handbook based correlations should not be viewed as sacrosanct [24]. The real mediation to resolve this uncertainty is to perform a system’s level test on actual engineering hardware, and then perform a correlation of the numerical model. The data from our CFD study are found to be in qualitative agreement with the simulations and correlations offered by the research of [11,26], which both present plots of Nusselt number versus Reynolds number (i.e. heat transfer coefficient versus flow speed) for heat sinks in electronics cooling applications.
Next, the heat transfer coefficient of the system is plotted against temperature delta of the system as shown in Figure 13. Figure 10 shows convective heat transfer coefficient h (W/m2-K) versus temperature delta (T-To). The CFD data points are assigned a power-law curve fit and compared to the correlation offered by [23]. The recommended correlation of [23] for electronics cooling is given by
 (9)
(9)
As shown in Figure 13, the hand-book correlation of Equation (9) is found to over-predict the heat transfer coefficient in the range of system temperature differences studied. At this point it should be reiterated that according to [24], the heat transfer correlations given by Equation (8) and Equation (9) are expected to carry an uncertainty of at least 25%. Clearly, the agreement of our current CFD results in Figures 12 and 13 are within the realm of this uncertainty range.
5.3. Effect of Cold Plate Coolant Flow Rate
Next we investigate the effects of cold plate coolant flow rate on the system thermal performance. A series of CFD simulations were carried out varying the inlet flow rate of the water in the cold plate from 0.1 kg/sec to 0.2 kg/sec (1.6 gpm to 3.2 gpm for water with r = 1000 kg/m3). The results are shown in Figure 14 where the heat transfer coefficient of the system is plotted as a function of the flow rate in the cold plate.
It should be clarified here that the influence of convective heat transfer coefficient of the entire system, as shown in Figures 7-9, i.e. components and PC boards is plotted in Figure 14, rather than the internal heat transfer coefficient of the tubes comprising the cold plate. As can be seen in Figure 15 the heat exchanger/cold plate assembly maintains a relatively constant temperature displaying only a 5˚C overall spatial gradient. This is primary advantage of utilizing a pumped fluid system cold plate apparatus, i.e. it gives one the ability to hold a somewhat isothermal boundary condition in an actual thermal system.
5.4. Effect of Contact Resistance
The next segment of our investigation deals with simulation of the thermal gasketing material comprising the contact conductance interface between the various components in the system. Typical thermal gasket materials used extensively in the commercial electronics cooling industry include Chotherm [26], Thermal Grease [27]
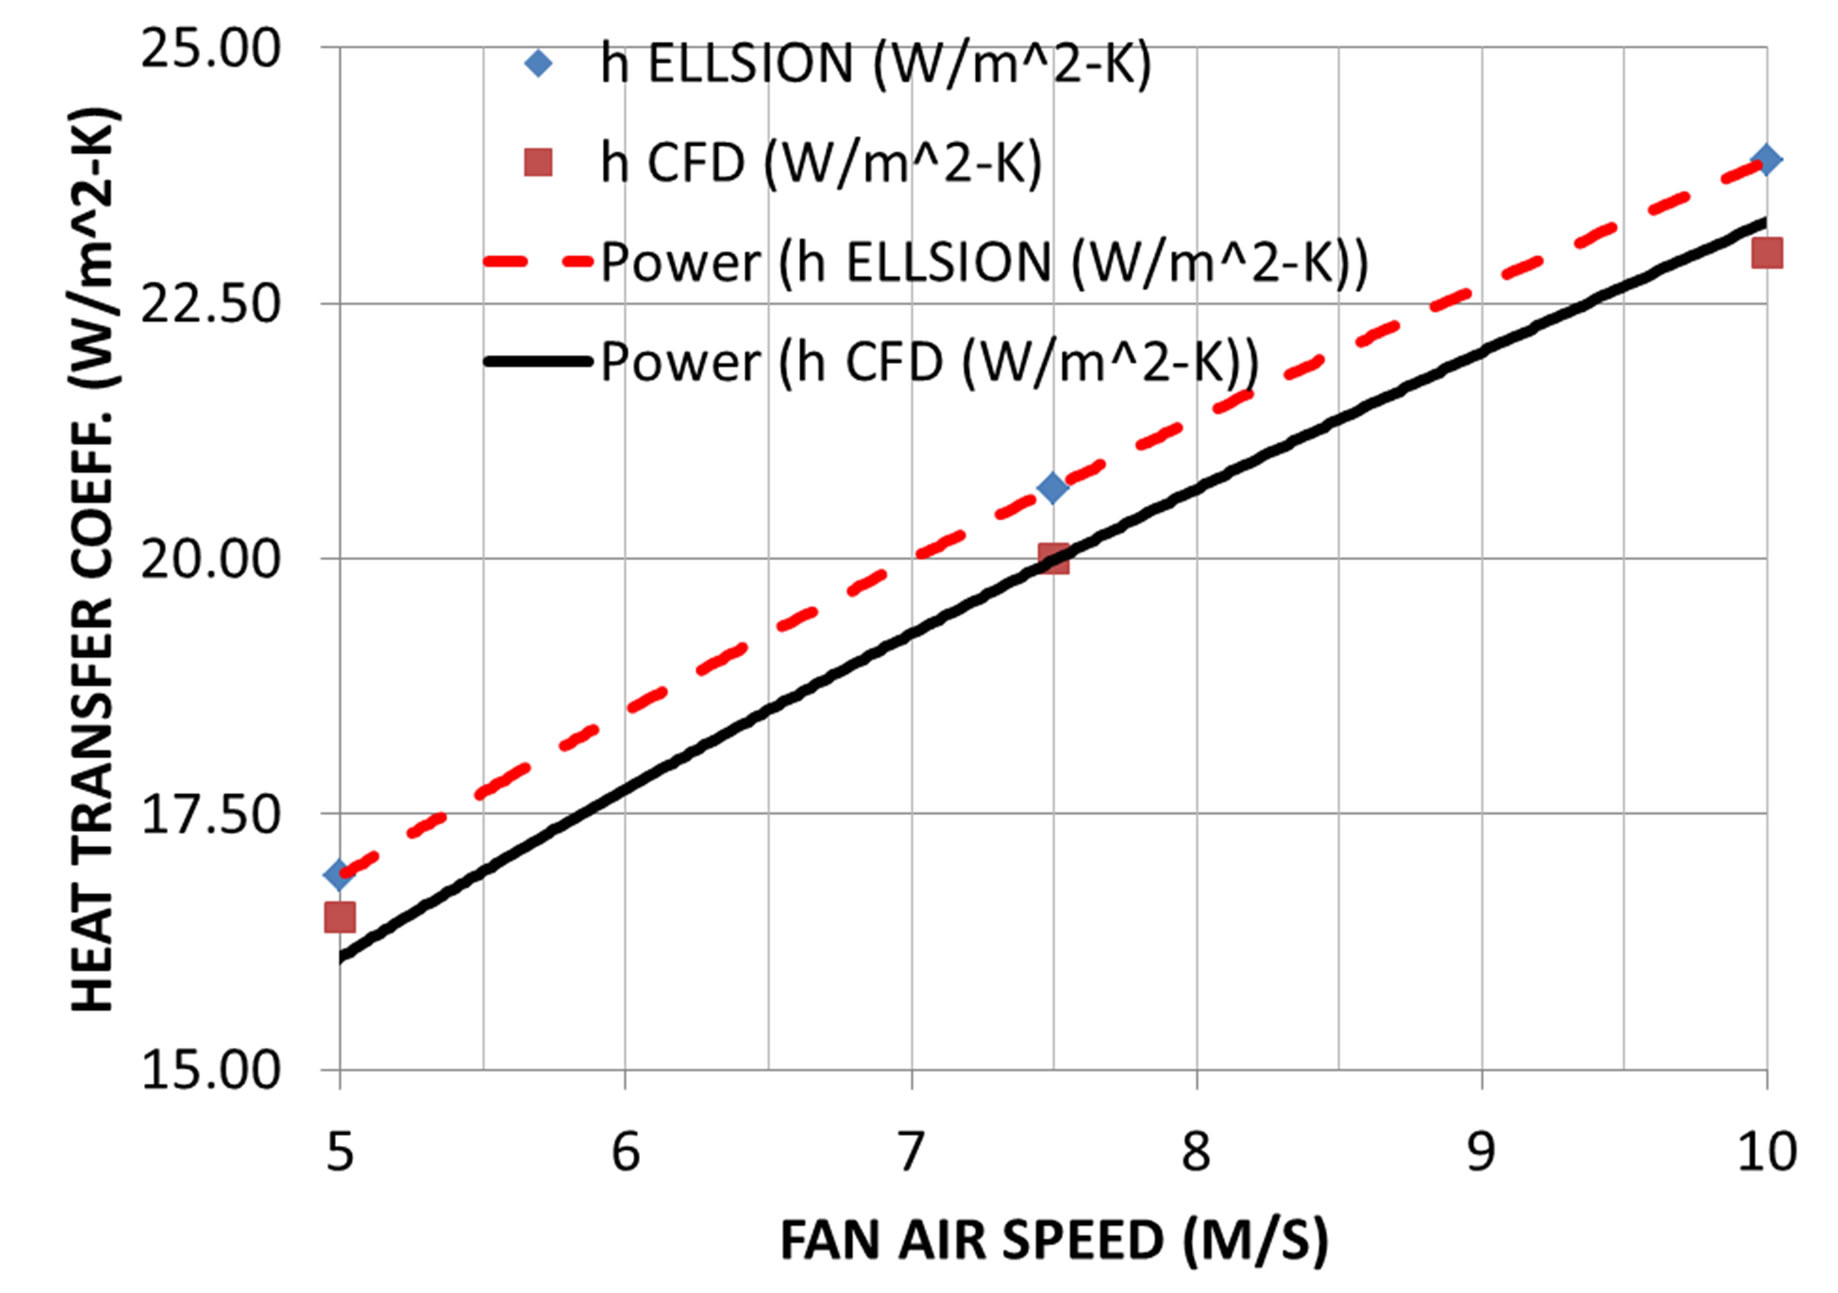
Figure 12. Heat transfer coefficient versus fan air speed.

Figure 13. Heat transfer coefficient comparison.
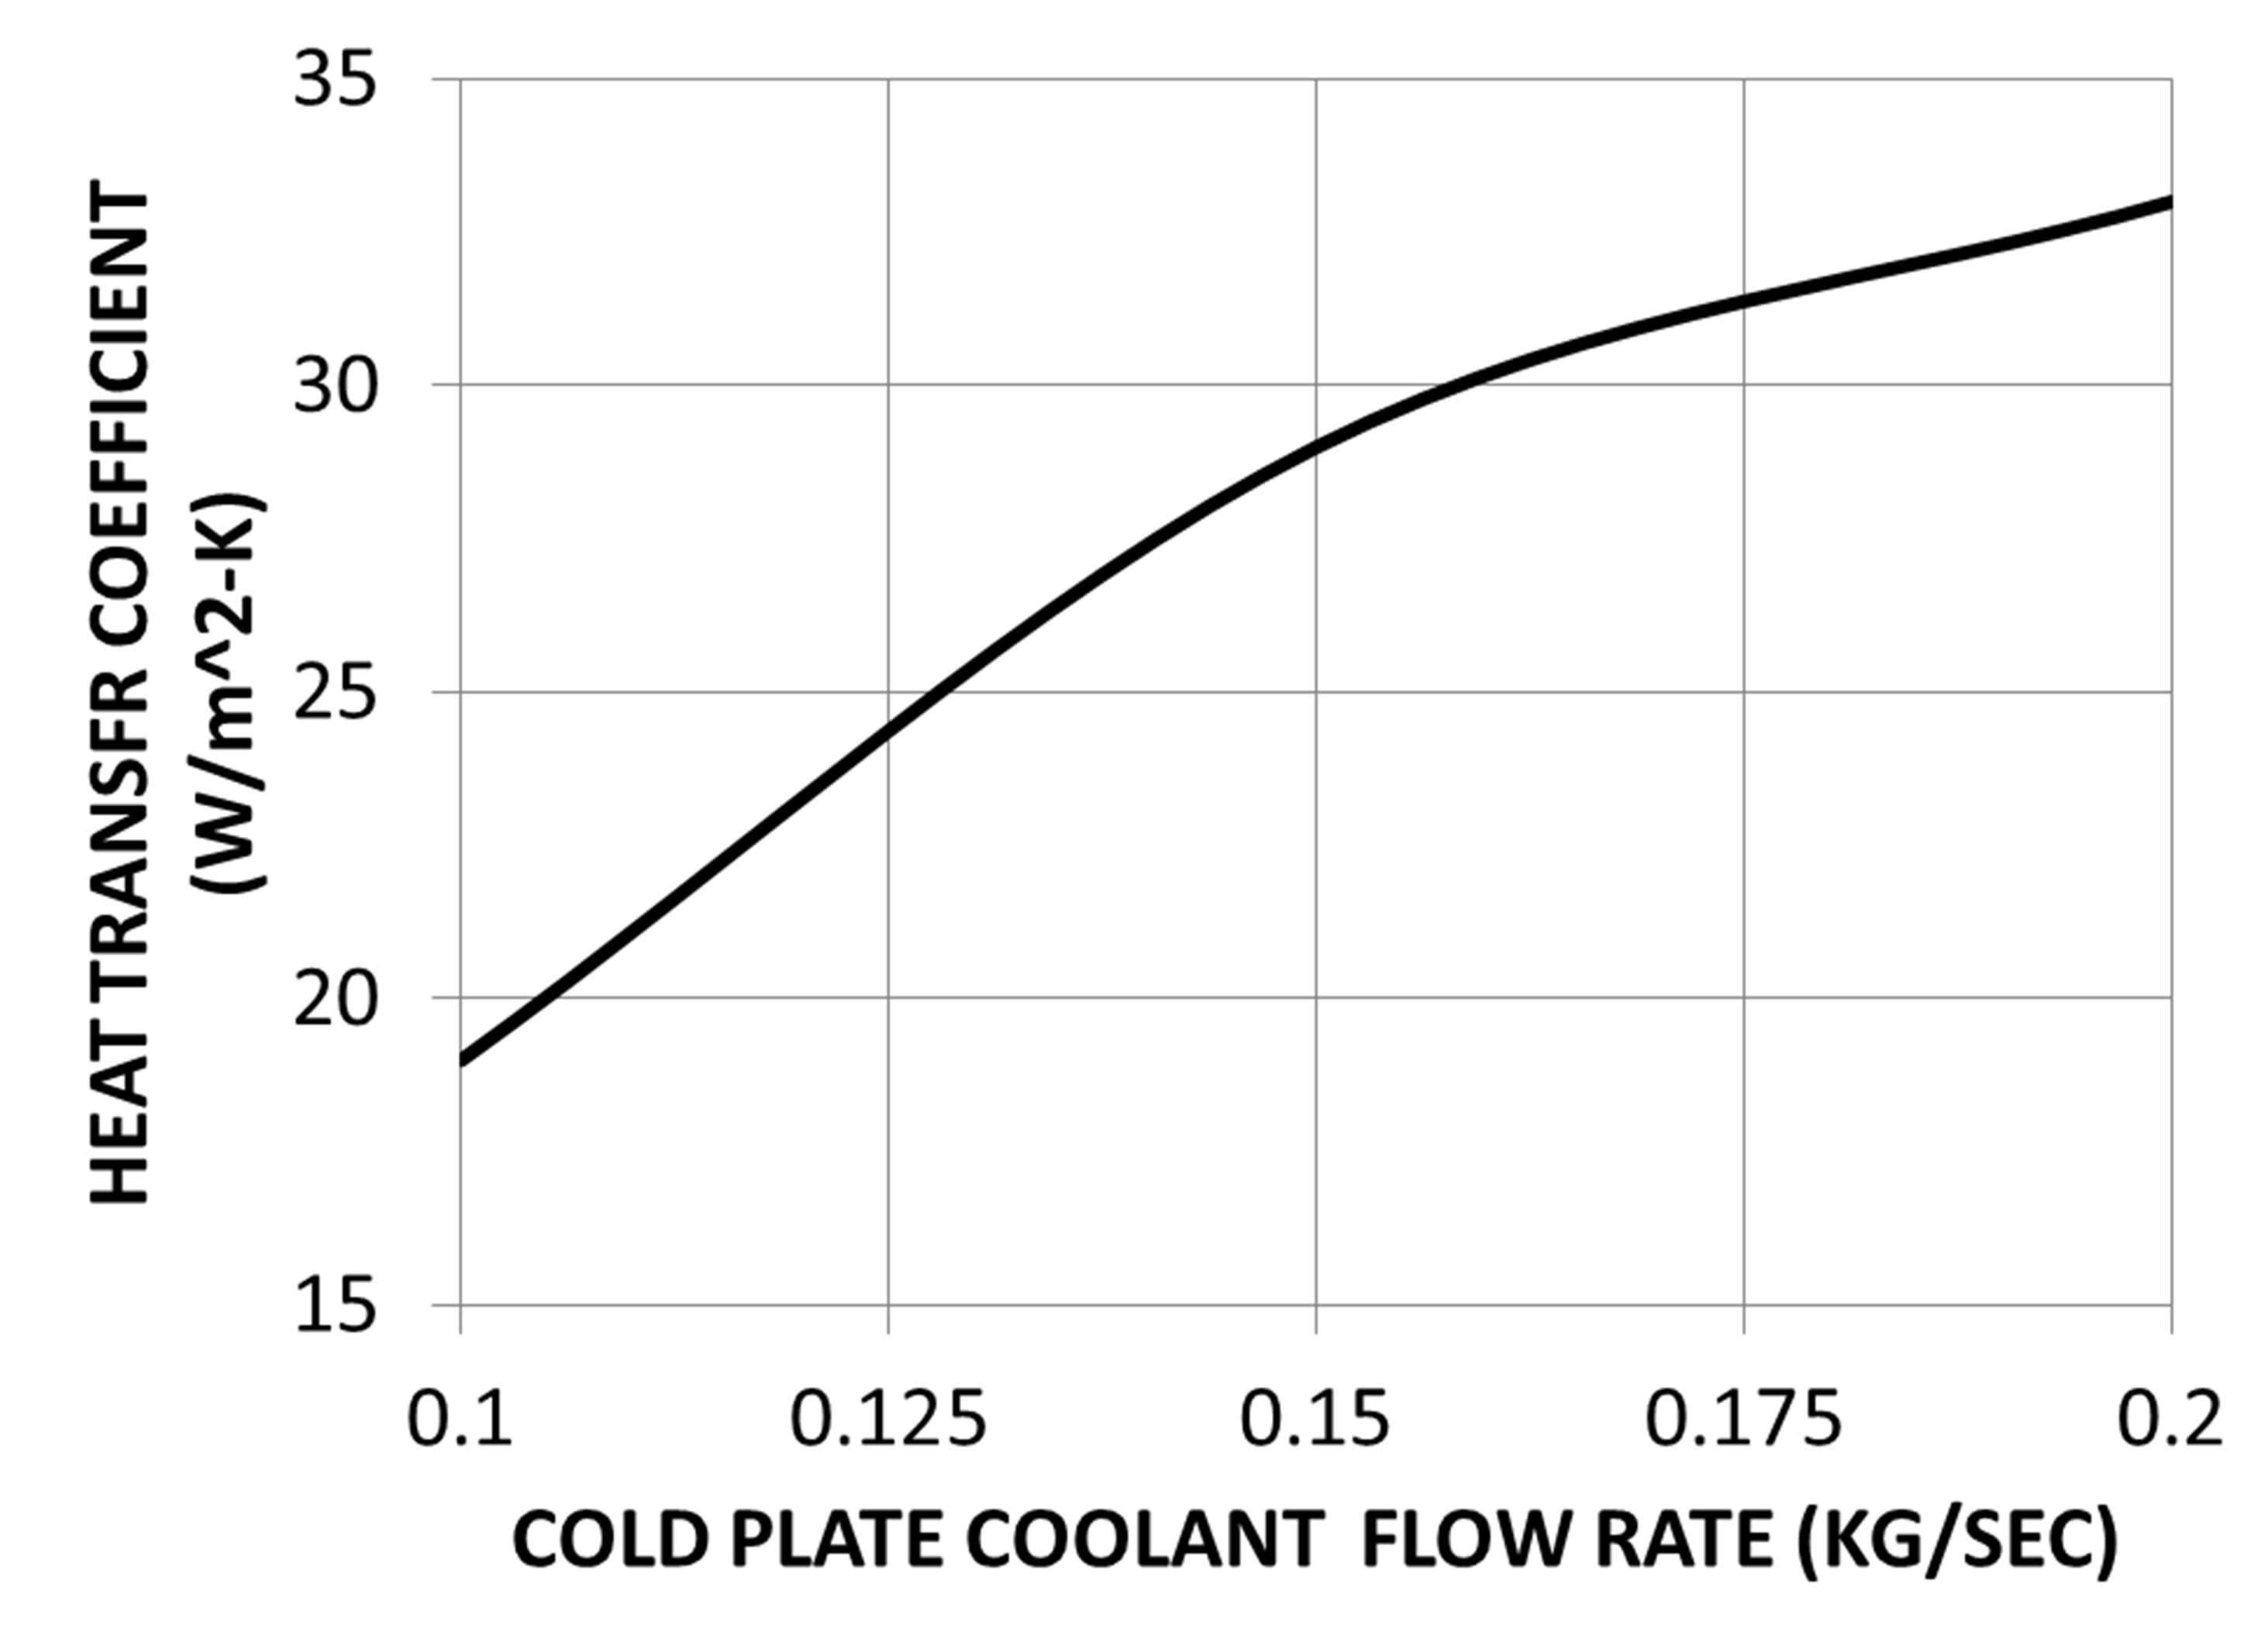
Figure 14. Heat Transfer coefficient versus cold plate flow rate.
and Grafoil [28]. These materials have advertised nominal contact heat transfer coefficients of 5000 W/m2-K for Chotherm, 50,000 W/m2-K for Grafoil, and 10,000 W/m2-K. In practice it is best to apply an area void fraction of at least 50% to these nominal values in order to account for that fact that uniform pressure is not available between the two interfaces being mounted together. This puts a more conservative bounds of the values or thermal contact resistance for these materials as follows, R = 4 × 10⁻⁴ K-m2/W for Chotherm, R = 4 × 10⁻⁵ K-m2/W for Grafoil, and R = 2 × 10⁻⁴ K-m2/W for Thermal Grease. Using these values as guidance, CFD simulations were performed on the system level model, whereby all of the interfaces were set to have a contact interference with the values of contact resistance in the range 4 × 10⁻⁴ < R < 2 × 10⁻³ K-m2/W (2500 < h < 500 W/m2-K) thus emulating a “very good” thermal interface to a “very poor” thermal interface. These results are shown in Figure 16 which plots maximum temperature in the system versus thermal contact resistance.
As expected the trend of Figure 16 is linear, since the thermal contact resistance is embedded in the conduction heat transfer model of Equation (7) as previously discussed. Figure 17 shows isothermal contours for a submodule which has a very poor thermal contact interface, i.e. R =  K-m2/K.
Figure 17 shows the range of temperatures, from smallest of 286 K (13˚C) where the PCB card is in contact with the heat sink/cold plate assembly, to a largest value of 350 K (77˚C) where the warmest component on the PCB is at the extremity of the PCB card near the air flow region. Here, the impact of a poor thermal contact interface is profound, leading to a 64˚C temperature spatial thermal gradient across this particular sub-model.
5.5. Thermal Runaway Due to Faulty Components
Thermal runaway due to faulty components in the system are readily simulated using a turn-key CFD model of the sort presented in this paper. Figure 18 shows the effect of simulation of a bad component due to an internal manufacturing flaw(s), an internal short, etc. on a particular PC board. The component experiencing thermal runaway is immediately identified as the outlier in Figure 18, with a case temperature of 580 K (307˚C) while the interface of the sub-modules with the heat sink is 290 K (17˚C), thus a delta of 290˚C is manifested by this single component failure simulation.
5.6. Fan Outage Simulations
One very common lead to failure in large data racks and thermally controlled avionics electronics systems is fan failure. This leads to the thermal designer having to carry a redundant system, i.e. back-up fans, in case the primary fan cooling system experiences failure due to power drop
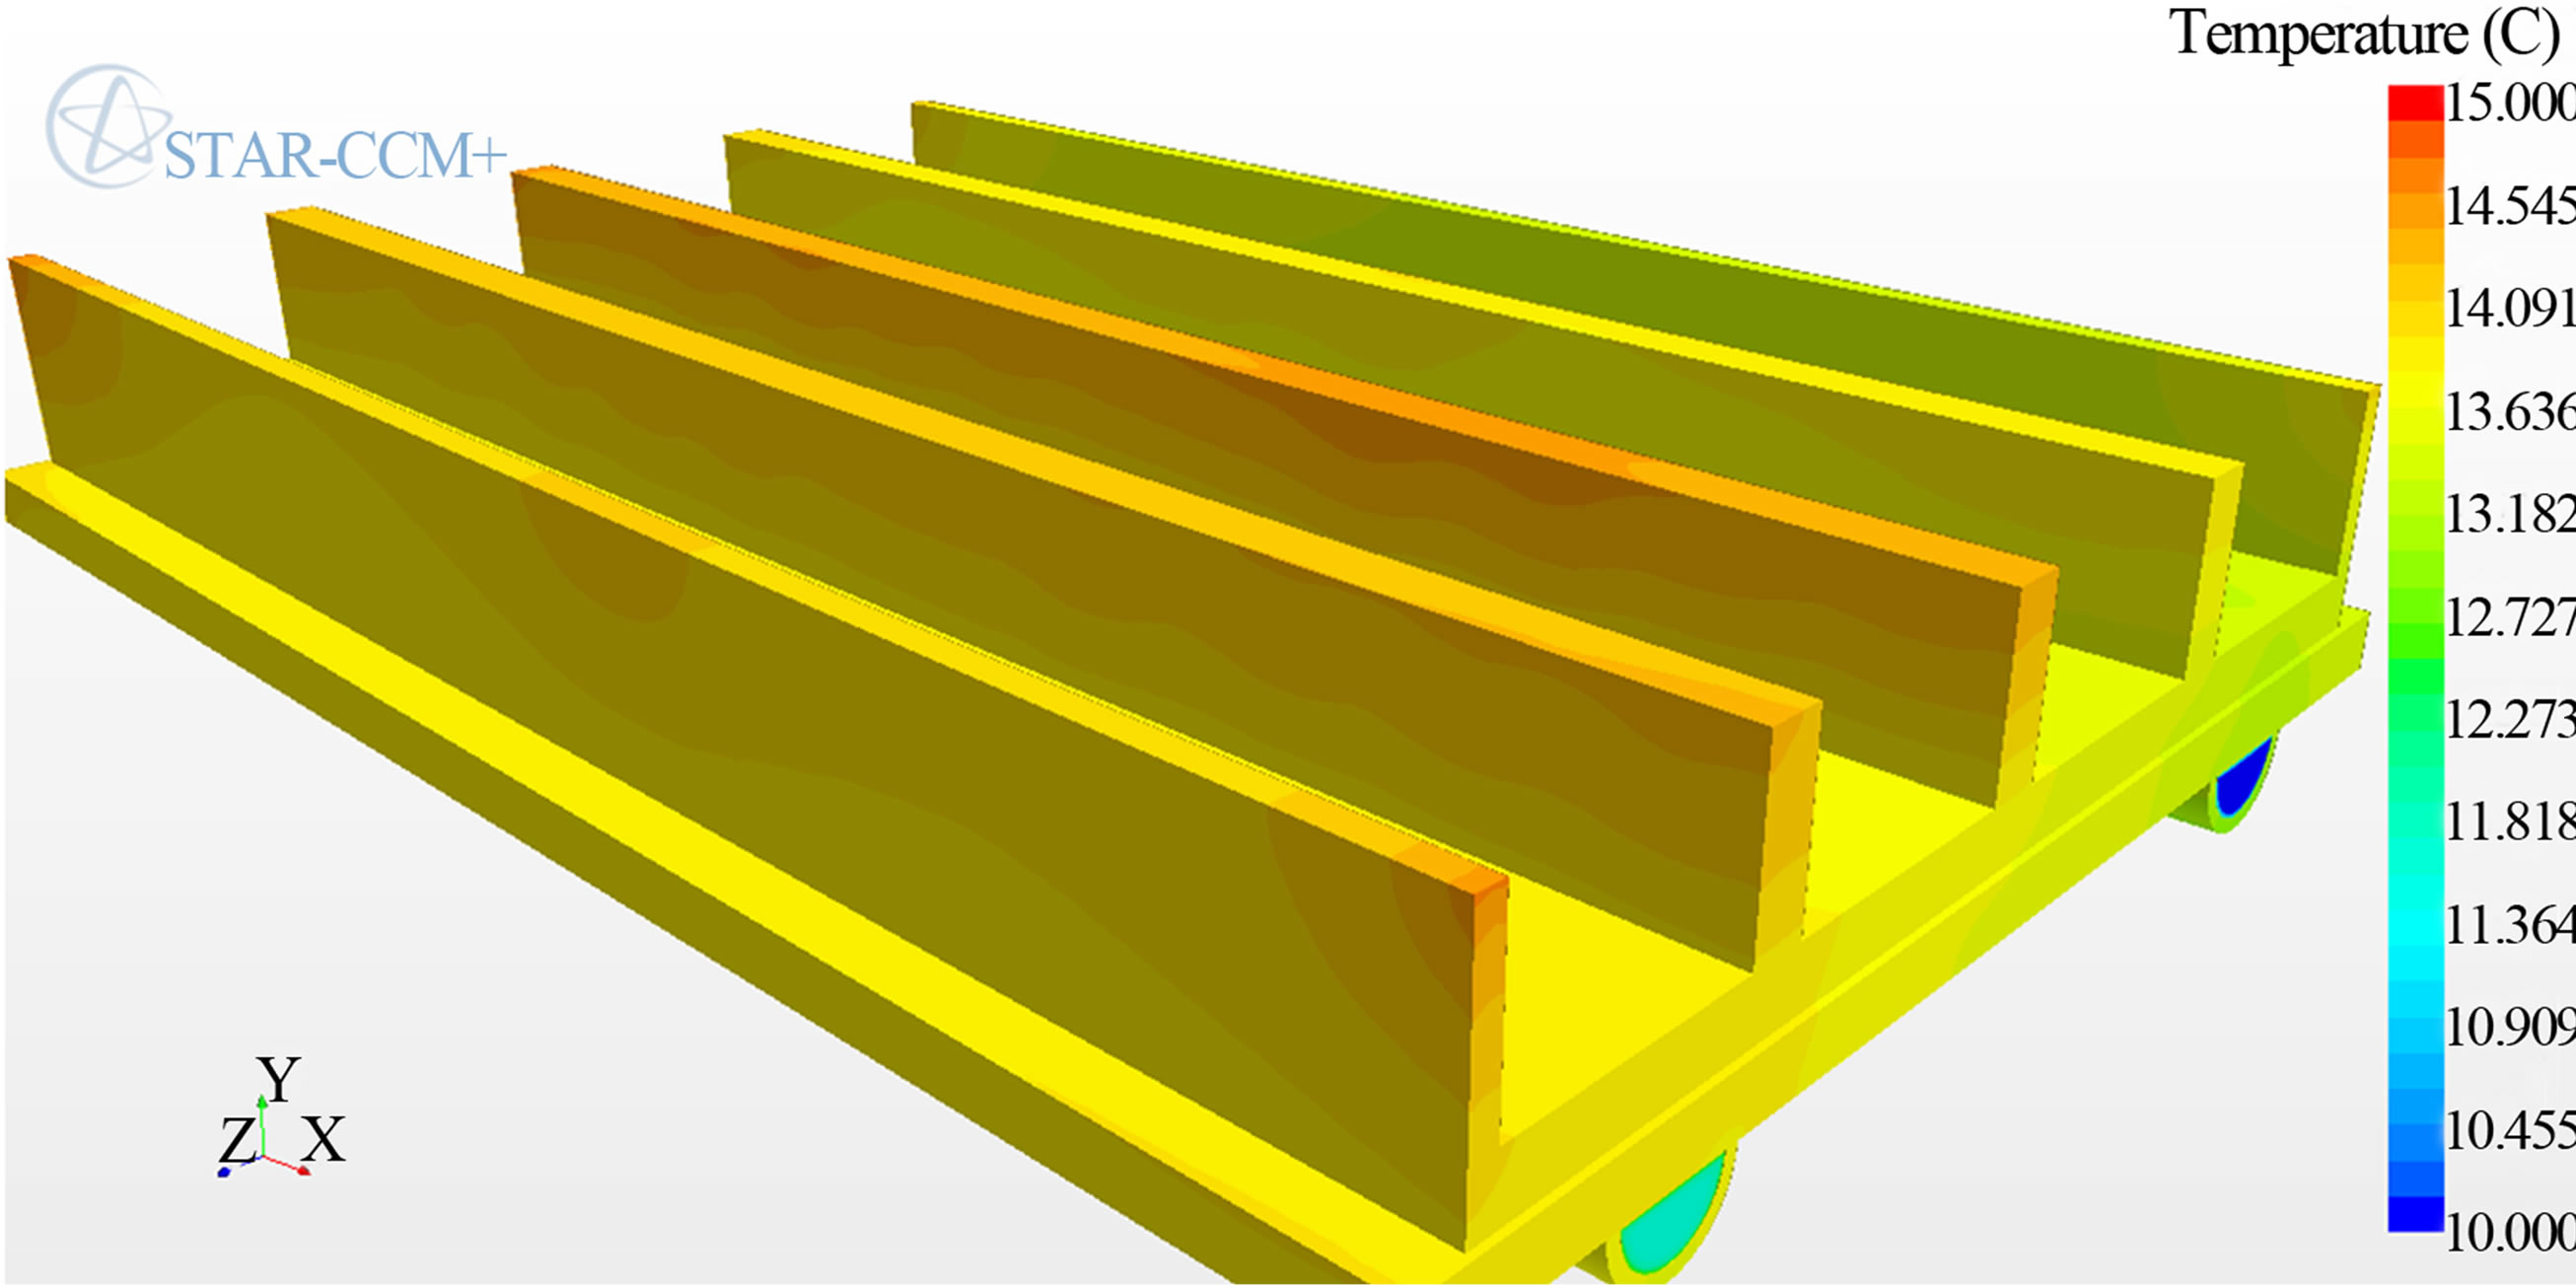
Figure 15. Heat sink/cold plate temperatures.
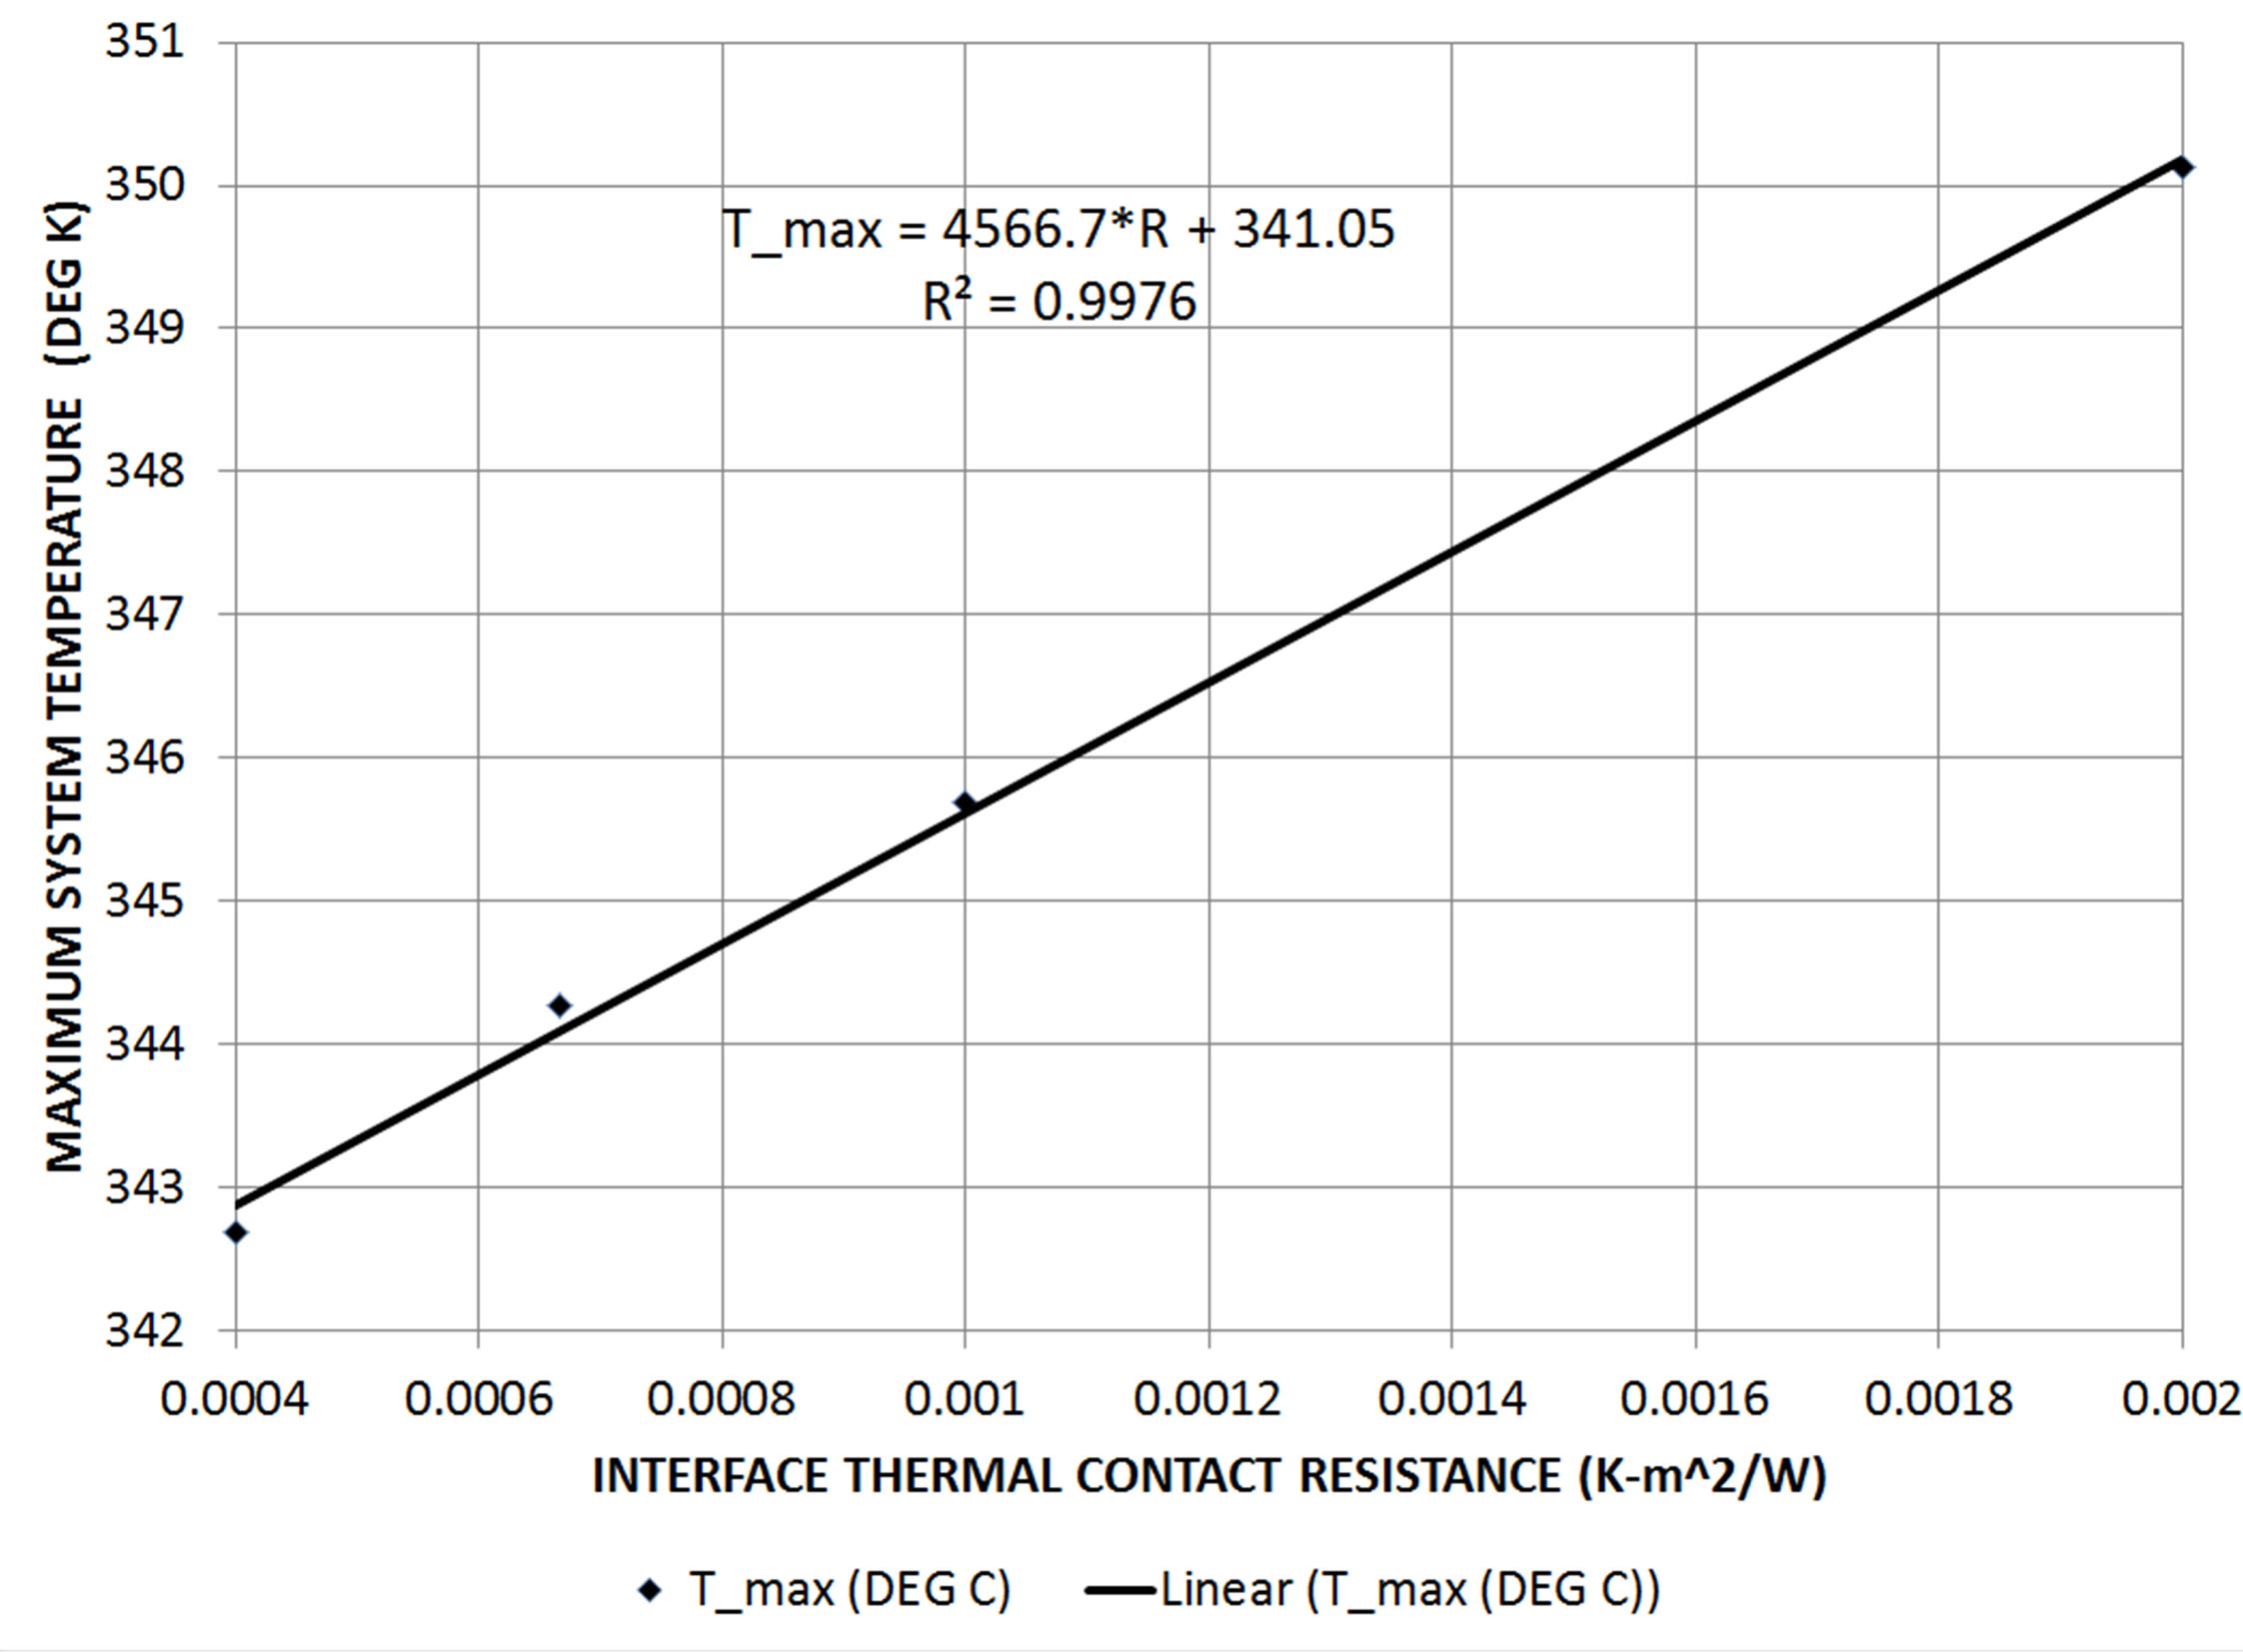
Figure 16. Thermal fault simulation showing effect of contact resistance.
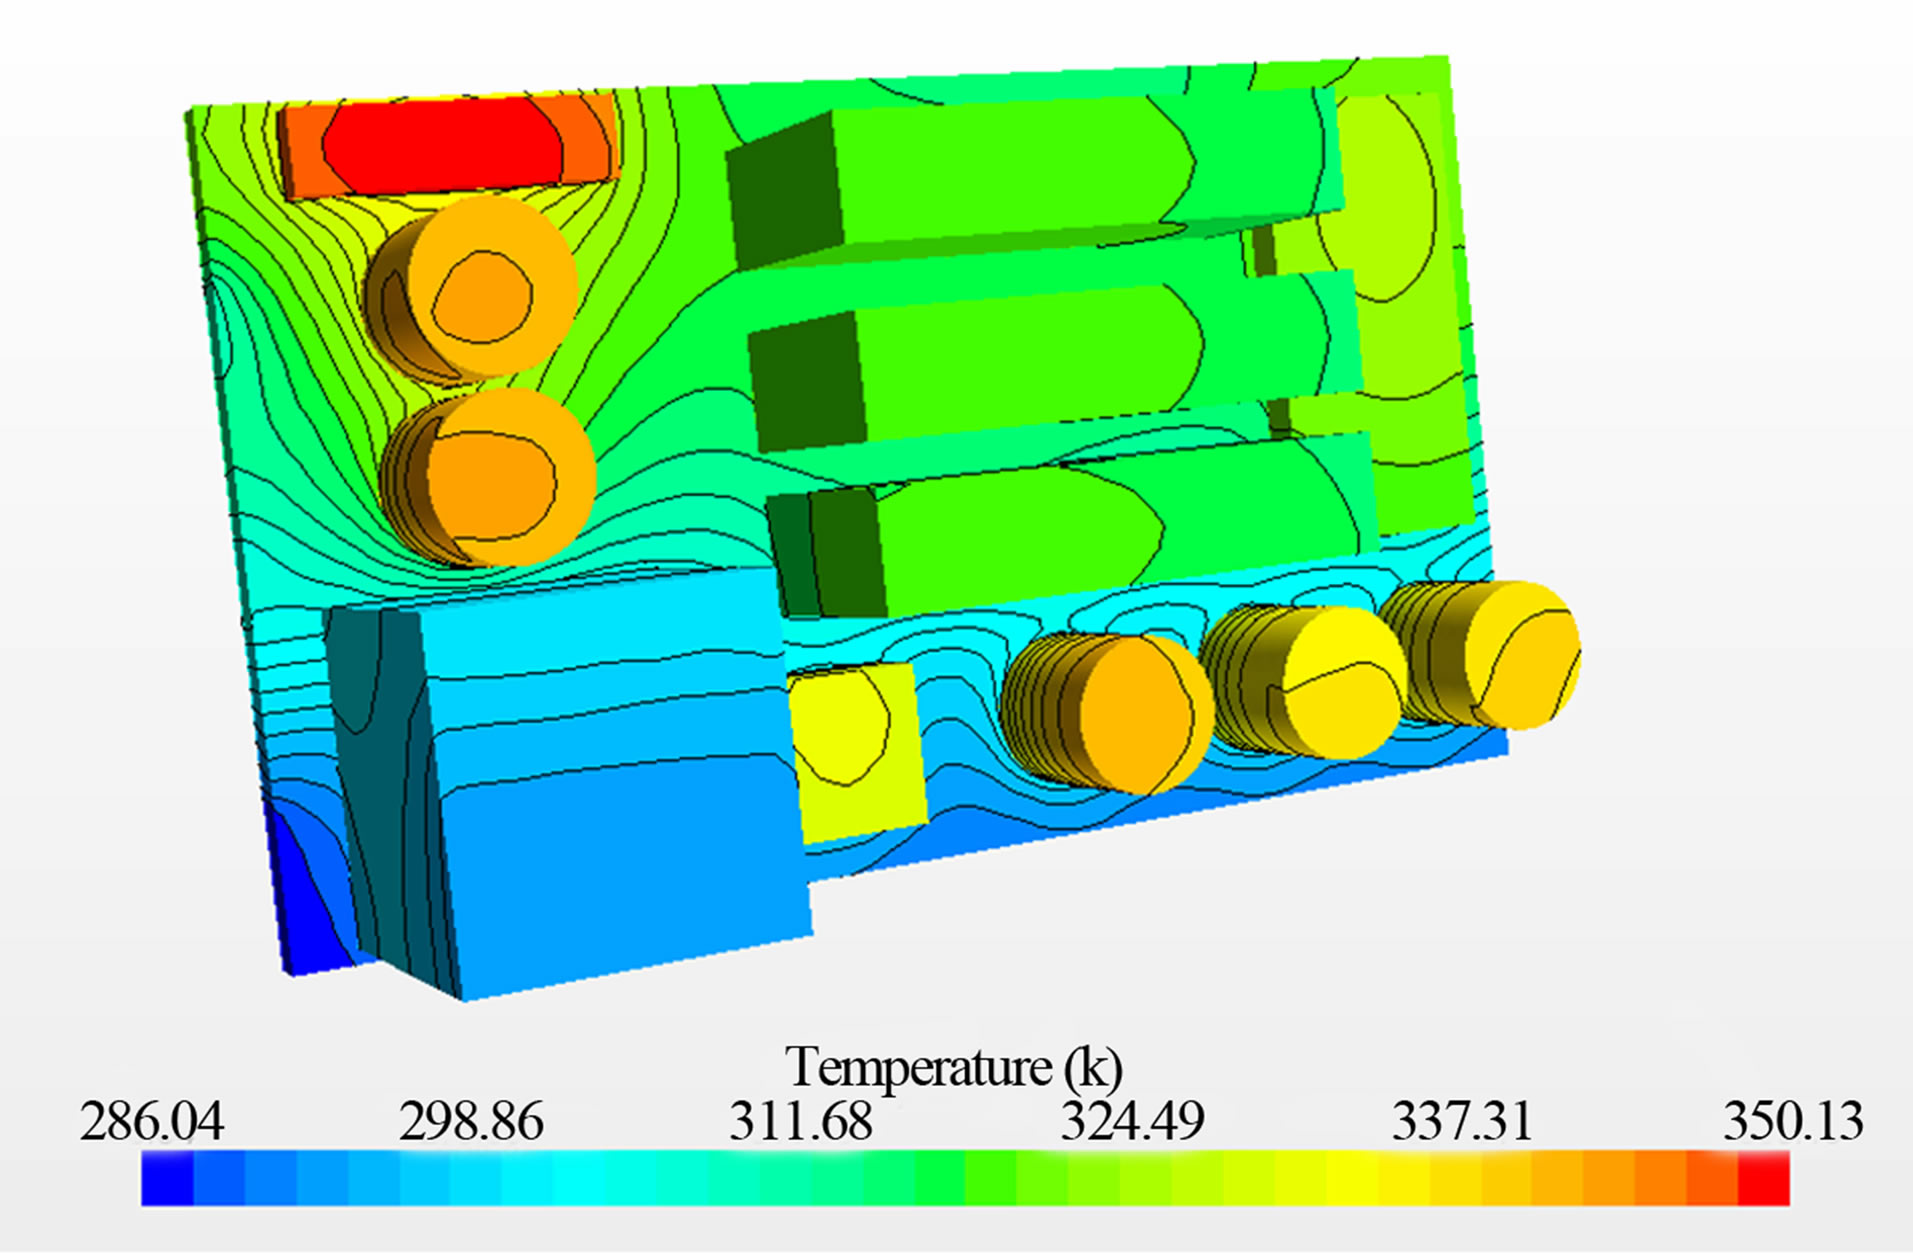
Figure 17. Effect of poor thermal contact resistance.
out and/or fan motor burn-out. In order to understand the effects of fan failure, various CFD simulations were performed in by varying the air flow around a nominal value of 6 m/s (for a 80 mm dia. fan rated at 60 cfm). Figure 19 shows the results of the fan failure parametric trade
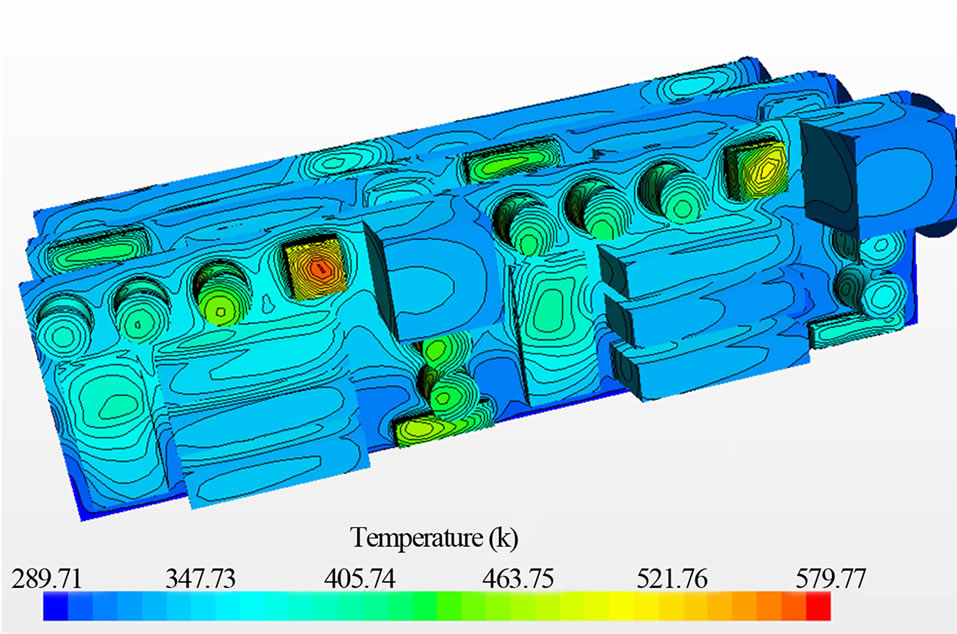
Figure 18. Thermal fault simulation of defective chip.
study. Figure 19 is a plot of the system level maximum component/chip temperature versus fan air speed.
The trend depicted in Figure 19 is to be expected, i.e. as the fan speed approaches zero, the various components and PC cards within the sub-modules will witness a large
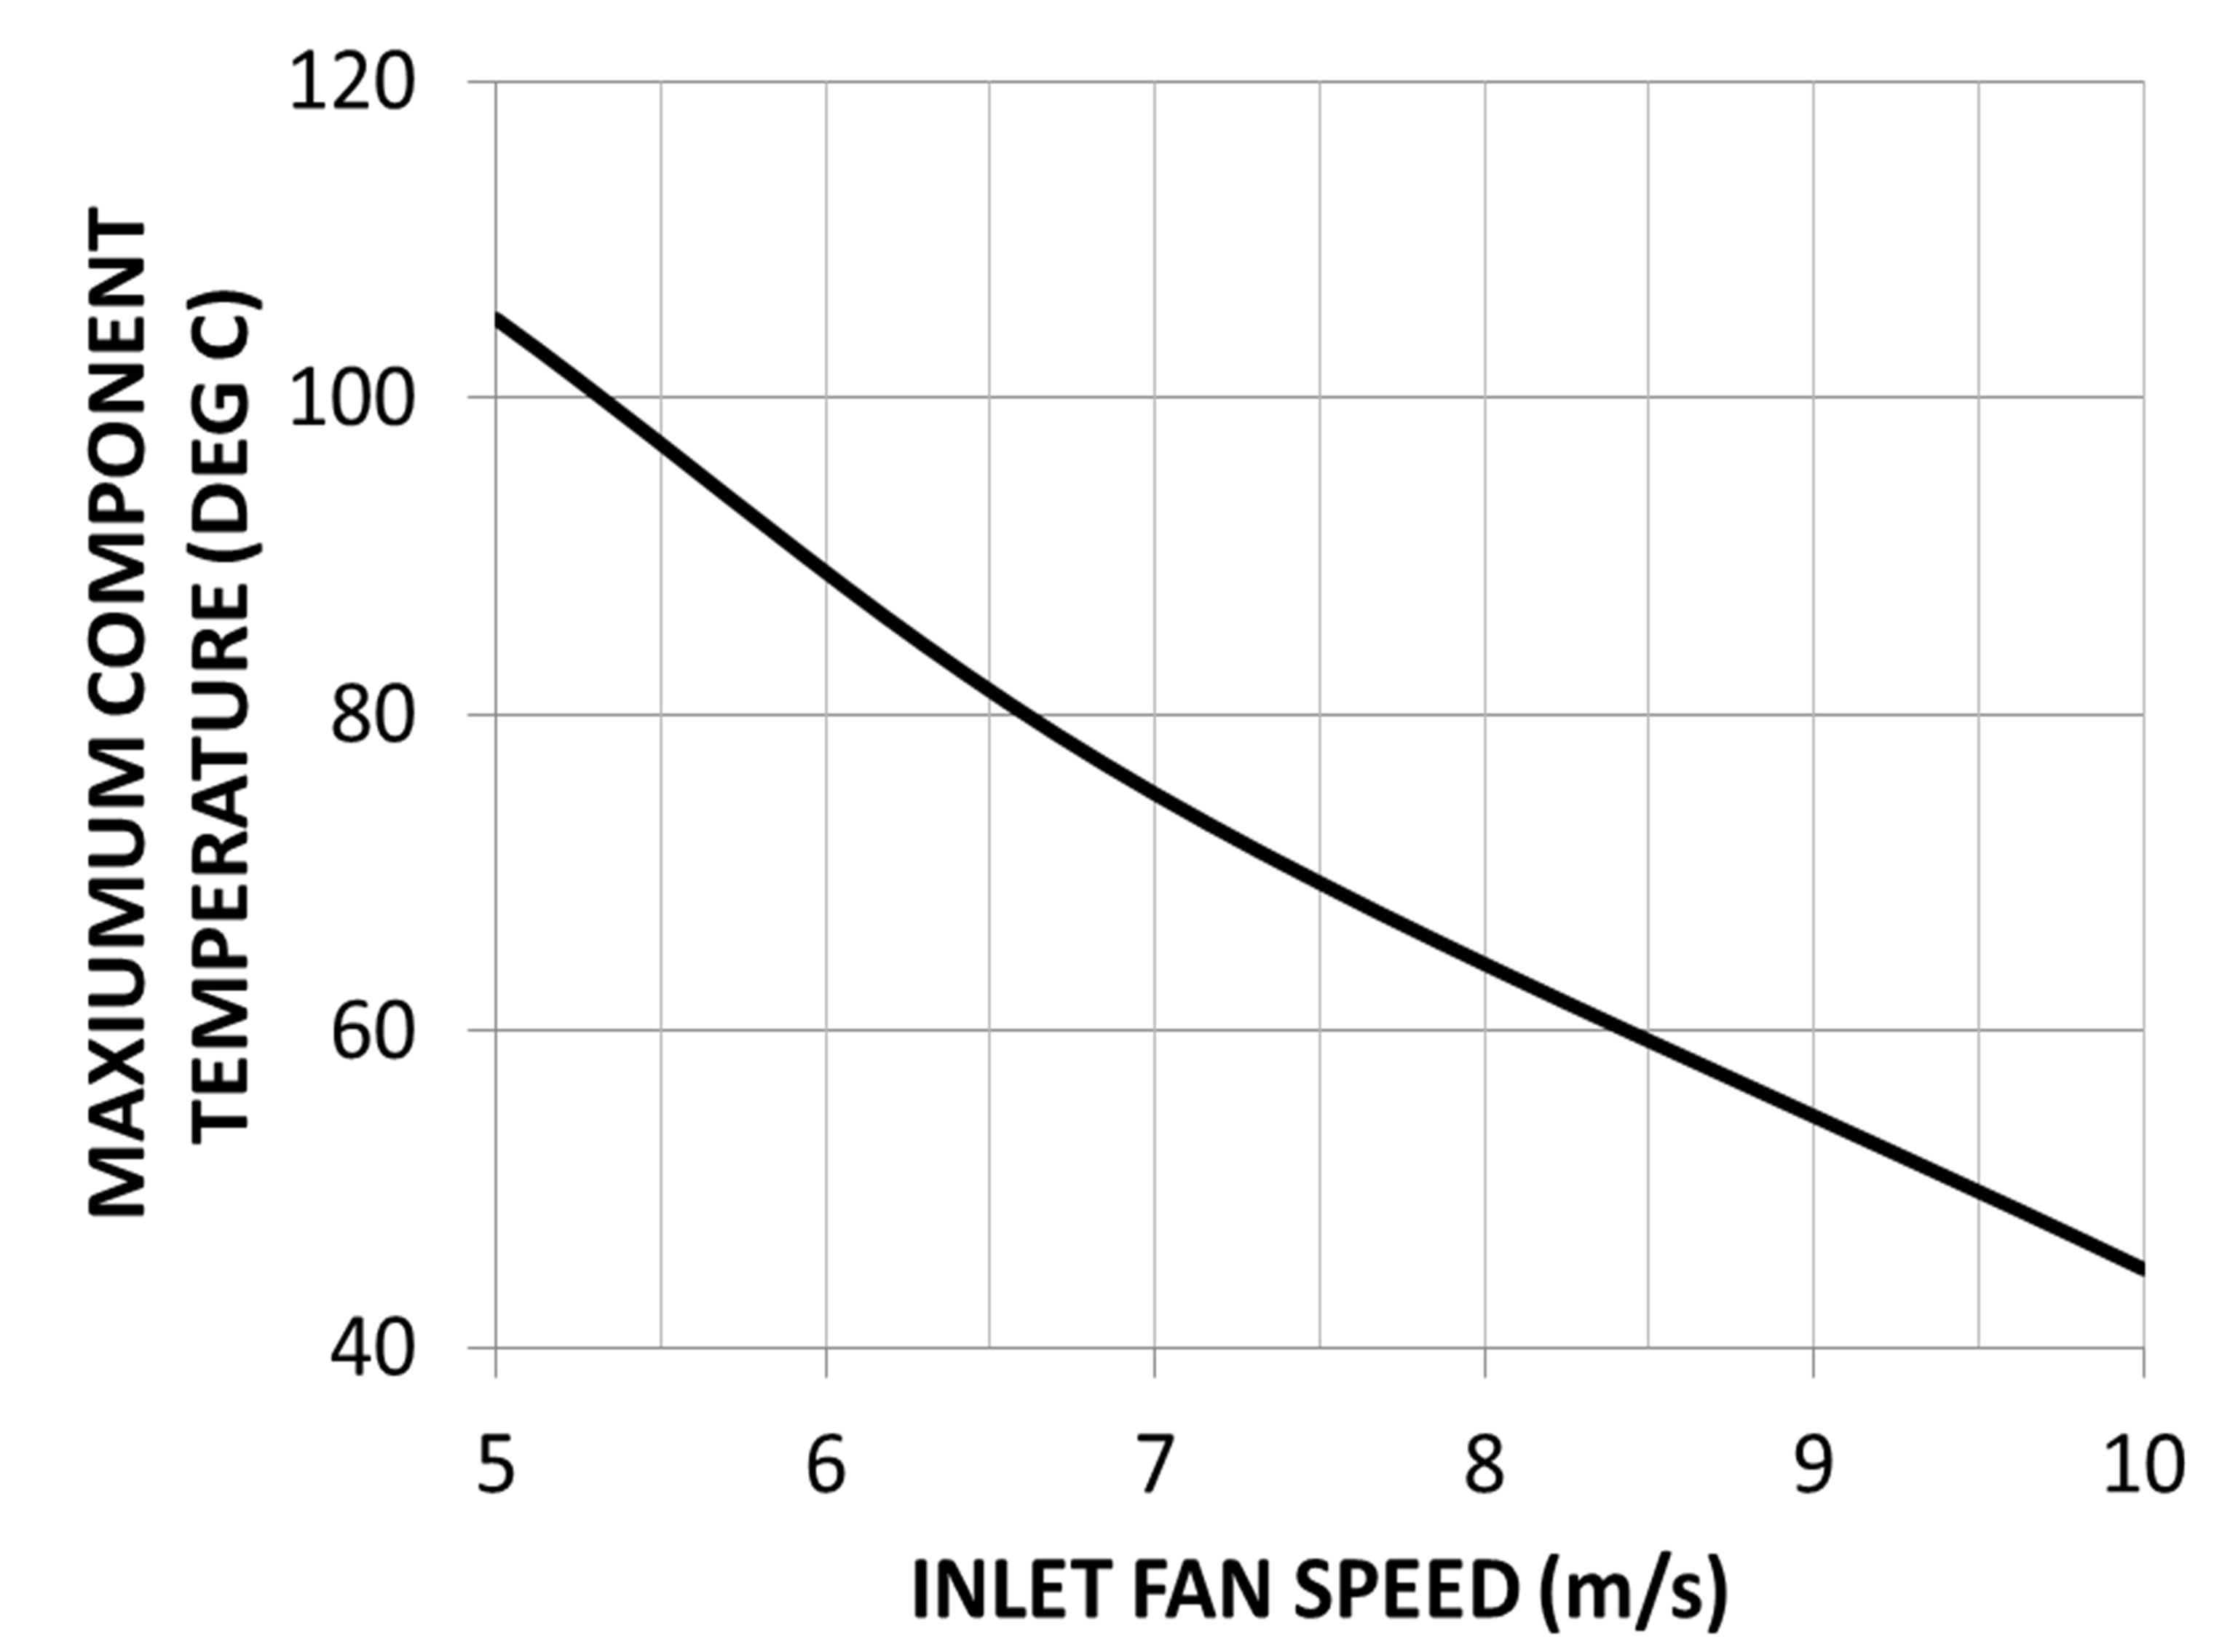
Figure 19. Maximum component/chip temperature versus cooling fan inlet air speed.
temperature. The results of Figure 19 are in agreement with the trends of thermal impedance ΔT/Q versus Reynolds number identified in the study of [29] which focused on the free stream cooling heat transfer cooling of micro-processor chips.
6. Conclusion
This paper has presented CFD simulations of heat and fluid flow behavior in a moderate sized package of electronics undergoing very large power dissipations on the order of 1000 W/m2. A combination of heat transfer enhancement thermal control strategies (high thermal conductivity materials, forced convection cooling using DC computer fans, and internal forced convection heat transfer using a pumped fluid loop cold plate/heat exchanger system) have been combined in order to simulate the effectiveness of implementing COTS components to realize a thermal control solution. The results obtained herein are in qualitative agreement with previous studies involving electronics cooling simulations [7,9,13,16]. Parametric exercises involving air flow rate, water flow rate, thermal interface material, defective electronic components, and failed fans have been carried out.
REFERENCES
- “Thermacore k-Core Data Sheet,” 2013. http://www.thermacore.com/products/kcore.aspx
- D. D. L. Chung and Y. Takizawa, “Performance of Isotropic and Anisotropic Heat Spreaders,” Journal of Electronic Materials, Vol. 41, No. 9, 2012, pp. 2580-2587.
- Y. S. Yoon, H. Yang and H. Y. Kwak, “Enhancement of the Critical Heat Flux by Using Heat Spreader,” KSME International Journal, Vol. 17, No. 7, 2003, pp. 1063- 1072.
- K. J. Gray, “Effective Thermal Conductivity of a Diamond Coated Heat Spreader,” Diamond and Related Materials, Vol. 9, No. 2, 2000, pp. 201-204.
- P. Mohan, and P. Govindarajan, “Thermal Analysis of CPU with CCC and Copper Base Plate Heat Sinks Using CFD,” Heat Transfer Asian Research, Vol. 40, No. 3, 2011, pp. 217-232.
- A. Part, R. Linton and D. Agonafer, “Coarse and Detailed CFD Modeling of a Finned Heat Sink,” IEEE Transactions on Components, Packaging and Manufacturing Technology, Vol. 18, No. 3, 1995, pp. 517-520.
- P. Mohan and P. Govindarajan, “Experimental and CFD Analysis of Heat Sinks with Base Plate for CPU Cooling,” Journal of Mechanical Science and Technology, Vol. 25, No. 8, 2011, pp. 2003-2012.
- J. Yang, W. Wang and L. Huazhi, “2-Dimensional CFD Simulation and Correlation Development for Optimization of Fin Heatsinks in Electronic Cooling,” Journal of Thermal Science, Vol. 10, No. 4, 2001, pp. 363-371.
- E. Ozturk and I. Tari, “CFD Modeling of Forced Cooling of Computer Chassis,” Engineering Applications of Computational Fluid Mechanics, Vol. 1, No. 4, 2007, pp. 304- 313.
- V. Eveloy, J. Lohan, and P. Rodgers, “A Benchmark Study of Computational Fluid Dynamics Predictive Accuracy for Component-Printed Circuit Board Heat Transfer,” IEEE Transactions on Components and Packaging Technologies, Vol. 23, No. 3, 2000, pp. 568-578.
- I. Tari and Y. Fidan-Seza, “CFD Analyses of a Notebook Computer Thermal Management System and a Proposed Passive Cooling Alternative,” IEEE Transactions on Components and Packaging Technologies, Vol. 33, No. 2, 2010, pp. 443-452.
- A. Part and P. G. Tucker, “CFD Applied to Electronic Systems: A Review,” IEEE Transactions on Components, Packaging, and Manufacturing Technology, Vol. 20, No. 4, 1997, pp. 518-529.
- T. Y. Lee and M. Mahalingam, “Application of a CFD Tool for System Level Thermal Simulation,” IEEE Transactions on Components, Packaging and Manufacturing Technology—Part A, Vol. 17, No. 4, 1994, pp. 564-572.
- T. Y. Lee, B. Chambers and M. Mahalingam, “Application of a CFD Technology to Electronic Thermal Management,” IEEE Transactions on Components, Packaging and Manufacturing Technology—Part B,” Vol. 18, No. 3, 1995, pp. 511-520. http://dx.doi.org/10.1109/96.404110
- S. Aradag, U. Olgun, F. Aktuk and B. Baskbuyuk, “CFD Analysis of Cooling Electronic Equipment as an Undergraduate Project,” Wiley Periodicals Inc., 2009.
- J. Choi, Y. Kim, A. Sivasubramaniam, J. Srebric, Q. Wang and J. Lee, “A CFD Based Tool for Studying Temperature in Rack Mounted Servers, IEEE Transactions on Computers,” Vol. 57, No. 8, 2008, pp. 1129-1142. http://dx.doi.org/10.1109/TC.2008.52
- A. Almodi, A. Thompson, N. Kapur, J. Summers, H. Thompson G. and Hannah, “Computational Fluid Dynamics Investigation of Liquid Rack Cooling in Data Centres,” Applied Energy, Vol. 89, No. 1, 2012, pp. 150-155. http://dx.doi.org/10.1016/j.apenergy.2011.02.003
- J. Rambo and Y. Joshi, “Modeling of Data Center Airflow and Heat Transfer: State of the Art and Future Trends,” Distributed Parallel Databases, Vol. 21, 2007, pp. 193-225. http://dx.doi.org/10.1007/s10619-006-7007-3
- R. Boukhanouf and A. Haddad, “A CFD Analysis of an Electronics Cooling Enclosure for Application in Telecommunication Systems,” Applied Thermal Engineering, Vol. 30, No. 16, 2010, pp. 2426-2434. http://dx.doi.org/10.1016/j.applthermaleng.2010.06.012
- Z. Khatir, J. Paton, H. Thompson, N. Kapur, V. Toropov, M. Lawres and D. Kirk, “Computational Fluid Dynamics (CFD) Investigation of Air Flow and Temperature Distribution in a Small Scale Bread-Baking Oven,” Applied Energy, Vol. 89, No. 1, 2012, pp. 89-96. http://dx.doi.org/10.1016/j.apenergy.2011.02.002
- D. B. Flowers and K. R. Anderson, “Numerical Simulation of Conduction Heat Transfer in a System of Slowly Rotating Concentric Shells Separated by Small Annular Gap Distances,” Numerical Heat Transfer Part A, Vol. 46, No. 9, 2004, pp. 1-17.
- K. R. Anderson, “CFD Analysis of OPALS Sealed Enclosure Electronics Sub-System,” Proceedings from the Thermal & Fluids Workshop, NASA JPL, Pasadena, 2012.
- Y. A. Cengel, “Heat Transfer—A Practical Approach,” McGraw-Hill, New York, 2010.
- F. P. Incropera and D. P. Dewitt, “Heat Transfer,” McGraw-Hill, New York, 1991.
- G. Ellison, “Thermal Computations for Electronics—Conductive, Radiative, and Convective Air Cooling,” CRC Press, Boca Raton, 2011.
- “Graftech Data Sheet,” 2013. www.graftech.com
- D. G. Gilmore, “Spacecraft Thermal Control,” Aerospace Press, El Segundo, 2002.
- “Chotherm Data Sheet,” 2013. www.chomerics.com
- M. A. Ismail, M. Z. Abdullah and M. A. Mujeebu, “A CFD Based Analysis on the Effect of Free Stream Cooling on the Performance of Micro Processor Heat Sinks,” International Communications in Heat and Mass Transfer, Vol. 35, No. 6, 2008, pp. 771-778. http://dx.doi.org/10.1016/j.icheatmasstransfer.2008.02.012