Advances in Materials Physics and Chemistry
Vol.07 No.05(2017), Article ID:76212,15 pages
10.4236/ampc.2017.75014
Characteristics of a Silicon Wafer <111> and <004> after Planting Nitrogen
Mehdi Simiari, Ramin Roozehdar Mogaddam*
Faculty of Science, Emam Ali University, Tehran, Iran

Copyright © 2017 by authors and Scientific Research Publishing Inc.
This work is licensed under the Creative Commons Attribution International License (CC BY 4.0).
http://creativecommons.org/licenses/by/4.0/


Received: January 3, 2017; Accepted: May 14, 2017; Published: May 17, 2017
ABSTRACT
In this paper, different steps of work and experiments that are done in order to implant nitrogen ion in silicon with the energy of 25 keV, density of 24 μA/cm2 and doses of 5 ´ 1013 atom/cm2, 1 ´ 1014 atom/cm2 and 1 ´ 1015 atom/ cm2 (according to the calculation and applying time at planting) at room temperature (in the lack of heat phase) and without annealing will be presented. The XRD analysis is done before and after planting to observe changes in the lattice and the possibility of forming a crystalline phase of silicon nitride in this case. Also, the study of changes in the lattice arrangement and AFM analysis is done to observe the topography of the surface. Besides, the investigation on surface roughness and changes caused by ion implantation on the surface and spectrophotometry analysis before and after planting due to the study of changes in optical properties are done.
Keywords:
Silicon Wafer, Nitrogen Ion Implantation, XRD Analysis, AFM Analysis, Spectrophotometry Analysis

1. Introduction
Deposition of external ions on the surface of a material makes changes in its structure and composition which create new properties [1] [2] . This technology has highly increasing value in both industry and basic research [3] .
The material surface is always in touch with its surroundings [4] [5] . Corrosion and erosion are found on the surface of objects and are related to light and interaction with external electric and magnetic fields in surface [6] . By shrinking electronic and mechanical components, surface to volume ratio increases and therefore its features become more important [7] . At the same time, electrical, mechanical, optical and chemical properties which are necessary for an object, are in opposition to the requirements of their mass properties, such as low cost of the material, high strength and easy construction of the object [8] [9] [10] . Techniques called ion implantation, provide freedom of action and unexpected control in the preparation of surfaces in terms of having special properties which are independent of their bulk properties [11] . The approximately controllable amount of each element can be transformed into an ion beam and then, accelerated by the electrostatic method, followed by mixing it with the host material by radiating it on the surface of a material [12] [13] . At the same time, at a predetermined depth from the layer that its thickness in surface area is probably one ten-millionth of a meter, external ions are combined with the atoms of the host material [14] [15] . This action leads to unique structures and combinations. For example, it is possible to prepare alloy from metals that are unmixable in a liquidstate or put a substance into another substance in such concentrations that can never be done in high temperatures needed to mix them [16] . So often, the surface properties in unexpected and favorable ways are changed [17] .
In this paper, the phase of Si3N4 is formed using ion implantation and the formation of desired crystalline phases is studied using XRD tests before and after planting and comparing of intensity peaks at different 2
2. Sample Properties
The samples are pure silicon which is separated from wafers with the directions of <111> and <004>. The average thickness for sample <111>and <004> is 260 µm and 390 µm, respectively, and the diameters are equal to 20 mm [18] . Crystal structure of the semiconductor Si is similar to the diamond crystal structure which is formed from two immersed fcc lattices with the basement of 1/4 1/4 1/4 0 0 0 [19] . Thus, another atom should be added to each of four atoms which make up the fcc cell, in that case, each square cell will have 8 atoms. As can be seen from Figure 1, atoms have a tetrahedral shape which is a characteristic of covalent bonds of sp3. Diamond cubic structure with a fraction of the packing 0.34 is more open than the fcc and bcc structures [20] [21] .
2.1. Sample Preparation Step
After separating the samples from the wafer which is cut from a crystal grown of silicon, one should scour and polish the surface which makes them favorable. It is also necessary to eliminate pollution and fats from the surface. Of course, in order to removal of silicon surface, one can use a variety of methods including

Figure 1. Si structure is similar to the structure of cubic crystals of diamond. The crystal lattice of this element is formed as fcc cells with the basement of 1/4 1/4 1/4 0 0 0. So the cell is included 8 atoms.
chemical methods such as ultrasonic methods which we used in our study. Another important point related to the handling and storage of the samples is that while keeping the container along with dehumidifiers (silica), it is necessary to prevent from external contact.
2.2. Ion Implantation on the Surface
At this stage, ion implantation of nitrogen ( ) on the surface of prepared silicon samples (two samples of Si <111> and a sample of Si <004>) is done with the following conditions without annealing and activating the heat phase. The ion implantation on surface is done with the energy of 25 keV, current density of 24 μA/cm2 and doses of 5 × 10¹³, 1 × 10¹⁴and 1 × 10¹⁵ atom/cm2. Dose is obtained by applying calculated time through following formula [19] :
 (1)
(1)
where T(s) is planting time (in seconds) and k(s) is rotation coefficient of the sample which in this case it will be considered as 1, because of lack of rotation. D(atom/cm2) is desired dose for planting, 0.25 × 10¹² is a constant factor related to the used equipment and J10 is applied current density in the system. According to Equation (1) and selecting the desired dose, planting time for each dose is as follows (Table 1).
3. Results and Discussion
3.1. Performing X-Ray Diffraction Spectroscopy Analysis
To study the lattice structure and changes caused by sowing, XRD analysis is used. In this analysis, copper which has wavelengths of  and
and  is used as anode. Also, the angles used for analysis were taken from
  to
to .
.
The obtained results in Figure 2 and Figure 5 show regular crystal lattice peak of <111> and<004> before ion implantation. After nitrogen ion implanta-

Figure 2. Comparing XRD analysis for Si <111> before and after implanting.

Table 1. Planting time calculation for selected doses.
tion by mentioned conditions and below states which has changed in order to cutting the sample and nitrogen ion implantation dose on the surface, the XRD results are observed.
In the case of this analysis, for Si <111> where nitrogen is implanted with the dose of 5 ´ 1013 atom/cm2, it is observed that in these conditions, planting causes undermining of Si peak. This is because of low-dose nitrogen implantation (implantation time is not sufficient) in which the arrangement of the lattice is decreased and its surface is destroyed and the lattice has changed its structure to the amorphous. By increasing the dose to 1 ´ 1014 atoms/cm2, the Si <111> peak is undermined and we see that because of the low dose implantations (imposed by time shift planting), there is not an opportunity to create a combination of silicon nitride that can be seen clearly in Figure 2. If the dose of 1 ´ 1015 atoms/ cm2 is applied by the same conditions on Si <004>, Si3N4 peak is observed near the peak of Si <004> and Si <004> peak is boosted by Si3N4 peak. According to Figures 2-4, we see that due to the ion implantation on the surface at a low dose, the Si <111> peak is undermined in planting with doses of 5 ´ 1013 and 1 ´ 1014 atoms/cm2 and despite doubled planting dose, still there is not an opportunity to make a mix on sample. But when the implantation is done on Si <004> with the dose of 1 ´ 1014 atoms/cm2, Si3N4 peak is observed that formation of this combination can be related to strengthening the Si <004> peak by nearly located Si3N4 peak (Figure 5 and Figure 6).

Figure 3. Comparing XRD analysis for Si <111> before and after implanting in the location of the second peak.

Figure 4. Comparing XRD analysis for Si <111> before and after implanting in the location of the first peak.

Figure 5. Comparing XRD analysis for Si <004> samples before and after implanting in the location of the peak.
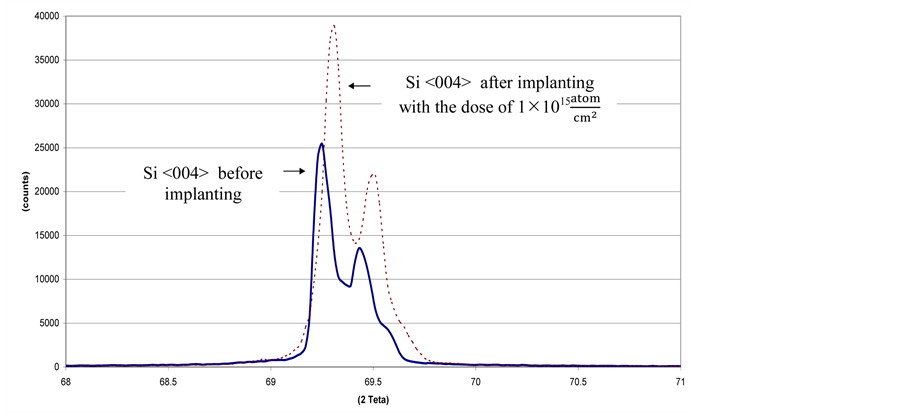
Figure 6. Comparing XRD analysis for Si <004> before and after implanting.
3.2. AFM Analysis
AFM images for samples before ion implantation are as following: AFM image of Si <111> is shown in Figure 7 and the maximum observed height on the surface is 12.49 Å and also changes in roughness (the square average of the height difference between the lowest and highest point of the surface = Rms rough) are equal to 0.63Å. AFM image of Si <004> is shown in Figure 8. The maximum observed height on the surface is 30.2 Å and also Rms rough is 0.89Å. AFM image of Si <111> that nitrogen ion is implanted on its surface with a dose of 5 ´ 1013 atoms/cm2 is shown in Figure 9; the maximum observed height on the surface is 49.9 Å and also Rms rough is 0.84Å. AFM image of Si <111> that nitrogen ion is implanted on its surface with a dose of 1 ´ 1014 atoms/cm2 is shown in Figure 10; the maximum observed height on the surface is 112.1 Å and also Rms rough is 2.54Å that relatively is a high roughness, and also AFM image of Si <004> that nitrogen ion is implanted on its surface with a dose of 1 ´ 1015 atoms/cm2 is shown in Figure 11. The maximum observed height on the surface is 60.3 Å and also Rms rough is 1.70 Å.
According to the form of graphs and Table 2 and Table 3, it is clear that planting on a sample as well as increasing the dose, increases the surface roughness.
3.3. Analysis and Calculations of Spectroscopy
In this phase, for Si <111> and Si <004> before and after planting ( ) with different doses, transmittance and reflection percentages of light for 200 - 250 nm wavelengths that cover the visible region (VIS), ultraviolet (UV) and infrared (IR) spectrophotometry is done. It should be noted that this analysis is done by spectrophotometer (400/500 Cray). Using the obtained results, the amount of energy gap, absorption coefficient, the amount of penetration depth in different situations (changes in the wavelengths and surfaces of samples by different ion implantations) are calculated, studied and analyzed.

Figure 7. Surface topography of Si <111> by AFM analysis.

Figure 8. Surface topography of Si <004> by AFM analysis.
Table 2. Roughness changes for Si <111> before and after nitrogen ion implantation.

Figure 9. Surface topography of Si <111> after ion implantation by AFM analysis (5 × 10¹³ atoms/cm2).

Figure 10. Surface topography for Si <111> after ion implantation by AFM analysis (1 × 10¹⁴ atoms/cm2).
Table 3. Roughness changes for Si <004> before and after nitrogen ion implantation.

Figure 11. Surface topography of Si <004> after ion implantation by AFM analysis (1 × 10¹⁵ atoms/cm2).
3.3.1. Measuring the Percentage of Transmitted Light
According to Figure 12 and Figure 13, one can observe the transmitted light percentage for Si <111> and Si <004> before and after planting and their changes. In Si <111>, according to Figure 12 which corresponds to the percentage of light in mentioned wavelengths before and after implantation with doses of 5 × 10¹³ and 1 × 10¹⁴ atoms/cm2, it can be seen that the percentage of transmission after planting and by increasing doses is declined. Also, in Si <004> according to Figure 13 before and after implantation with the dose of 1 × 10¹⁵ atoms/cm2, it can be seen that the percentage of displacement after planting is declined.
3.3.2. Measuring the Percentage of Reflection
According to figures generated by the spectrophotometric analysis, one can observe the percentages of reflected light from Si <111> and Si <004> before and after planting and their changes. In Si <111> according to Figure 14 which corresponds to the percentage of light in mentioned wavelengths before and after implantation with doses of 5 ´ 1013 and 1 ´ 1014 atoms/cm2, it can be seen that the percentage of reflected light after planting and by increasing doses is increased. Also, in Si <004> according to Figure 15 before and after implantation with the dose of 1 ´ 1015 atoms/cm2, it can be seen that the percentage of transmission after planting is increased.
3.3.3. Measuring the Amount of Light Absorption by the Percentage
By using previous charts, the values of T and R, are assumed in the terms of percentage and using Equation (2), a value is calculated for different wavelengths

Figure 12. Light transmittance variation curve for Si <111> by a spectrophotometer.

Figure 13. Light transmittance variation curve for Si <004> by a spectrophotometer.

Figure 14. Light reflection variation curve for Si <111> by a spectrophotometer.

Figure 15. Light reflection variation curve for Si <004> by a spectrophotometer.
and their graphs are designed. According to designed Figure 16 and Figure 17, it can be seen that the absorption of light after nitrogen ion implantation on silicon as well as the amount of implantation dose show a significant decline.
 (2)
(2)
3.3.4. Measurement of the Absorption Coefficient (α)
The absorption coefficient is obtained by the following equation:
 (3)
(3)
where d is the thickness of the sample, It is transmitted light intensity and Ii is intensity of the input beam. According to analysis by spectrophotometry,  is
is
obtained and considering that this proportion is different at various wavelengths, in addition to d, a also depends on the wavelength. This means that for each wavelength we have an absorption coefficient.
Using Equation (3) and the results of spectrophotometric analysis,  and
and
also d = 20 µm (According to the measurements that have already done), the absorption coefficient of Si <111> and Si <004> before and after nitrogen ion implantation with different doses, is calculated and its chart is shown in Figure 18 and Figure 19.
3.3.5. Measurement of the Depth of Light Penetration
The absorption coefficient is an important factor that can be used in the calculation of material properties. One of these calculations is penetration depth of light at different wavelengths which we obtain for Si <111> and Si <004> before and after nitrogen ion implantation with various doses.
Penetration depth is penetration length of light in the materials that the intensity of incident light reaches to  of its value in the surface of the semicon-

Figure 16. Light absorption variation curve for Si <111>.

Figure 17. Light absorption variation curve for Si <004>.

Figure 18. Light absorption coefficient (α) variation curve for Si <111>.
ductor. This length is useful to estimate how much light penetrates the semiconductor. Light penetration depth is obtained from ϭ = 1/α. The depth of light penetration for Si <111> and Si <004> before and after implantation is shown in Figure 20 and Figure 21.
4. Conclusions
We conclude from XRD analysis before and after nitrogen ion implantation on silicon surfaces (with different doses) that by increasing ion implantation doses, we approach to a new combinations of crystal structure and with intended conditions for planting, silicon nitride is prepared.
Ion implantation on the surface causes changes on the surface and increases surface roughness which is due to the ion bombardment.

Figure 19. Light absorption coefficient (α) variation curve for Si <004>.

Figure 20. The depth of light penetration variation curve for Si <111>.

Figure 21. The depth of light penetration variation curve for Si <004>.
Spectrophotometric analysis showed that after planting and also by increasing the dose of nitrogen implanting on Si <111> and Si <004> that are in 200-2500 nm wavelengths covering the visible region (VIS), ultraviolet (UV) and infrared (IR), the amount of light reflection percentage increases apparently and the reduction of light transmission is obvious as well.
Of course, reduction of transmission can be related to an increase in the thickness of samples. But thickness measurements demonstrated that the thickness of samples does not change noticeably after planting and this can be justified in this way that nitrogen ions in the implantation process will dug up silicon atoms and replace in their places. That is, it does not increase the amount of samples.
By calculating the absorption coefficient, one can observe that the absorption coefficient increases as a result of planting and increasing the dose that this conclusion is predictable due to the shrinking energy gap. The gradual reduction of light penetration depth in Si semiconductors for mentioned wavelengths by implantation and increasing the implantation dose is also an interesting result.
Cite this paper
Simiari, M. and Mogaddam, R.R. (2017) Characteristics of a Silicon Wafer <111> and <004> after Planting Nitrogen. Advances in Materials Physics and Chemistry, 7, 173-187. https://doi.org/10.4236/ampc.2017.75014
References
- 1. Sado, A. (1991) Optical Properties of Crystalline and Amorphous Semiconductors. Springer, Berlin.
- 2. Saxena, A.N. (1969) Forward Current-Voltage Characteristics of Schottky Barrier on n-Type Silicon. Surface Science, 13, 151-171.
- 3. Salehi, A. (1999) Radiation Damage in Air Annealed Indium Tin Oxide Layers. Thin Solid Films, 338, 197-200.
- 4. Salehi, A. (1998) The Effects of Deposition Rate and a Substrate Temperature of ITO Thin Films on Electrical and Optical Properties. Thin Solid Films, 324, 214-218.
- 5. Streetman, B.J. (1980) Solid State Electronic Devices. 2nd Edition, Prentice Hall, Upper Saddle River.
- 6. Moffat, C. (2002) The Resonant Tunneling Transistor. Image Processing Group, Uni. College, London.
- 7. Ferry, D.K. (1997) Transport in Nanostructures. Cambridge University Press, Cambridge.
https://doi.org/10.1017/CBO9780511626128 - 8. Kahng, D. and Atalla, M.M. (1960) Transport in Nanostructures. Cambridge University Press, Cambridge.
- 9. Morgan, D.V. (1991) An Introduction to Semiconductor Microtechnology. 2nd Edition, John Wiley and Sons, Hoboken.
- 10. Dylewski, J. and Joshi, M.C. (1997) The Dielectric Breakdown Properties and I-V Characteristics of Thin SiO2 Films Formed by High Dose Oxygen Ion Implantation into Silicon. Thin Solid Films, 42, 227-235.
- 11. Dylewski, J. and Joshi, M.C. (1976) Formation of the Thin SiO2 Film by High Dose Oxygen Ion Implantation into Silicon and Their Investigation by IR Techniques. Thin Solid Films, 35, 327-336.
- 12. Gibbons, J.F. (1980) Ion Implantation. In: Handbook on Semiconductors, North-Holland Publishing Company.
- 13. Gill, S.S. and Wilson, I.H. (1978) Rutherford Backscattering Analysis of Oxide Layers Formed by Ion Implantation into Single-Crystal Silicon. Thin Solid Films, 55, 435-448.
- 14. Jones, K.S., Robinson, H.G., Listebargera, J., et al. (1995) Studies of Point Defect/ Dislocation Loop Interaction Processes in Silicon. Nuclear Instruments and Methods in Physics Research Section B: Beam Interactions with Materials and Atoms, 96, 196-201.
- 15. Krautle, H. (1976) Model Calculations of Profiles and Dose of High Dose Ion Implants. Nuclear Instruments and Methods, 134, 167-172.
- 16. Chang, L.L., Esaki, L. and Tsu, R. (1974) Resonant Tunneling in Semiconductor Double Barriers. Applied Physics Letters, 24, 593-595.
https://doi.org/10.1063/1.1655067 - 17. Shur, M. (1990) Physics of Semiconductor Devices. Prentice Hall, Upper Saddle River.
- 18. Sze, S.M. and Ng, K.K. (2006) Physics of Semiconductor Devices. 3rd Edition, John Wiley and Sons, Hoboken.
https://doi.org/10.1002/0470068329 - 19. Thomas Pirary, S. and Peercymaren, P.S. (1985) Ion Implantation of Surfaces. Scientific American, USA.
- 20. Bussmann, U., Meerbach, F.H.J. and TeKaat, E.H. (1989) Si3N4 Crystallization during High-Temperature Nitrogen Implantation into Silicon. Nuclear Instruments and Methods in Physics Research Section B: Beam Interactions with Materials and Atoms, 39, 230-233.
- 21. Varshni, Y.P. (1967) Temperature Dependence of the Energy Gap in Semiconductors. Physica, 34, 149-154.