Advances in Materials Physics and Chemistry
Vol.3 No.4(2013), Article ID:36089,21 pages DOI:10.4236/ampc.2013.34033
Electroosmotic Water Vapor Transport across Novel, Smart, Functionalized Conducting Polymer Microporous Membranes in Active Mode at Very High Rates, with Concomitant Chemical Warfare (CW) Agent Blocking
1Ashwin-Ushas Corporation, Marlboro, NJ, USA
2US Army Engineer Research and Development Center, Construction Engineering Research Laboratory (ERDC-CERL), Champaign, IL, USA
3Chemical and Biological Technologies Directorate, US Defense Threat Reduction Agency (DTRA), Fort Belvoir, VA, USA
4Warrior Science, Technology, and Applied Research Directorate, US Army Natick Soldier Research, Development, and Engineering (RD&E) Center, Natick, MA, USA
5Hazardous Materials Research Center (HMRC), Battelle Columbus Laboratories, Battelle Memorial Institute, Columbus, OH, USA
Email: *chandra.p2@ashwin-ushas.com
Copyright © 2013 Prasanna Chandrasekhar et al. This is an open access article distributed under the Creative Commons Attribution License, which permits unrestricted use, distribution, and reproduction in any medium, provided the original work is properly cited.
Received June 30, 2013; revised August 1, 2013; accepted August 15, 2013
Keywords: Electroosmotic; Transport; Smart; Microporous; Membrane; Conducting; Polymer; Functionalized
ABSTRACT
Electroosmotic water vapor transport (WVT) across very thin, flexible, functionalized conducting polymer (CP) microporous (μP) membranes at a very high rate is reported. Both passive and active (6 VDC applied) WVT are reported, the latter for the first time ever. WVT occurs with concomitant, effective blocking of chemical warfare (CW) agents, again demonstrated for the first time ever. Initial active liquid||membrane||liquid interface studies demonstrated WVT rates of >1.7 × 10⁻⁵ g∙mm−2∙s−1, >3 × the highest prior reported values of 5 × 10⁻⁶ g∙mm−2∙s−1. Subsequent vapor||membrane|| vapor interface studies using industry-standard methods (including ASTM E96B Upright Cup (“WVT”), ASTM F2298 (“Dynamic Moisture Permeation Cell”) and ASTM F1868 (“Sweating Guard Hotplate”) were done at independent, external labs for independent corroboration. These yielded, e.g., WVT values of 2564.4 g∙m2∙d−1 (passive) and 3706.7 g∙m2∙d−1 (active), to be compared with the highest (passive) value ever reported previously, 984.8 g∙m2∙d−1 for a μP-Nylon membrane. More than 15 different membrane configurations, porosities and types were studied, including membranes with CP + organophosphate hydrolase (OPH), an enzyme reactive to CW agents. Efficient blocking of the actual CW agents GB, HD, VX is also reported, using the TOP-8-2-501 standard. Membranes also passed all Industrystandard durability tests, e.g. ASTM D2261 (Tearing), ASTM D5034 (Breaking), ASTM D3886 (Abrasion), ASTM F392 (Gelbo Flex). Incorporation into smart soldiers’ garments was demonstrated; power consumption was <1 W∙m−2. Mechanisms of enhanced WVT and CW agent blocking in the membranes are discussed.
1. Introduction
1.1. Electrokinetic Effects and Passive and Active Electroosmosis
The four electrokinetic effects-electrophoresis and the related sedimentation potential; and electroosmosis and the related streaming potential-emanate from the existence of electrical charges on the surfaces of particles or walls of channels (such as capillaries or pores) [1-12] are introduced. Of these effects, electroosmosis refers to the movement of a liquid or condensed vapor relative to a stationary charged surface (such as that found in a capillary, membrane micropore, or microfluidic channel). The electroosmotic effect is proportional to the zeta potential, which in turn is directly related to the charge on the surface in question [5,6].
Electroosmosis may occur not only in a purely liquid phase, but also in combined vapor/liquid phases. In the latter case, vapors may condense on walls of a capillary or membrane micropore, be transported, and then reevaporate [1-9,13-19]. This in effect leads to the transportation of vapor across the capillary or micropore in question [13-19]. Electroosmosis is one of the two driving forces behind the permeation of water vapor through “breathable” microporous membranes (such as the well known Gore-Tex® PTFE (poly(tetrafluoroethylene)) membranes used in recreational outerwear). The other driving force is the combined concentration and temperature gradients across the membranes when worn in garments; this is also believed to have an electrochemical basis [13-16]. These gradients assist in driving water vapor, e.g. as generated by sweating, from the inside of a garment (which is warmer and more humid) to the external environment, while simultaneously keeping out liquid water, making the garment “breathable” [13-16]. Quite evidently, the electroosmotic effect in such membranes is passive, i.e. it emanates from the natural charge or potential difference present across the micropores, rather than due to active application of this potential or charge difference. Additionally, of course, such microporous garments do not block against noxious or poisonous vapors permeating from the environment into the interior of the garment.
1.2. Prior Electroosmotic Studies
Active (i.e. with voltage or current applied) electroosmotic studies on microporous membranes have been reported in the past [7-12,20-23], but exclusively on [liquid||membrane||liquid] interfaces; they use generally aqueous electrolyte solutions of identical composition. In these studies, a voltage or current is typically applied across two electrodes placed on either side of the membrane, and the resulting electroosmotic flow measured. For example, Bowen and Clark [7-10] and subsequently, Mullet et al. [12], described variations of a simple “dipped cell” apparatus in which the electroosmotic effect was measured as liquid overflow registered by a capillary or micropipette, recorded by a sensitive balance. The microporous membranes they studied were of rigid alumina and titania. They calculated the electroosmotic flow based on the detailed mathematical treatments set forth by Bowen [7], and Kozak and Davis [11]; these in turn were based on earlier treatments of Smoluchowski [1-2], Henry [3], and Levine and Neale as elaborated by Saville [4] and corroborated later by Hernandez et al. [8] and Basu and Sharma [9]. Electroosmotic flow rates measured were extremely low. More recently, Vajandar et al. [20] reported electroosmotic “pumping” using silica-coated alumina microporous membranes with poresizes of 0.02 to 0.3 μm, for possible applications in biomedical lab-on-a-chip devices, and micropumps for microelectronic cooling; the electroosmotic flow rates they achieved were only marginally better than those of Bowen and Clark and Mullet et al. [10,12]. Miller and Martin [21] studied electroosmotic flow in very thin (60 μm) carbon nanotube membranes; once again, flow rates were very low, and there were other issues, such as stability of the membranes. Li et al. [22] reported results of electroosmosis and iontophoresis studies with polycarbonate microporous membranes and transdermal electroosmosis and iontophoresis in human epidermal membrane, at applied voltages up to +/− 1.0 V; their results were consistent with a model in which the human epidermal membrane has net-negatively-charged pores. Lee and Hong [23] measured electroosmotic flow rates across microporous membranes, including polysulfone membranes, as a function of pH and ionic strength of the aqueous solutions used; once again, however, the flow rates they reported were extremely low. It may also be noted that all these prior experimental studies comprised, in effect, active, electroosmotic transport of liquid across membranes, not transport of vapor across membranes, as we report here.
In other prior work more relevant to a [vapor||membrane||vapor] interface, McCullough et al. [17,18] carried out a very detailed and thorough comparative study of passive WVT (i.e. vapor transport) rates and evaporative resistance of a large number of commercially available microporous membranes; they used a number of standardized tests such as the ASTM tests that we also utilized. Indeed, their work is still used as an “industrystandard” benchmark to compare performance of other membranes and materials, as it will be used in the present work.
1.3. Work Presented in the Present Study
In the present communication, we report passive as well as active electroosmotic water vapor transport (WVT) across very thin, flexible, functionalized microporous conducting polymer (CP) membranes, the latter for the first time ever, to the best of our knowledge. Both the active nature of the electroosmotic water vapor transport and its magnitude two to five times the highest (passive) water vapor transport (WVT) rates previously reported for any microporous membranes [17-19]—represent first, to the best of our knowledge. We show further that it is the CP that is postulated to be the element that imparts the critical, increased WVT rate, through the existence of an intrinsic potential difference across the CP membrane. Furthermore, our membrane assemblies are also shown to simultaneously block chemical warfare (CW) agents very effectively, and to be otherwise highly environmenttally durable.
As a first segment of our present studies, in an effort to use the methodology of the prior electroosmotic studies reported in the literature cited above [10-12,20-23] for comparative reasons, we studied a very large number of membranes in a [liquid||membrane||liquid] interface. Both galvanostatic (constant current) and potentiostatic (constant voltage) studies were carried out. Values for electroosmotic liquid transport up to 50 times than those of the prior studies were obtained in our work. Typical values of liquid transport of 1.4 × 10⁻⁵ to 2.1 × 10⁻⁴ g∙mm2∙s−1 (grams per square millimeter per second, an industry-standard unit of measure) were obtained in our studies, to be compared with values of 4.0 × 10⁻⁶ to 5.0 × 10⁻⁶ g∙mm2∙s−1 reported in the best prior studies, those of Mullet et al. [12].
As a second segment of our present studies, direct [vapor||membrane||vapor] interface studies of electroosmotic WVT were carried out, again in both potentiostatic and galvanostatic mode. Very large and rapid relative humidity (RH) changes were observed across the membrane interface in a very short time.
As a third segment of our studies, a large number of “industry-standard” tests [24-26], carried out primarily at external testing labs for independent corroboration, were used to verify the WVT, evaporation resistance, environmental durability, and other relevant properties of our membrane assemblies. For WVT, these tests included, e.g., the ASTM E96 B (WVT), ASTM F2298 (Dynamic Moisture Permeation Cell, DMPC) and ASTM F1868 (Sweating Guard Hotplate, SGHP) tests; these yield results generally in units of g∙m2∙d−1, i.e. grams of water vapor permeating per square meter per day, another industry-standard unit of measure. Tests were performed in large part on “final-form” fabrics, i.e. membranes incorporated into fabrics. A very large number of membrane types, porosities and membrane assembly configurations were studied.
As a fourth segment of our studies, CW-agent blocking was clearly demonstrated with CW agents at a facility qualified for performing such tests (Battelle Columbus Labs).
As a fifth segment of our studies, a variety of standardized environmental durability and related tests were performed. These ranged from ASTM D 2261 (“Tearing Strength of Fabrics”) to ASTM F392/F392M-11 (“Gelbo Flex Test”). Our materials passed all these tests without problems.
A final segment of our studies encompassed miscellaneous studies related to practical application as a wearable garment. They included, e.g., the use of “smart” controllers to limit the current densities in our active membranes to prevent burnout as well as possible fire hazards while simultaneously ensuring adequate WVT; they also included preliminary selection of Li ion batteries. The controllers were also designed to use inputs from humidity and temperature sensors inside and outside the garment, so as to stop application of the active applied potential when not needed. They thus contributed to a truly “smart” membrane material.
Also presented in the current work is an analysis of the likely mechanisms of WVT (both passive and active) as well as of CW agent blocking in our unique membrane materials, in light of prior experimental studies as well as prior theoretical treatments.
As a final introductory note, it is noted that although this work was initiated in 2003 and much of it completed several years ago, it could not be presented until now for various reasons.
1.4. Objectives of the Present Work
This work was initiated to address a specific need to create a fabric that is lighter, and could be used to create a more comfortable garment when worn in a hot environment.
2. Experimental
2.1. Materials, Electrodes and Conducting Polymer (CP) Microporous Membrane Electrode Substrates
Microporous membrane substrates, comprising poly (sulfone), poly(ether sulfone), PTFE (poly(tetrafluoroethylene)) and poly(ethylene terephthalate), of pore size from 0.05 to 2.0 μm, were procured from GE Osmonics, Pall Gelman Labs and other vendors. Au was deposited on both sides of these via e-beam thermal evaporative deposition, to a thickness of ca. 500 nm. This Au/microporous membrane/Au (“Au|μP|Au”) comprised the electrode substrate, on which the CP was electropolymerized, as described earlier in extensive detail [27-32, 35-38]. Monomers (aniline, diphenyl amine), dopants (K salt of poly(anetholosulfonate) and its analogue with pendant sulfate groups), CW agent simulants (dimethyl methyl phosphonate (DMMP), diisopropyl methyl phosphonate (DIMP), diethyl (methylthiolmethyl)phosphornate (DEMTMP), others) and all other chemicals and solvents, all of ACS reagent or higher grade, were procured from Sigma-Aldrich and Alfa Aesar. The electrochemical polymerization of the CP was carried out from a mixed monomer solution as described in extensive detail in our earlier communications [27-32,35-38]. The thickness of the CP/dopant layer, monitored coulometrically, lay between 0.4 and 1.6 μm. Although the microporous membrane was deposited on both sides with Au, in nearly all configurations used (see below), the CP was deposited only on one side of the membrane, the other side left as bare Au. The electrode having the CP was then generally designated as the “working” electrode and the other electrode as the “counter” electrode, although this terminology is primarily for convenience. The identity of the CP used did not change in our studies. The CP/ Au/membrane electrodes were checked for electrochemical activity via standard cyclic voltammetry (see below); IR reflectance spectroscopy of the CP/Au/membrane surface, was also used, if deemed necessary, for further quality control of the CP electrode substrates (see below).
The gel electrolyte (“GelEl”), which incorporated the dopant, comprised poly(vinyl alcohol), average Mw 31,000 to 50,000, poly(ethylene glycol), average Mn ca. 900, in 95%/5% weight ratio. In some cases, as noted in the Discussion, the GelEl incorporated a low, proprietary concentration of OPH (organophosphate hydrolase), an enzyme reactive to the phosphonate group and capable of effectively neutralizing CW agents and simulants while not affecting the vapor and ion transport properties of its host material. These components were dissolved in deionized water having the dopant at 0.6 M concentration, with nearly all the water evaporated off subsequently. This yielded a transparent, flexible, rubbery material. Its preparation has been described in great detail elsewhere [27-32,35-38].
For the few tests carried out with OPH-impregnated electrode substrates, the procedure for impregnation of the OPH enzyme into the CP matrix, based in part on an adaptation of the most efficient procedure reported in earlier literature studies [41,42], was as follows: A saturated (>0.5 mg/mL) solution of OPH enzyme (Libradyne, Inc.) was prepared in deionized water. A previously deposited CP/Au/microporous membrane substrate was then placed, CP-side up, in a petridish filled with this OPH solution, and left overnight in a refrigerator (5˚C). The membrane was then removed, rinsed copiously with deionized water, and air dried at room temperature. The activity and concentration of the OPH within the CP/ membrane was determined using Ellman’s reagent and Malathion (analyte) according to published procedures [41-42], with Ellman’s reagent absorbance monitored at 412 nm and the characteristic OPH IR reflectance peak, monitored at 1650 cm−1 [41-42].
Where appropriate, UV-Vis-NIR spectra were taken using a Perkin-Elmer (P-E) Model Lambda 12 spectrometer controlled by P-E software on a PC; when reflectance rather than transmission spectra were required, these were measured using appropriate specular and diffuse reflectance accessories and standards provided by the vendor. Again where appropriate, FTIR spectroscopy, was carried out using a P-E Model Spectrum One FTIR spectrometer, again controlled by P-E software on a PC; these FTIR spectra were primarily reflectance spectra, carried out using specular and, rarely, diffuse, reflectance accessories and standards supplied by the vendor.
Electrochemical measurements, e.g. cyclic voltammetry for quality control of the CP electrode substrates, were carried out using an Ametek-Princeton Applied Research Model 263A potentiostat/galvanostat with 2 A option; potentiostatic electro polymerizations were also occasionally carried out using a Bioanalytical Systems Model PWR-3 potentiostat.
2.2. Membrane Assembly (Fabric) Configurations
The CP microporous membranes as prepared above were then incorporated into composite assemblies with different components or configurations, as represented in the schematics in Figure 1. For convenience and reference throughout our work, each type was given a designation (e.g. “Type IIa”), and a shorthand notation, e.g. [inside| Au|μP-PSulf|Au|GelEl|μP-PTFE|outside] for Type IIa, as described at length in Section 2.1 above. For application of the GelEl, prepared as described above, it was heated to ca. 80˚C to render it fluid, then applied, using a syringe, as a mass on top of the center of the assembly,
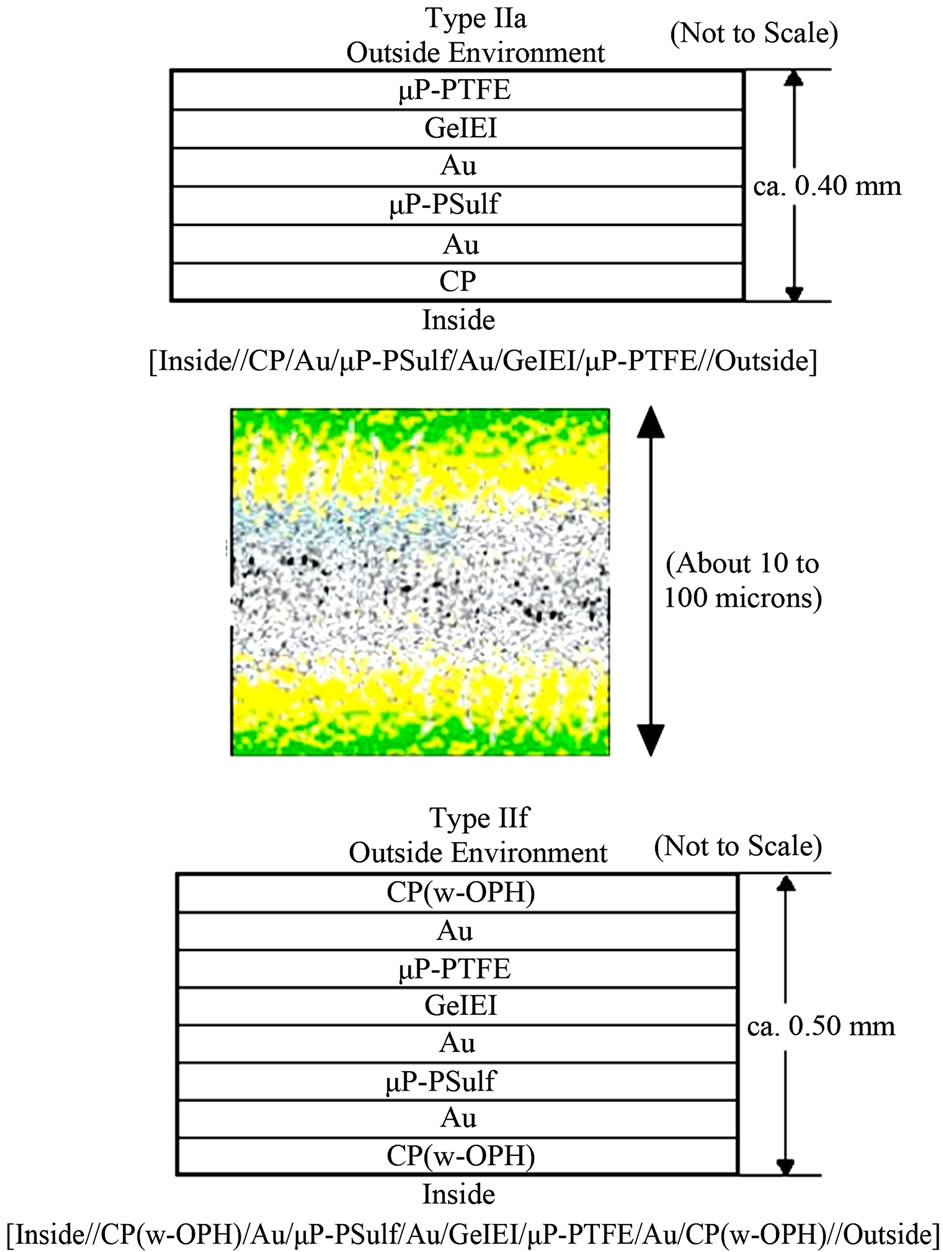
Figure 1. (Top, Bottom): Schematic representation of just two of the several membrane configurations studied in this work. (For the shorthand notation and abbreviations used, see text.) (Center): Schematic of the CP/Au/membrane structure (green = CP, yellow = Au, speckled white = microporous membrane); shown here for one of the doublesided electrodes. It shows that the CP, Au, etc. layers are not solid layers, but rather, permeate well into the micropores. This “permeative” feature has an important bearing on the electroosmotic effect, as discussed in the text.
then spread to even thickness using a doctor blade technique. The entire assembly was then clamped between glass plates and the GelEl left to cure overnight. What resulted was a flexible, fabric-like material.
2.3. Fabrication of Complete, Active “Cloth”
To arrive at complete, active fabrics usable to build a garment, additional components were added to the above membrane assemblies and complete fabrics assembled, as shown in Figure 2 (the photos therein show the assembly for a Type IIa configuration). As a first step, individual “pixels”, of approximate size 10 cm × 10 cm, were prepared. Next, they were assembled into arrays, with like electrodes (counter, working) connected in parallel, using very thin, flexible ribbon cable and electrically contacted with a urethane-base (i.e. flexible) Ag adhesive. The various layers of the assembly were bonded together and onto Nylon Ripstop camouflage cloth, available commercially from many vendors (e.g. Rockywoods, www.rockywoods.com), as shown in Figure 2; this was done using environmentally durable, neutral, pressure-sensitive adhesive (PSA) of a type used commercially in extreme-weather clothing, e.g. ThermO-Web # 3738 adhesive (www.thermowebonline.com), formed into a small-footprint, mesh-type matrix, again as shown in Figure 2. (Ripstop fabrics are fabrics woven using a special reinforcing interweave technique that makes them resistant to tearing and ripping.)
The resulting material was a very lightweight, flexible, drapable “cloth”. This complete cloth was then used for all testing, such as the WVT testing, as described below. In actual, final use, the inner fabric layers will not constitute Nylon Ripstop cloth, but rather a much thinner, highly porous material.
2.4. Liquid-Liquid Interface ([liquid||Membrane||Liquid]) Tests
As a first series of tests, liquid-liquid interface tests were carried out using the apparatus depicted schematically in Figure 3, emulating the apparatus and methodology used in the electro-osmotic measurements of Mullet et al. [12], Kozak et al. [11] and Bowen and Clark [10]. These tests thus comprised a first set of electro-osmotic studies primarily to serve as a comparison of the performance of our membranes with those of prior studies. Electro-osmotic transport was measured as a capillary overflow, as depicted in Figure 3, to be measured with a microgram balance; in practice, large milligram quantities of liquid overflow were observed. The membrane area tested was typically 17.4 cm2 (membrane diameter 4.7 cm) Electrolytes tested included Na2SO4 and NaCl, typically of concentration 0.01 to 0.001 M. Reference membranes tested included Whatman Anodisc 47 (poresize 0.2 μm), ex-

Figure 2. Photos of the components of functional fabric in various stages of fabrication (cm scale, where shown): (Top row, L to R): 1) Microporous poly(sulfone) membrane only (white). 2) Same, coated with Au on both sides. 3) Same, now with CP (green) deposited on one side. (Middle row, L to R). 4) 9-pixel section of garment with “Type IIa” membrane, PTFE side. 5) Same, CP side. (Bottom row, L to R). 6) Further assembled garment, now with Ripstop Nylon fabric bonded on both sides. 7) Same with more refined, ribbon-cable connectors, the final, wearable garment (individual pixel at top right; cm-scale shown for clarity).

Figure 3. (Top): Schematic of apparatus used for [liquid|| membrane||liquid] studies. It emulated that used in prior studies [7-12], and so allowed for a direct comparison of our membranes’ performance with that in the prior work. (Bottom): Schematic of simple apparatus used in [vapor|| membrane||vapor] studies. Water vapor was driven from the LHS to the RHS chamber. The detector used gave a real-time reading and record of humidity and temperature every second.
Actly emulating that used by Mullet et al. [12] This yielded a very useful, direct comparison of our data with earlier, published data. The electro-osmotic flow rate, per unit area of membrane per second, was then expressed in g∙mm−2∙s−1. The studies were carried out both potentiostatically and galvanostatically. The voltages applied in the potentiostatic mode ranged from 0 V to (−)10 V. The currents applied in the galvanostatic mode were such that the current densities were very close to those reported in the studies of Mullet et al. [12], ca. 30 µA∙cm−2; the current densities observed for the potentiostatic mode were also in this region. These studies served as a very useful benchmark for comparison of our membranes with those reported in the literature.
2.5. Vapor-Vapor Interface ([Vapor||Membrane||Vapor]) Tests
As a second series of tests, [vapor||membrane||vapor] interface tests were carried out using the apparatus depicted schematically in Figure 3. These were a step up from the liquid-liquid tests and, to our knowledge (and as noted above), have never been reported before. Here, the difference in RH in the RHS (right hand side) compartment, effected upon the application of the voltage (potentiostatic mode) or current (galvanostatic mode) as a function of time, was monitored. The humidity/temperature sensor modules used, placed as depicted in Figure 3 in each compartment, were the “TAI-8540 module” manufactured by TAI Inc., and incorporating the Honeywell Model HIH-3610 humidity sensor. This module measured both humidity and temperature, with the following parameters: Humidity range 0% to 100% RH (relative humidity), accuracy +/-2% RH; temperature accuracy +/−1˚C. Digital output from the module could be directly read by a PC interfaced with USB or RJ11 connectors.
2.6. Industry-Standard Water Vapor Transport (WVT) Tests
It is noted at the outset that these tests [24-26] also of course naturally comprised [vapor||membrane||vapor] interface tests. They were carried out at external laboratories, primarily for purposes of independent corroboration. They are listed and described in detail in Section 3.4 below.
2.7. GC/MS Studies of CW Agent Simulant Permeation through Membranes
These studies were carried out at Ashwin-Ushas and MScan Laboratories (now SGS, West Chester, PA, USA) in order to continually screen the progressively improveing membrane assembly configurations for simulant permeation, to supplement the actual, agent permeation tests. The latter could only be carried out in a limited manner at a qualified facility (Battelle Columbus labs, see below) An adaptation of TOP 8-2-501 procedure was used (US Army Test and Evaluation Command, Test Operations Procedure # 8-2-501, dated 17 January 2004, “Permeation and Penetration of Air-Permeable, Semipermeable, and Impermeable Materials with Chemical Agents or Simulants” [45]. DIMP was the primary simulant tested. The sample collection procedure was nearly identical to that used at Battelle Columbus Labs for the agent tests, and is now briefly described.
A special permeation test cell (Part# PTC 600, www.astmpermeationtestcell.com) was used, with the membrane assembly under test (i.e. the sample) clamped therein and with air flow through the membrane controlled via an AirChek 2000 flow apparatus calibrated to 0.3 lpm (liters/min) using a field rotameter (all SKC Inc., www.skcinc.com). To collect the DIMP vapors a solid sorbent tube (SST) from Camsco (www.camsco.com part # T13030) charged with Chromosorb 106 (60/80 mesh, 235 mg, 15 mm bed length) was used. All connecting tubes and couplings were made of Teflon® (PTFE). 10 mg of DIMP was added to the “challenge” (i.e. exposure) side of the sample using a micropipette. The “sampling” side of the membrane was first purged with dry N2. An SST was then placed in line and air was commenced to be drawn through the system. Over a 24 h period, new SSTs were inserted at 0, 2, 6 and 16 h, with permeation samples collected corresponding to 0 - 2, 2 - 6, 6 - 16 and 16 - 24 h. Each SST was sealed in a separate enclosure after use, until the end of the experiment. The analyte (DIMP) was then extracted from the sorbent in the SSTs using chloroform containing 25 ppm DEMTMP (which was used as an internal standard). Each of the 4 extracts (0, 2, 6 and 16 h) of DIMP/chloroform were stored in sealed vials and sent for GC/MS analysis, as described below. The GC instrument used was a P-E Clarus 500 GC with autosampler, split/splitless injector and FID detector. The mass spectrometer was a P-E Turbomass Quadrupole mass spec with heated electron ionization (EI) source. The GC parameters were as follows: Column Restek RTX-1701 (30 m length); temperature programstart @ 80˚C, hold 5 min, ramp at 20˚C/min to 250˚C, hold 2.5 min, total run time 16 min; carrier gas He, 1.0 mL/min; injector temperature 270˚C; injector split flowsplitless for 0.5 min (FID), split 20 mL/min (MS), injection volume 1.0 μL. The mass spectrometer parameters were as follows: Ion mode-EI+, full scan and single ion recording, full scan range m/z 10-250, SIR ion monitored m/z 97, SIR dwell time 0.1 s, total run time 16 min, solvent delay 4 min, MS source temperature 200˚C, transfer line temperature 200˚C, electron energy 70 V, calibration gas heptacosa. The FID parameters were as follows: H2 flow 45 mL/min, air flow 450 mL/min, FID temperature 275˚C, time constant 200 ms. A Total Ion Current (TIC) chromatogram with a di-isopropyl methyl phosphonate (DIMP) standard yielded a main peak at 8.97 min, whose Electron Ionization (EI) mass spectrum matched NIST data for DIMP. Diethyl methylthiomethyl phosphonate (DEMTMP) was used as an internal standard, yielding a TIC peak at 11.51 min, confirmed through its EI mass spectrum as being DEMTMP. Using an enhancement of this method with Single Ion Recording and monitoring of the m/z 97 peak, the detection limit of the procedure was established to be 20 ppb DIMP.
2.8. Agent Permeation Tests
These were carried out at the Battelle Hazardous Materials Research Center (HMRC), part of Battelle Columbus Labs, Columbus, OH (USA), one of the few facilities in the US qualified to carry out such tests. The tests were carried out per the TOP 8-2-501 procedure [24-26] already described above with the static flow (AVLAG, Aerosol Vapor Liquid Assessment Group) method, using standard AVLAG cells. Membrane materials were tested for 24 hours using four sampling intervals at 0 - 2, 2 - 6, 6 - 16 and 16 - 24 hours (as for the simulants, described above). Bubblers filled with ethylene glycol diacetate (EGDA) were utilized to capture any HD and VX vapor permeation while Chromosorb 106 solid sorbent tubes (SSTs) were used to capture any GB vapor permeation. The SSTs were extracted with 10 mL of Chloroform. The chloroform extract and the EGDA were analyzed by gas chromatograph (GC) to quantify the agent permeation through the materials. Passive test samples were assembled into standard AVLAG test cells and loaded in the particular orientation desired (e.g. CP-coated side towards the “interior”). The membrane samples were tested using three repetitions for each agent GB, HD, and VX. All cells were leak checked prior to being agent challenged.
Two slightly differing procedures were used for the passive (no voltage applied) and active (voltage applied, + 6 VDC) tests, as follows:
Passive Tests Only: Prior to CW agent application, all samples were preconditioned at the required environmental conditions for twenty minutes. Upon completion of the preconditioning period, swatches were challenged with the required agents and reinstalled into the test fixture. After all cells were reinstalled, airflow was initiated and the trial started for the 24 hours. Values below the detection limit of 0.5 g/cm2 were reported as 0.25 g/cm2 which were used for any subsequent calculations. (This is a standard practice for manipulation of swatch permeation data.) Spike controls were utilized during the spiking process for all agent challenges. While based on only three replicates, the data were consistent within each subset of material and agent combination.
Active Tests Only: Active test samples were also assembled into standard AVLAG cells with the exception that Teflon® plates were used in place of the standard aluminum plates to isolate the voltage applied to the swatch. Each sample was oriented in the cell so that the leads attaching to the electrodes were directed toward the front of the cell. The membranes were tested using two repetitions for each agent GB, HD, and VX. All cells were leak checked prior to being agent challenged. After all cells were assembled and loaded into the test fixture, the sample leads were attached to their respective jumper cable and voltage was applied in 1 V increments, cycled through all samples until 6 V was reached. The voltage remained on for the remainder of the test. All samples were preconditioned at the required environmental conditions for twenty minutes. Upon completion of the preconditioning period, cells were challenged with the required agents and reinstalled into the test fixture.
The additional test parameters may be summarized as follows: Temperature 32˚C ± 1˚C; relative humidity (RH) 80% ± 5%; CW agent challenge: 10 mg ± 1.0 mg per swatch; air flow: static flow, constant at 0.3 lpm ± 0.01 lpm; sample area 10 cm2; solvent volume 10 mL.
2.9. Industry-Standard Environmental Durability Tests
The industry-standard tests [24-26] performed on the membranes under this category included: 1) ASTM D 2261, “Tearing Strength of Fabrics”. 2) ASTM D 5034 (Grab), “Breaking Strength of Textile Fabrics”. 3) ASTM D 3886, “Stoll Flat Abrasion Resistance”. 4) ASTM F392/F392M-11, “Standard Test Method for Flex Durability of Flexible Barrier Materials”, also called the “Gelbo Flex Test”. The first three tests were carried out at Intertek Labs, Springfield, NJ (USA). The 4th was carried out at Ashwin-Ushas using a custom test setup, as shown in Figure 4. Details of these tests are available in the open literature [24-26].2.10. Other Miscellaneous Tests
“Seaming” tests: Our final-form fabric, contains “pixels” of our membrane assemblies, of size approximately 10 cm × 10 cm. Important issues in final use are therefore whether the seams between the pixels: 1) Are impermeable to CW agents. 2) Impede WVT in any way. 3) Create any problems in flexibility and “drapability” of a full garment. Now the seams between these pixels are ca. 2 to 4 mm in width. They are hermetically sealed using an environmentally benign, highly flexible, temperaturestable, translucent, rubber-like polyurethane adhesive (Cytec Conathane EN series, available from various
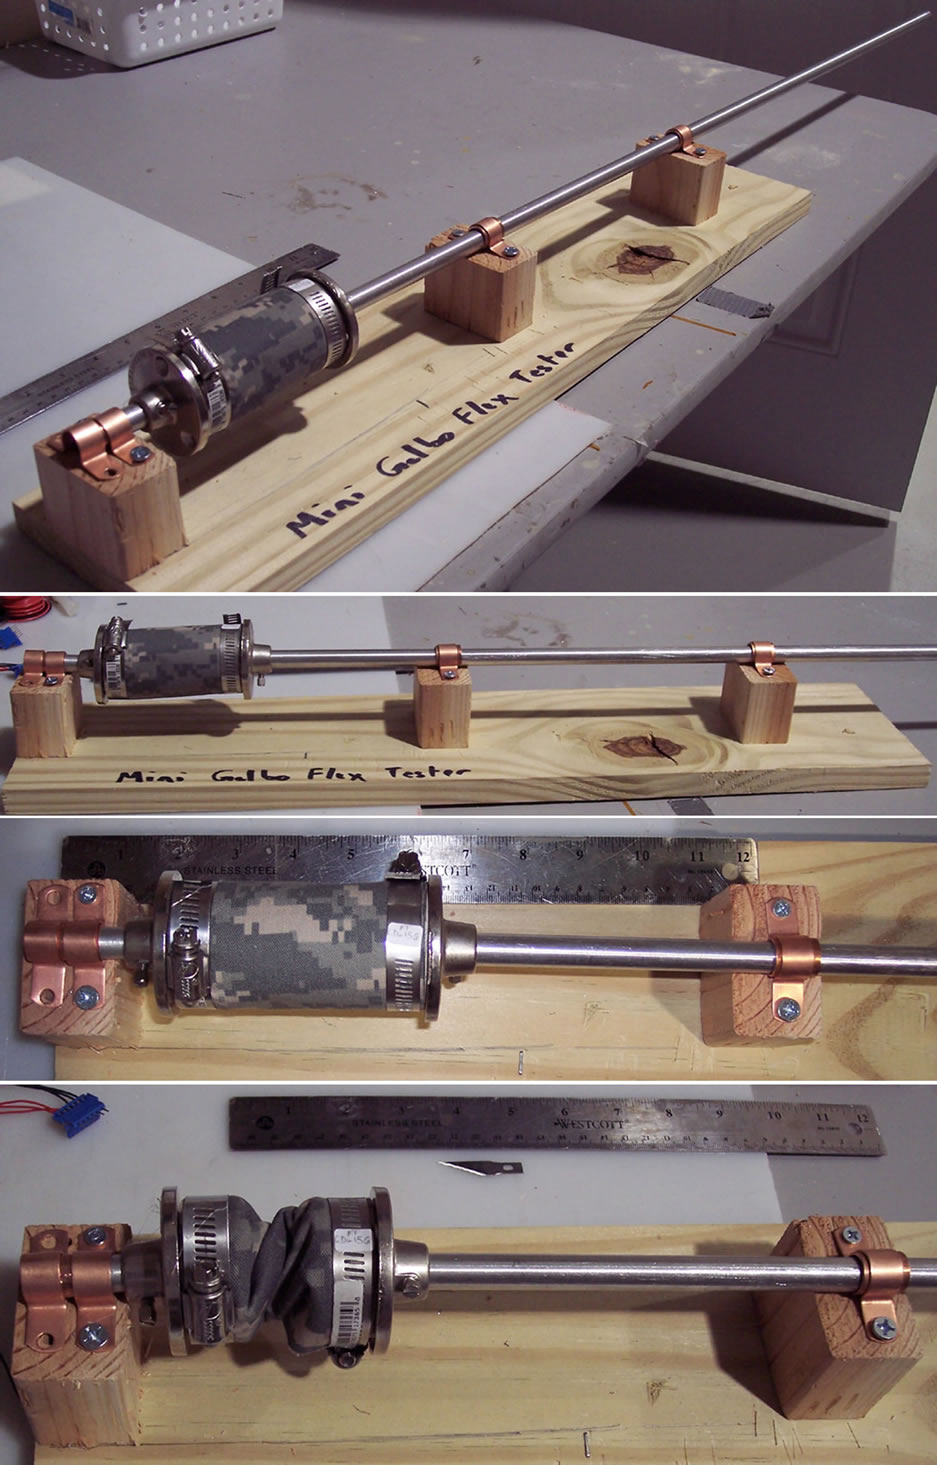
Figure 4. Custom Gelbo flex apparatus, in actual use. Various views are shown, including completely flexed with sample.
vendors, e.g. Ellsworth, at http://www.ellsworth.com) specially formulated for textiles. In order to test these seams, a series of “seaming tests” were performed on the final-form garments. The tests included WVT (ASTM E96 B, Open Cup) and DIMP permeation through the seam part of garment. They also included a physical and visual test of the drapability of the garment. As noted in the Discussion, the garments passed all these tests successfully.
3. Results and Discussions
3.1. Membrane Assembly Construction and Configuration
The fabrication of the membrane assemblies, including deposition of the conducting polymer (CP) onto the Aucoated microporous membranes, is described at length in the Experimental Section. As noted therein, these CPfunctionalized microporous membrane assemblies are very similar to those used in our prior work for completely unrelated applications, such as variable emittance skins for spacecraft thermal control, military IR camouflage, and electrochemical voltammetric sensing [27-40].
To very briefly describe membrane assembly here then, the base membrane was a microporous membrane, typically a poly(sulfone) of poresize 0.1 to 0.4 μm, with Au deposited either on one side only or on both sides. In the latter case, this resulted in a single, 2-sided, 2-electrode membrane; CP could then be deposited (electrochemically polymerized) on either side [27-32,34]. Gel electrolyte (“GelEl”) [33-35], which permeated into the micropores, also served to function as a good adhesive, holding the various membrane layers well together. A large number of membrane configurations (designated “Type IIa”, “Type IIe”, etc.) were tested. Two of these are shown in Figure 1. Shorthand notation could be used to distinguish the various configurations. Thus, e.g., Type IIa 1)), shown in Figure 1, was, ii n shorthand notation, denoted as [inside|Au|μP-PSulf|Au|GelEl||μP-PTFE|outside], where μP = microporous, PSulf = poly(sulfone), GelEl = gel electrolyte, a double bar (||) ndicates an interface between phases, and “inside” and “outside” denote, respectively, the inside of a worn garment and the exterior environment. The other membrane configurations studied included: 2) Type IIe: [inside|CP|Au|μP-PSulf|Au|GelEl|| μP-PTFE|GelEl|μP-PTFE|outside]. 3) Type IIf: [inside| CP-w-OPH|Au|μP-PSulf|Au|GelEl||μP-PTFE|Au|CP-w-OPH|outside], where “w-OPH” signifies “impregnated with organophosphate hydrolase”, OPH being an enzyme that hydrolyses organophosphates. 4) Type II: Type II ([inside||CP|Au|μP-PSulf|Au|GelEl||outside]. Membrane porosities, from 0.05 μm to as high as 5.0 μm were studied, with optimal porosities identified; e.g., for Type IIa, these were 0.01 μm (for poly(sulfone)) and 1.0 μm (for PTFE)). Additionally, a “+V”, “−V”, “+A” or “−A” at either end of the configuration indicated the application of a + or (−) voltage or current.
As shown in the color figure in Figure 1 (center), the Au and CP were not solid layers, as represented in the schematic figures, but rather, permeated into the pores of the membrane. Additionally, the GelEl, while again shown as a single, solid layer in the schematics, actually also permeated throughout all the microporous membranes. This “permeative” feature of the CP/Au/membrane interface structure [27-40] has an important bearing in understanding the electroosmotic effect therein, as discussed further below. Figure 2 shows components of the final, wearable soldier garment, in various stages of fabrication, as described.
The gel electrolyte (GelEl) [35-38] used in our membrane assemblies had a primary poly(vinyl alcohol) (PVA) base, with several other critical ingredients (see Experimental Section). The GelEl cured overnight to form a very thin, translucent, rubbery, highly flexible material [35-38]. Several features of this GelEl made it unique and vital for membrane assembly function. Firstly, it allowed permeation of water vapor, at a very high rate. This was verified with independent [vapor||GelEl||vapor] studies, as described below. Secondly, it served as the primary mechanism of blocking, as shown in the results below. Thirdly, it provided an adhesive function, prior to cure, bonding the two membrane layers on either side of it very well.
The CP used in our membrane assemblies was a copolymer of aniline and diphenyl amine with a polymeric dopant also used, surprisingly, in our earlier, unrelated, IR electrochromics and spacecraft thermal control work [27-40]. The CP was always placed on the garment “inside” or interior, (i.e. closest to the skin when worn as a garment); this ensured that the electroosmotic flow was in the correct direction (from the “inside” to the “outside”). A typical membrane configuration such as Type IIa displayed an open circuit potential (OCP), between the “outside” facing and “inside” facing electrodes, of ca. + 0.2 V to + 0.3 V (with the + polarity observed at the CP). The significance of this in relation to the mechanisms of electroosmotic WVT in our membranes is discussed in more detail further below.
Type IIa, Type IIe and Type IIf membrane assemblies (described above) comprised the primary, “workhorse” configurations used in nearly all our work and the further testing reported here. In Type IIf, the function of the layer of CP-OPH (organophosphate hydrolase) was to serve as an additional barrier to immediately intercept and neutralize or block CW agents: OPH has been established in much earlier work as capable of blocking, through binding or reaction, moieties with phosphonate groups, such as the agents targeted in the present work [41-42]. In the final analysis, Type IIa and Type IIe were found to be the best performing membranes in terms of WVT rates in combination with agent blocking.
In the active, potentiostatic (constant voltage) mode of operation, typical voltages applied across the primary membrane (i.e. the one on the “inside” side of the assembly) were in the range of 1 to 6 V DC, with a maximum voltage of 10 V tested. The polarity of the potential applied at the exterior electrode, in 2-electrode mode, was always negative (−). Now ordinarily, such extreme voltages applied on the aniline-diphenyl-amine copolymer CP used would cause irreversible degradation of the CP. This would, e.g., be the case in our variable emittance or IR electrochromic devices containing the same CP/Au/ microporous-membrane electrodes [27-40], which use ionic liquid electrolytes. However, in the case of the present electroosmotic membrane assemblies, the GelEl used had a very low conductivity, in the region of 0.005 mS/cm (to be compared with ca. 12 to 18 mS/cm for the ionic liquid electrolytes used in our variable emittance devices and even higher for the electrolyte used in our IR electrochromic devices.) Due to this poor GelEl conductivity, there was a large resistance barrier (i.e. conductivity drop) between the working and counter electrodes of the electroosmotic membranes. Thus, even with large potential differences, of up to 10 V, applied across the electrodes in these membranes, the potential actually “sensed” by the CP was much smaller. This was confirmed by a relatively simple experiment: In our IR electrochromic devices, with the use of an aqueous-based gel electrolyte with high conductivity, H2 evolution was observed at the CP electrode at about (−)1.5 V applied (in 2-electrode mode). However, H2 evolution did not occur at the CP electrode in the electroosmotic membranes until (−)15.0 V was applied, a factor of 10.
In the active, galvanostatic mode of operation, typical current densities applied across the primary membrane in our studies were in the region of ca. 8 mA∙cm−2. Even for the highest currents densities applied, the observed potential difference never exceeded ca. 2.5 V (cf. Figure 5(e)); consequently, again, no degradation of CP was observed.
3.2. [Liquid||Membrane||Liquid] Interface Studies
As noted briefly above, as a first segment of our studies, it was attempted to emulate the methodology of prior electroosmotic studies [7-12,20-23] on [liquid||membrane|| liquid] configurations, so as to directly compare our membranes’ performance with the prior, published work. For this purpose, an apparatus exactly emulating the work of Mullet et al. [12] and Bowen et al. [7-10] and Kozak and Davis [11] was used. This is depicted schematically in Figure 3. As electrolyte, an aqueous solution of 0.01 M NaCl was used, approximating that of the earlier work. A constant voltage was applied across the two electrodes depicted therein, and the resulting electroosmotic flow, was collected using the microcapillary as shown and measured using a sensitive balance. The area of the membrane at the interface, subject to electroosmotic flow, was 1215 mm2. The current densities used in our potentiostatic studies, ca. 33 to 42 μA∙mm−2, were very close to those used in the work of Mullet et al. [12] and Bowen et al. [7-10] (ca. 41 μA∙mm−2).
Several different membrane assembly configurations were tested. For quite evident reasons, the GelEl was not used in these [liquid||membrane||liquid] interface studies (among other things, slow dissolution of this into the aqueous solution used would occur). A typical configuration tested, represented using the shorthand notation described above, was [(Pt Cathode, (−)V)||CP|Au|μP-Sulf| Au||Pt Anode(+)V], where the microporous poly(sulfone) membrane (μP-PSulf) had a porosity of 0.2 μm. Voltages applied at the cathode, in 2-electrode mode, ranged from (−)1.0 to (−)9.8 V.
The electroosmotic flow rate, V, in these studies could be calculated based on the detailed mathematical treatment of Bowen [7] and Kozak and Davis [11], Smoluchowski [1-2], Henry [3] and Saville [4] as also used in the experimental studies of Bowen and Clark [10] and Mullet et al. [12], as follows:
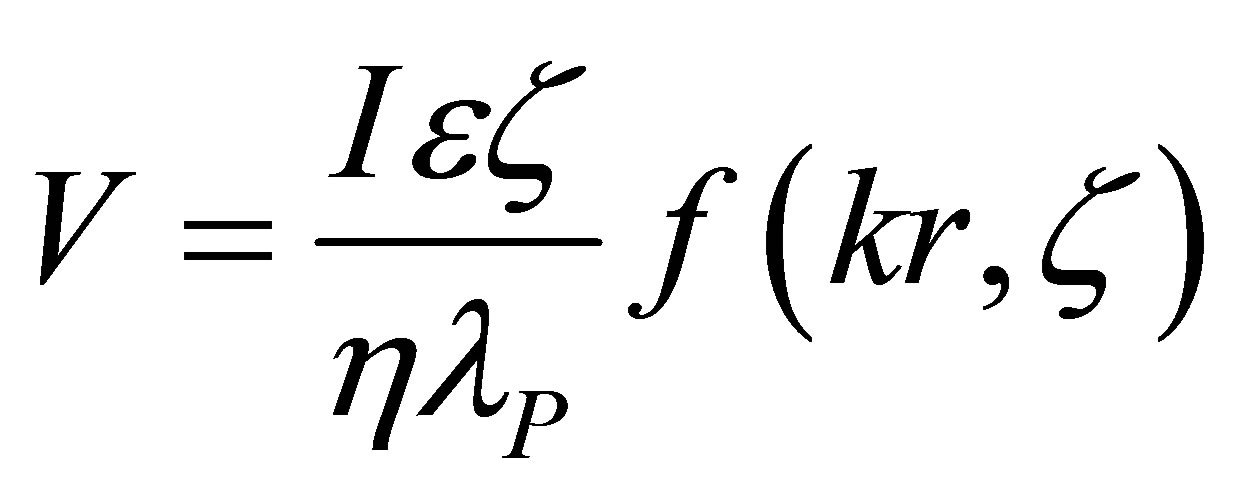 (1)
(1)
where: V—electroosmotic flow rate in volume units; I— applied current; e—electrolyte permittivity; z—zeta potential; h—electrolyte viscosity; lp—electrolyte conductivity in the pores; k—Debye radius; r—average pore radius; f(kr, z) » 1 for the conditions of all our experiments.
Now in our experiments, a volume of liquid was collected after a particular period of time and its mass, m, was measured. Also measured was I(t), the current as a function of time, at constant potential (E):
 (2)
(2)
where: m is the mass (measured in the experiment); r is the electrolyte density; t is the time.
Introducing m/A (mass of electroosmotic flow per unit area of the membrane), and since we are primarily interested in the relative flow rates for various, different membranes, we were able to compare different experiments:
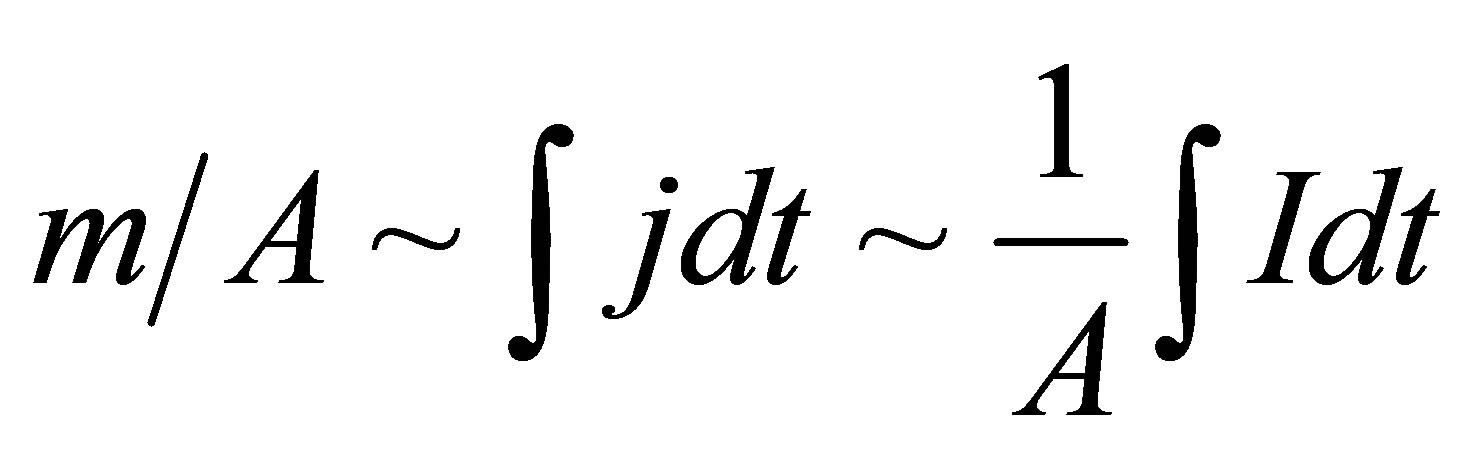 (3)
(3)
where: j is the current density.
Table 1 summarizes representative results from these [liquid||membrane||liquid] studies; it also lists typical results from the studies of Mullet et al. [12], at nearly identical current densities and electrolyte concentrations, for comparison. It is observed that the electroosmotic liquid transport values for our membranes are more than an order of magnitude higher than the highest values re- ported previously, which are those of Mullet et al. [12]. We note again that the current densities used in Mullet et al.’s and others’ prior work [7-11,20-23] were nearly identical to those in our work, all being in the region of ca. 30 μA∙mm−2, thus allowing for a truly direct comparison. It is also to be noted that our tests with the same membranes used in the prior work, e.g. the microporous alumina membranes used by Mullet et al. [12], (see Experimental Section) yielded results nearly identical to that of Mullet et al. [12] and the other prior work, further corroborating our methodology.
3.3. [Vapor||Membrane||Vapor] Interface Studies
As a further step up from prior studies, a second segment of our work studied electroosmotic WVT across [vapor|| membrane||vapor] interfaces, in both potentiostatic and galvanostatic mode. As noted above, to our knowledge this is the first such study of active (i.e. with voltage or current applied) WVT across such [vapor||membrane|| vapor] interfaces.
Figure 3, above, has shown a schematic of the dualchamber [vapor||membrane||vapor] apparatus used in our work (see Experimental Section for more detail). A reservoir of ca. 1 mL of aqueous 0.01 M NaCl was placed in the left hand side (LHS) chamber, to simulate a humid environment; this would be the type of warm, sweating, humid environment that would be expected inside clothing. The LHS then corresponded to the “inside”. Water vapor was driven from the LHS to the RHS chamber. A constant, negative voltage or current was applied at the RHS of the membrane, i.e. the one facing the RHS chamber, as indicated, and the change in relative humidity (RH) as a function of time monitored using the humidity sensors. The detectors used gave a real-time reading and record of humidity and temperature every second. (The interval could be adjusted from 0.05 s onwards, but a 1 s interval was found adequate.)
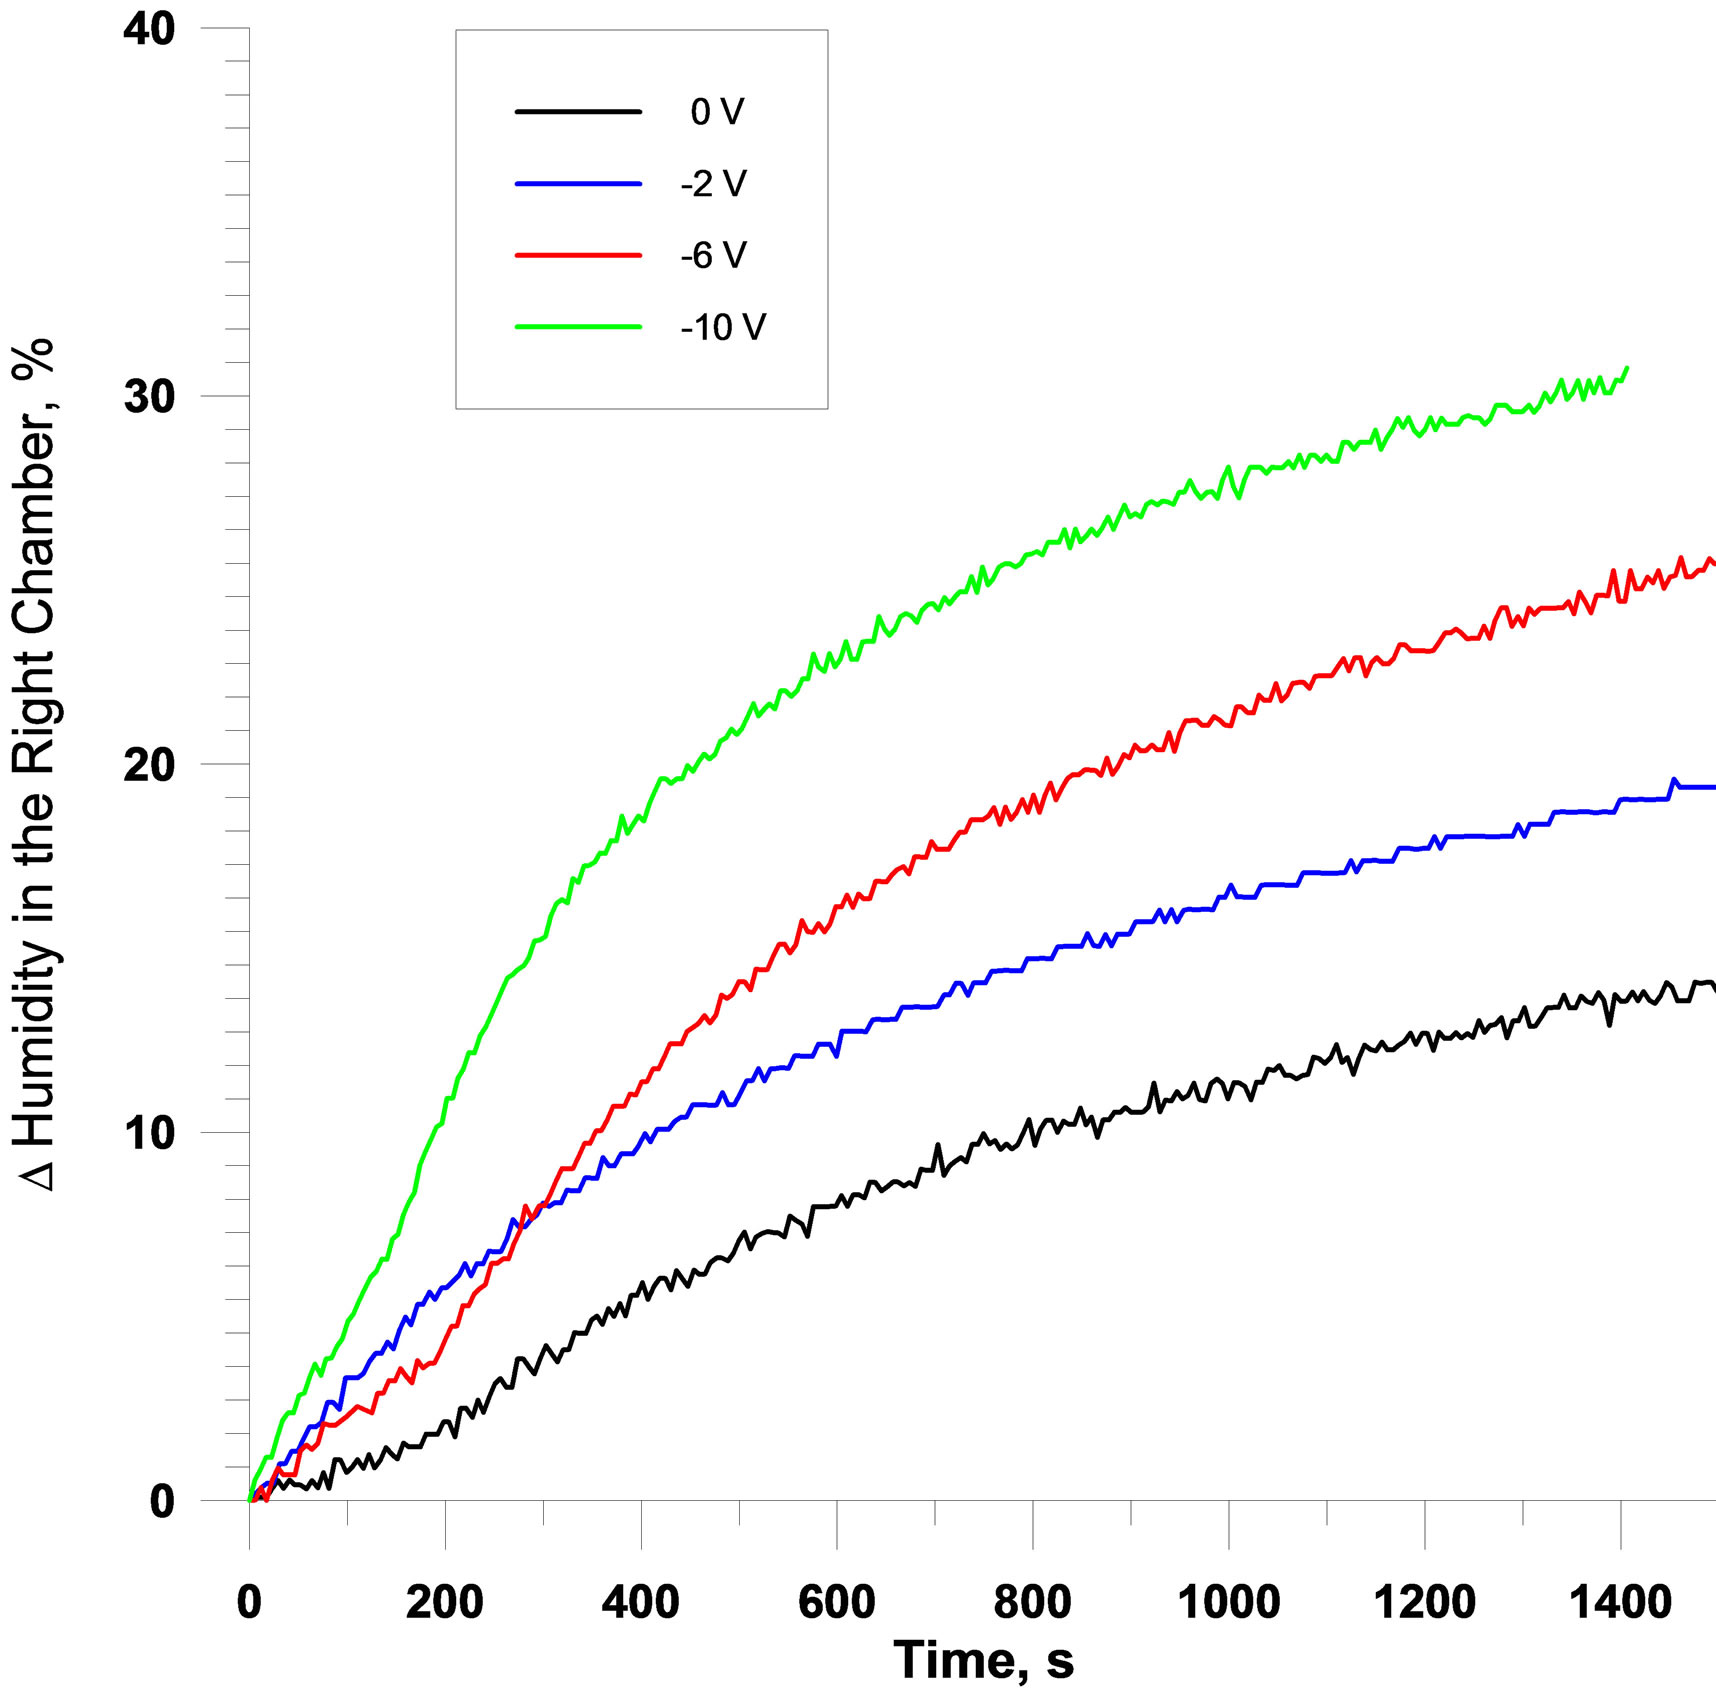
Typical potentiostatic results are summarized in the raw data in Figures 5(a)-(c). The different data therein correspond to two different membrane configurations tested, respectively: 1) [(+V)||CP|Au|μP-PSulf|Au||(−V)] (where μP-PSulf = microporous polysulfone membrane, poresize 0.2 μm); and 2) [(+V)||CP|Au|μP-PSulf|Au|CP|| (−V)]. It is to be noted that the second configuration has a layer of CP on both sides. As these data show, a very rapid increase in RH was observed in the RHS chamber, interfaced to the (−) polarity electrode, indicating a very rapid transfer of water vapor into this chamber from the LHS chamber. For example, typical changes in RH (i.e. ΔRH) for the (−) 3 V experiment (with a membrane area of ca. 12 cm2) were 28% in 240 s (i.e. 4 min), rising to 40% at 600 s (10 min). Furthermore, it was observed that, as expected, the rate of change of RH was higher for higher applied voltages. Finally, it was observed that the rate of change of RH was slower when a layer of CP was present on the exterior face as well as on the interior face of the membrane assembly. Also depicted in Figure 5 (part (c)) is a chronoamperogram, showing that the steady-state current is very small.
Importantly, it is to be noted that the 0 V data in Figure 5 correspond of course to passive WVT, analogous to that observed, e.g., in commercial Gore-Tex® PTFE membranes as reported by McCullough et al. [17,18], but at a much higher rate. That is to say, as noted briefly above, our CP membrane materials possessed an inherent, passive WVT capability which itself was much higher than that of “conventional” microporous membranes.
Typical galvanostatic results are shown in Figure 5(d), (e), with current densities indicated in the figure legend.
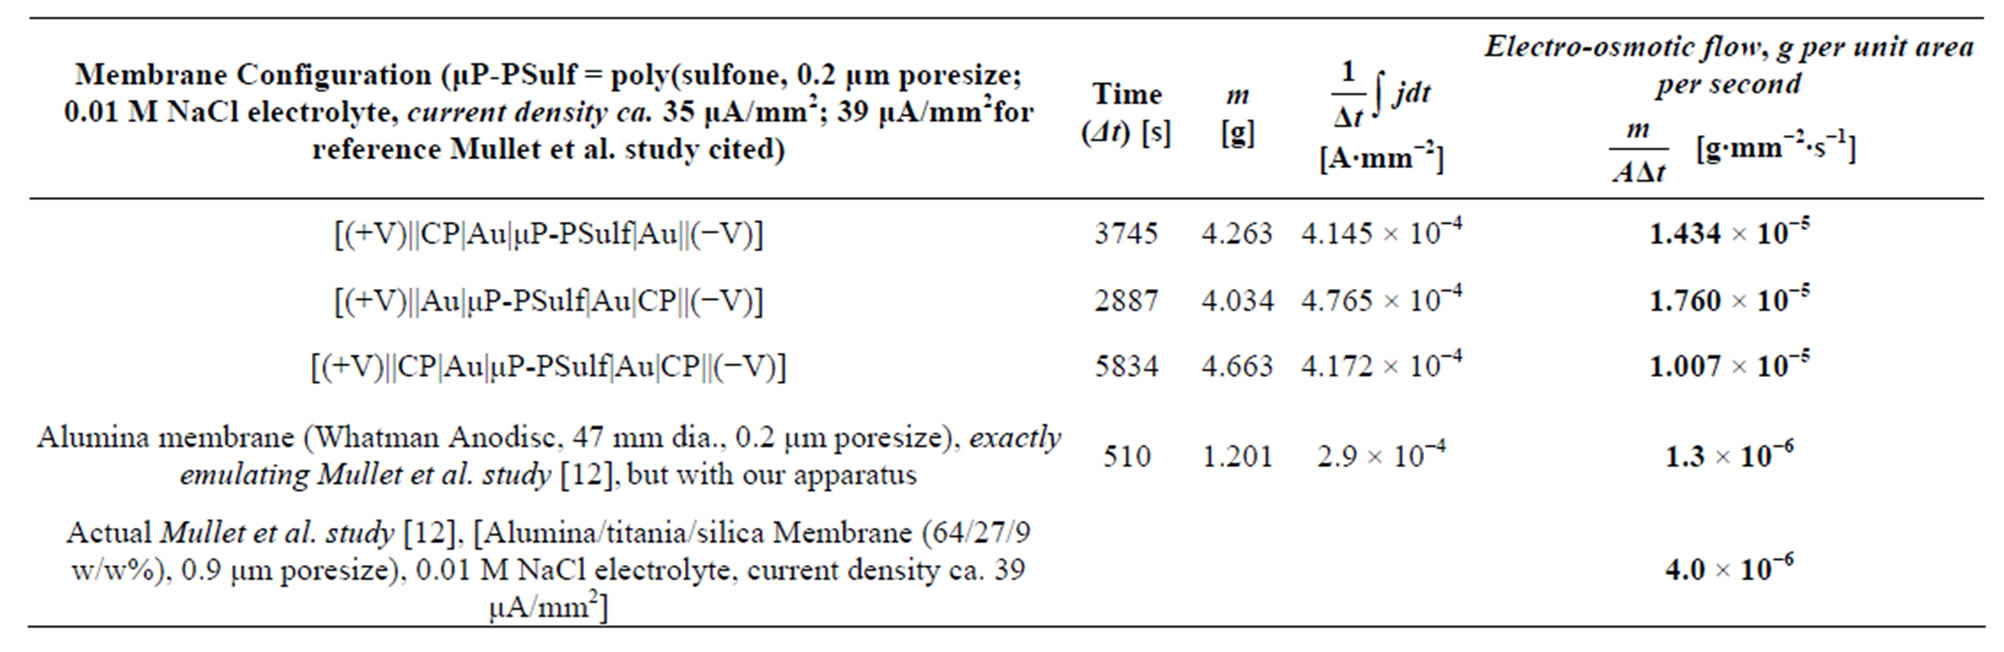
Table 1. Representative results from [liquid||membrane||liquid] studies. Also given, for comparison, are: results with alumina membranes, as used in prior work of Mullet et al. [12] and others, but using our apparatus; and the original, published results from this prior work.
Also shown therein are chronopotentiograms, i.e. the behavior of the potential during the constant current application. It is seen here that after the initial spike, the potential quickly stabilizes to a relatively small value (magnitude <2.5 V) and within a very narrow range, thereafter showing little change. These data clearly show that there is no “potential overload” observed.
In other [vapor||membrane||vapor] results which varied the concentration of the electrolyte used, it was observed that dilution of the electrolyte concentration caused progressively higher WVT rates, in line with theory and prior experiment [1-12]. For example, in an experiment analogous to that represented in Figures 5 and 6 above, at a time duration of 1000 s, the values of ΔRH observed for 0.1 M, 0.01 M and 0.001 M aqueous NaCl, were, respectively, 20.1%, 23.3% and 29.3%. These data are not shown graphically for space reasons.
The WVT rate of the GelEl alone was verified, for reference, by performing a [vapor||membrane||vapor] experiment as described above, but on a [vapor||Au|GelElimpregnated-membrane|Au||vapor] configuration, i.e. without any CP. (The membrane used was microporous poly(sulfone), poresize 0.2 μm). In a passive mode, i.e. with no voltage or current applied across the interface, the ΔRH observed was ca. 20% higher than the 0 V results shown Figure 5 above. These results confirmed that the rubbery GelEl actually acted as an efficient transporter of water vapor in the passive mode, with the driver in this case being the concentration gradient of the water vapor (and the resulting electrochemical potential difference-see discussion below) on either side of it.
3.4. [Vapor||Membrane||Vapor] Interface Studies, Cont.: Water Vapor Transport (WVT) and Related Studies Using Industry-Standard Tests
Three industry-standard WVT tests [24-26] were carried out (see detail in Experimental Section) at external laboratories (for purposes of independent corroboration). They included:
1) ASTM E96 B, Upright Cup (American Society for Testing and Materials, standard# ASTM E96, “Standard Test Methods for Water Vapor Transmission of Materials”).
2) DMPC, ASTM F2298: Dynamic Moisture Permeation Cell test (“Standard Test Methods for Water Vapor Diffusion Resistance and Air Flow Resistance of Clothing Materials Using the Dynamic Moisture Permeation Cell”).
3) SGHP, ASTM F1868 (Sweating Guard Hotplate test). This is a “skin model” test which simulates heat and mass transfer processes occurring next to human skin and produces accurate, repeatable measurements of the thermal resistance and vapor permeability of textiles.
It is important to note that the above three tests monitor different performance parameters that cannot be compared directly across the different tests, but can be compared within the tests between different materials and against certain “reference” or “standard” materials. It is thus customary in the industry to simultaneously test reference materials (standards), for which extensive published data exist [17,18]. Such reference or standard materials include Gore-Tex® XCR microporous PTFE membranes or an eVent® microporous Nylon membranes (both of poresize 0.2 μm). The first two tests above yield results in units of g∙m2∙d−1, i.e. grams of water vapor transported (WVT) per square meter of area per 24 h; however, again, since they are measuring different performance parameters, the range of numbers obtained from the two tests results is different [17-18].
A recent publication of McCullough et al. [17-18] gives a most recent and very comprehensive evaluation of the WVT properties of a very wide variety of fabrics, using a variety of WVT tests, including all three tests used in our work; in many ways, this work is used as a
 (a)
(a) (b)
(b)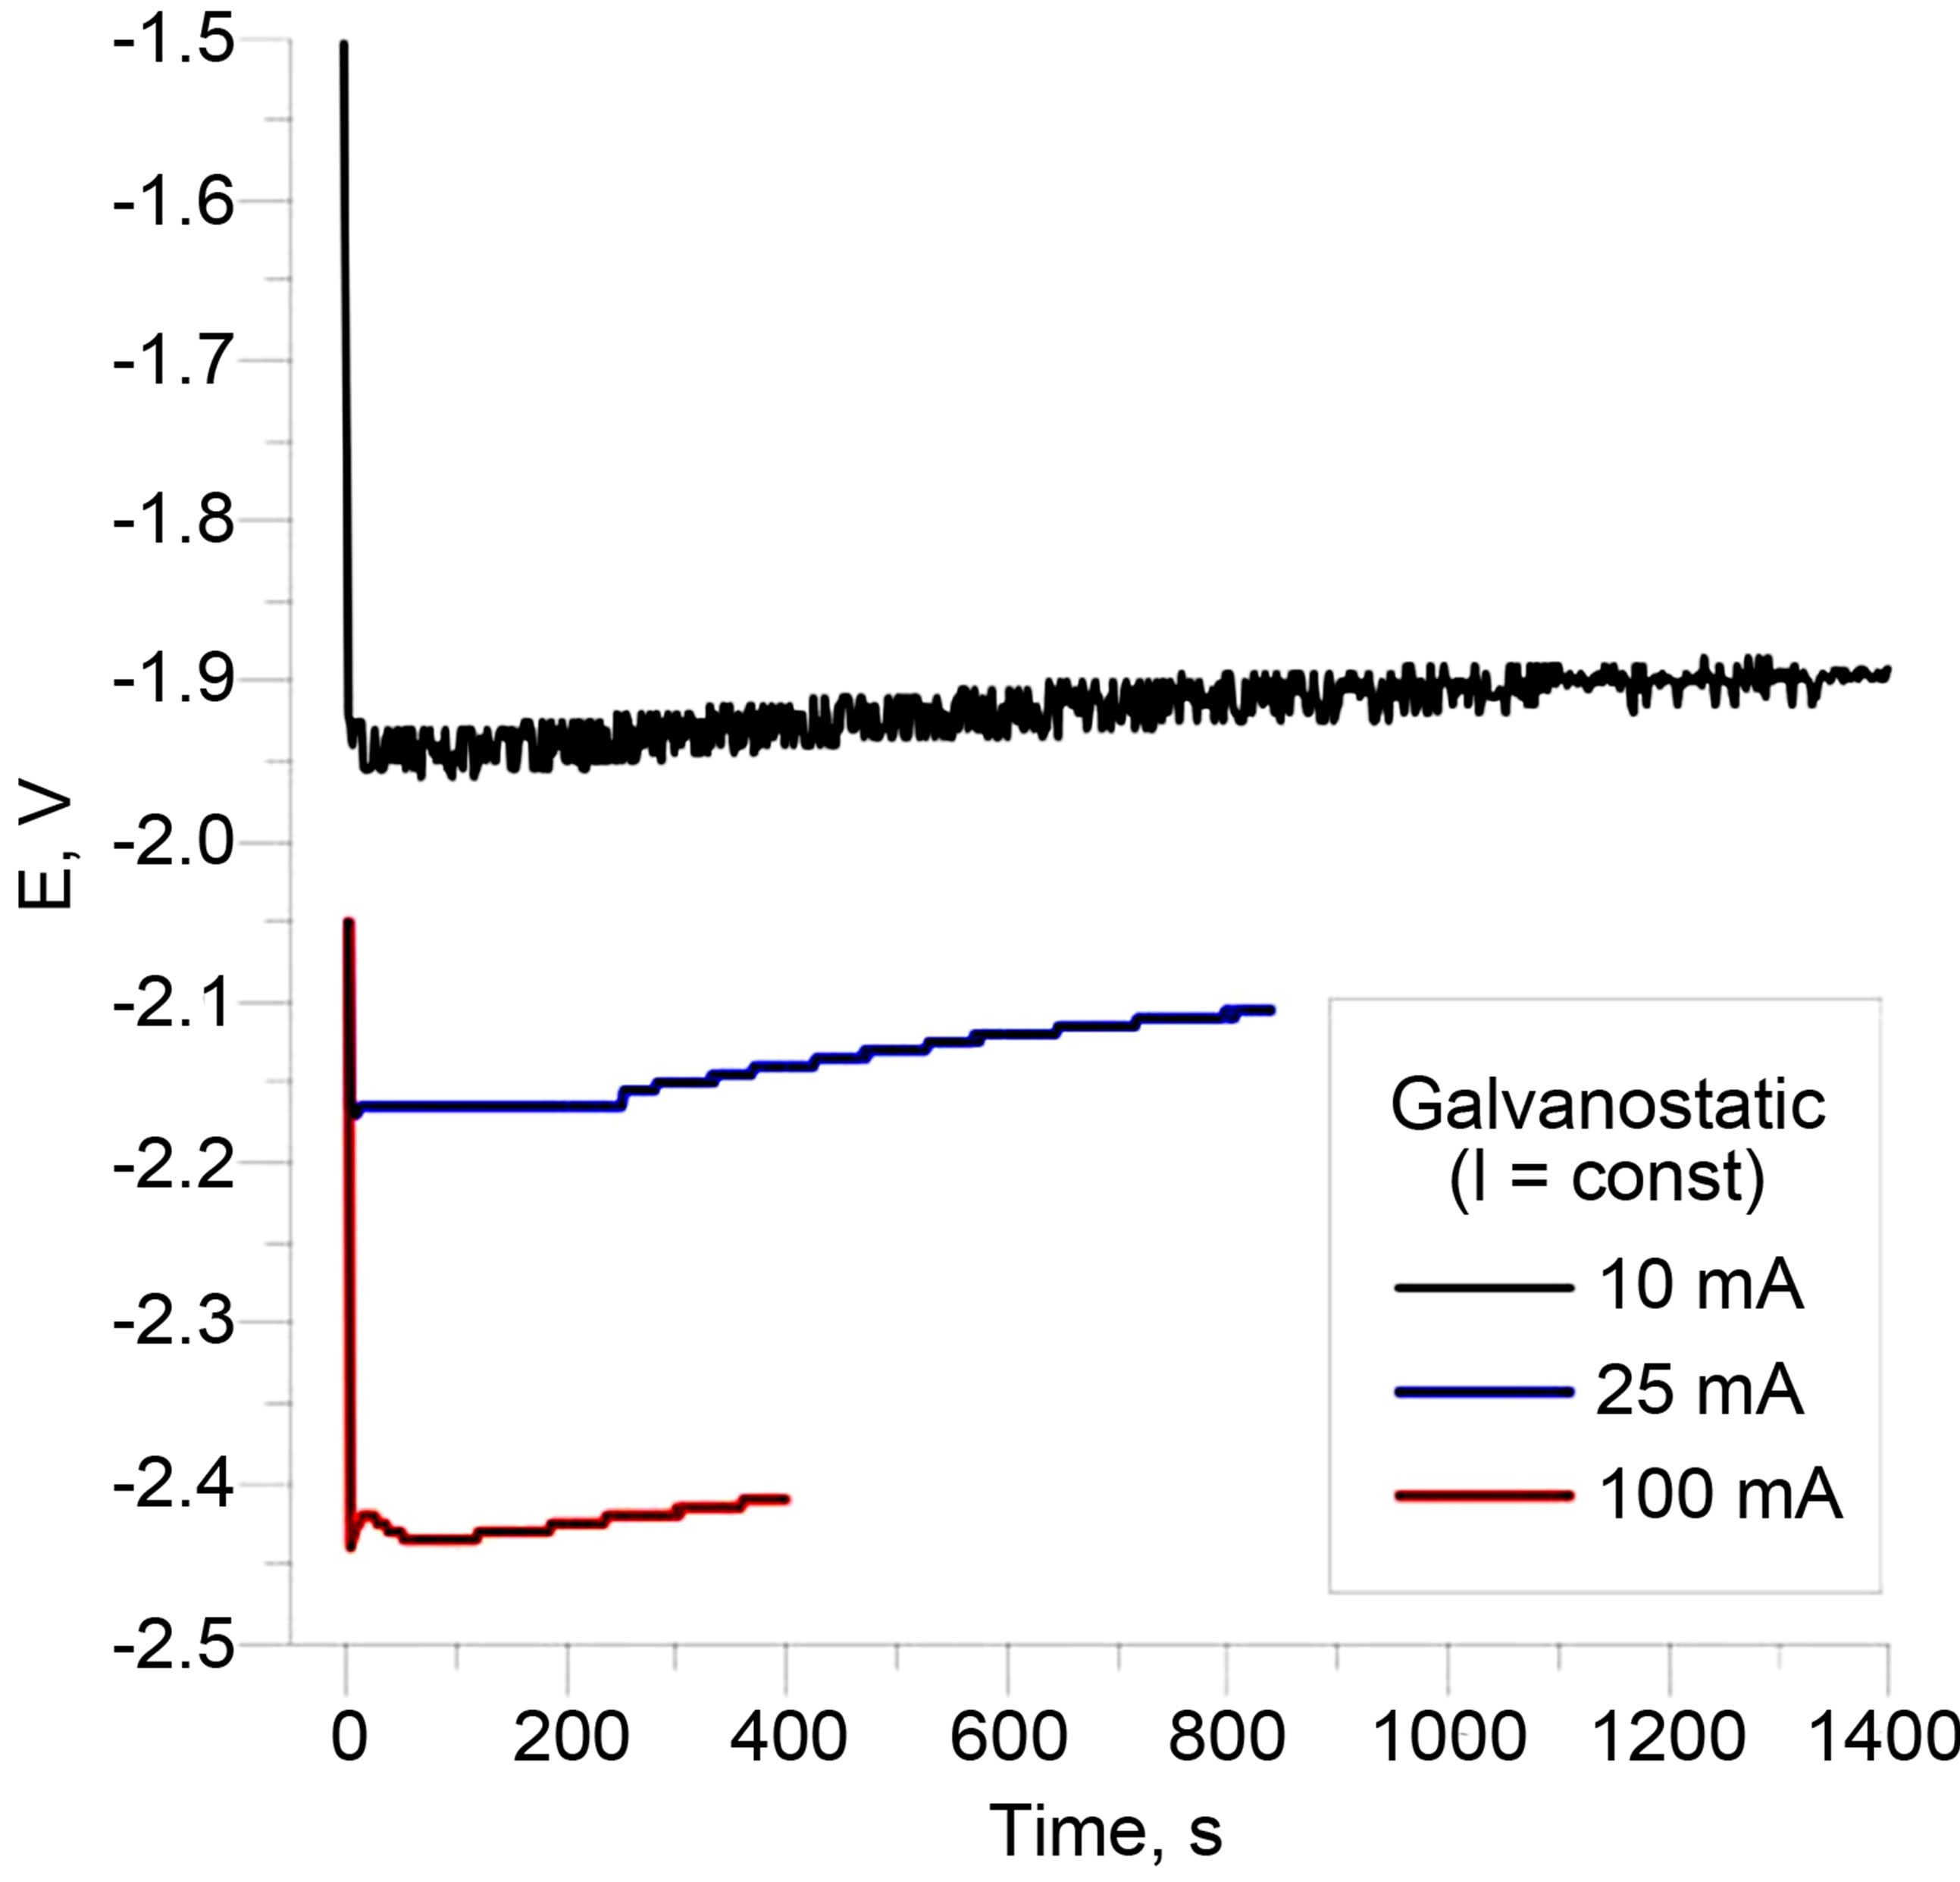 (c)
(c) (d)
(d)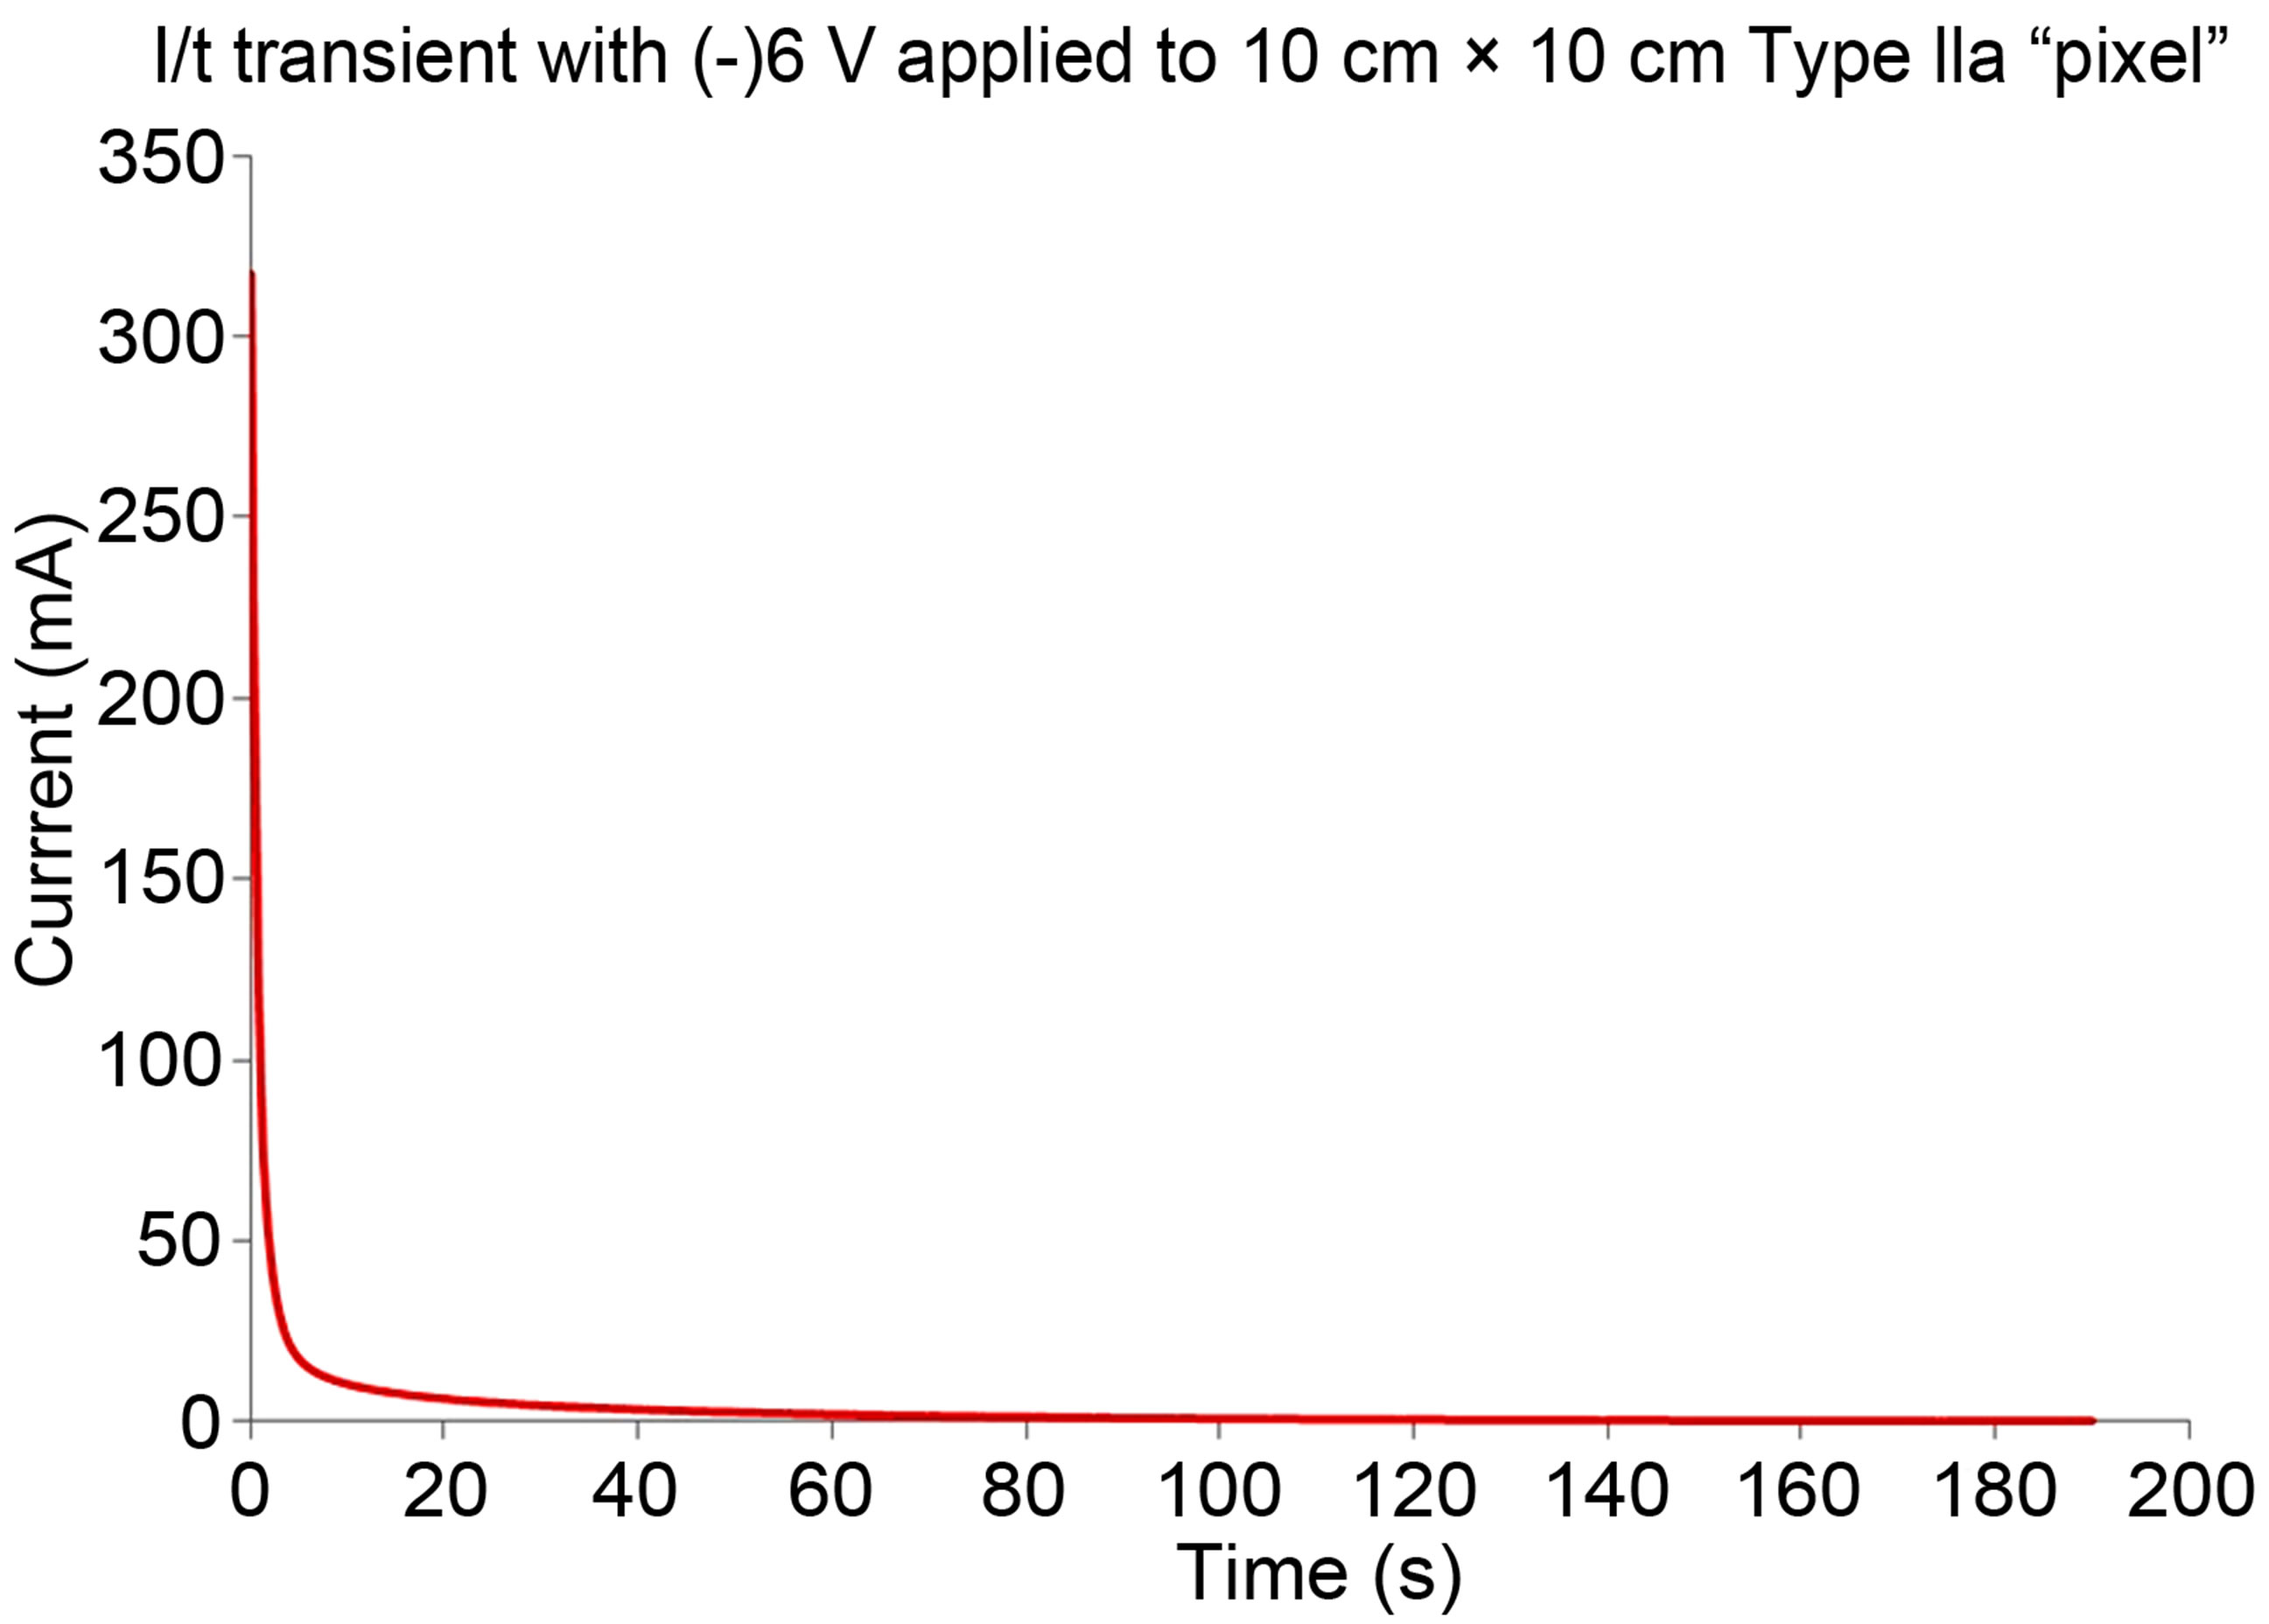 (e)
(e)
Figure 5. (a-c): Typical potentiostatic results on [vapor||membrane||vapor] interfaces. (a) For configuration [(+V)||CP|Au|μPPSulf|Au||(−V)] (where μP-PSulf = microporous polysulfone membrane, poresize 0.2 μm and “+V” indicates polarity of voltage applied, etc.); and (b) For configuration [(+V)||CP|Au|μP-PSulf|Au|CP||(−V)], which has a layer of CP on both sides. (c) Typical current-time transient for (−)6V application on a single “pixel”, showing minimal steady-state current. (d, e): Typical galvanostatic results on [vapor||membrane||vapor] interfaces: (d) For the configuration [(+A)[Au||μP-PSulf||Au|CP](−A)], at different currents as indicated, corresponding to current densities of 0.8 mA∙cm−2 (for 10 mA), 2.0 mA∙cm−2 (for 25 mA) and 8.0 mA∙cm−2 (for 100 mA). (e): Chronopotentiograms corresponding to these three experiments, which clearly show that there is no “potential overload”.
seminal reference work in the industry [13-18]. Thus, McCullough et al. [17-18] report a WVT value for the Gore-Tex® XCR microporous PTFE membrane is 864.4 g∙m2∙d−1 for the ASTM E96 B Upright Cup test, but it is 3193.3 g∙m2∙d−1 for the same membrane using the DMPC (ASTM F2298) test; these obviously quite different values are both accepted as industry standards. It is to be noted that these values are passive values, i.e. with no voltage of any kind applied. It is also very important to note that Gore-Tex, Nylon and other microporous fabrics do not of course provide any protection against agents (in contrast to our membranes, which do).
The third test (the SGHP test) yields parameters measuring the evaporative resistance, in units of m2PaW−1. One parameter, Ret, measures the total resistance to evaporative heat transfer of the material, including the surface air layer and all barriers. A second parameter, Ref, measures the resistance to evaporative heat transfer of the material alone; it generally provides a better comparison across materials of different types, and is the one used in our results presented here. A lower value of Ref indicates a higher WVT. The reference (standard) used in the industry is again that for Gore-Tex XCR®, 4.9 m2PaW−1. Table 2 summarizes the results from these three tests, for both our membranes and the industrystandard membranes.
A more extensive set of DMPC WVT measurements were carried out following the initial results (shown in
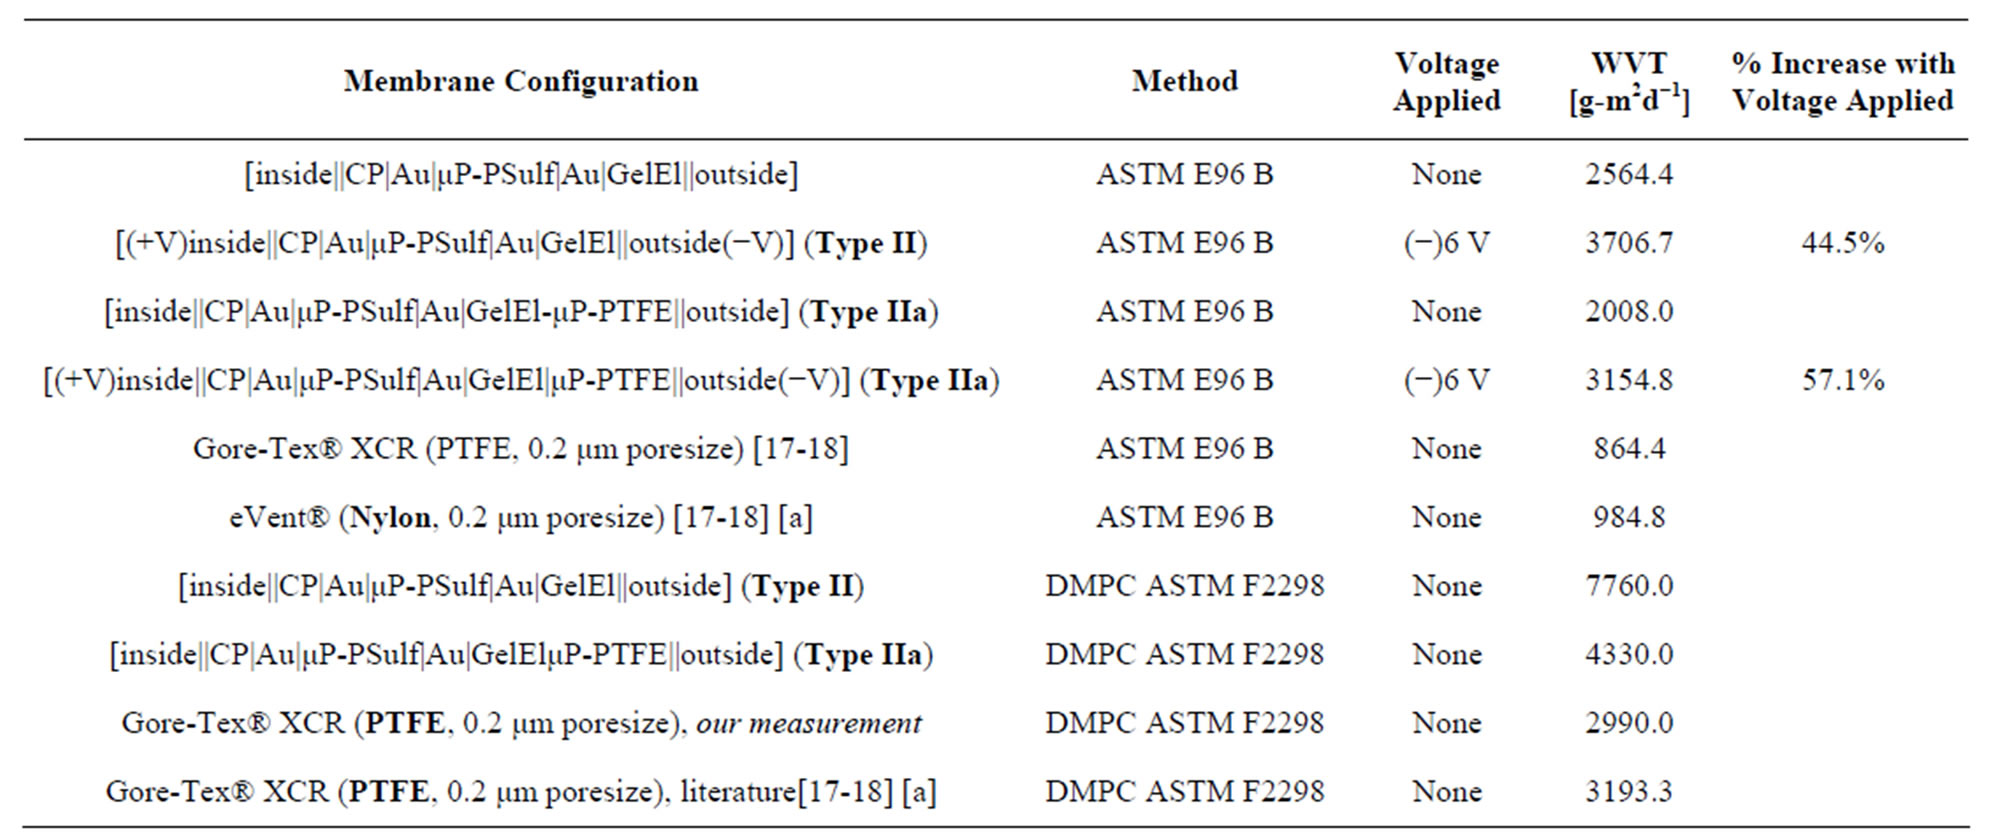
Table 2. Summary results from studies of WVT using the ASTM E96 B Upright Cup method and the Dynamic Moisture Permeation Cell (DMPC, ASTM F2298) method. ((Abbreviations: μP-PSulf = microporous poly(sulfone), poresize 0.2 μm; μP-PTFE = microporous PTFE, poresize 2.0 μm; GelEl = gel electrolyte; CP = conducting polymer).
[a] Fabric showing the highest WVT using this method in prior published data.
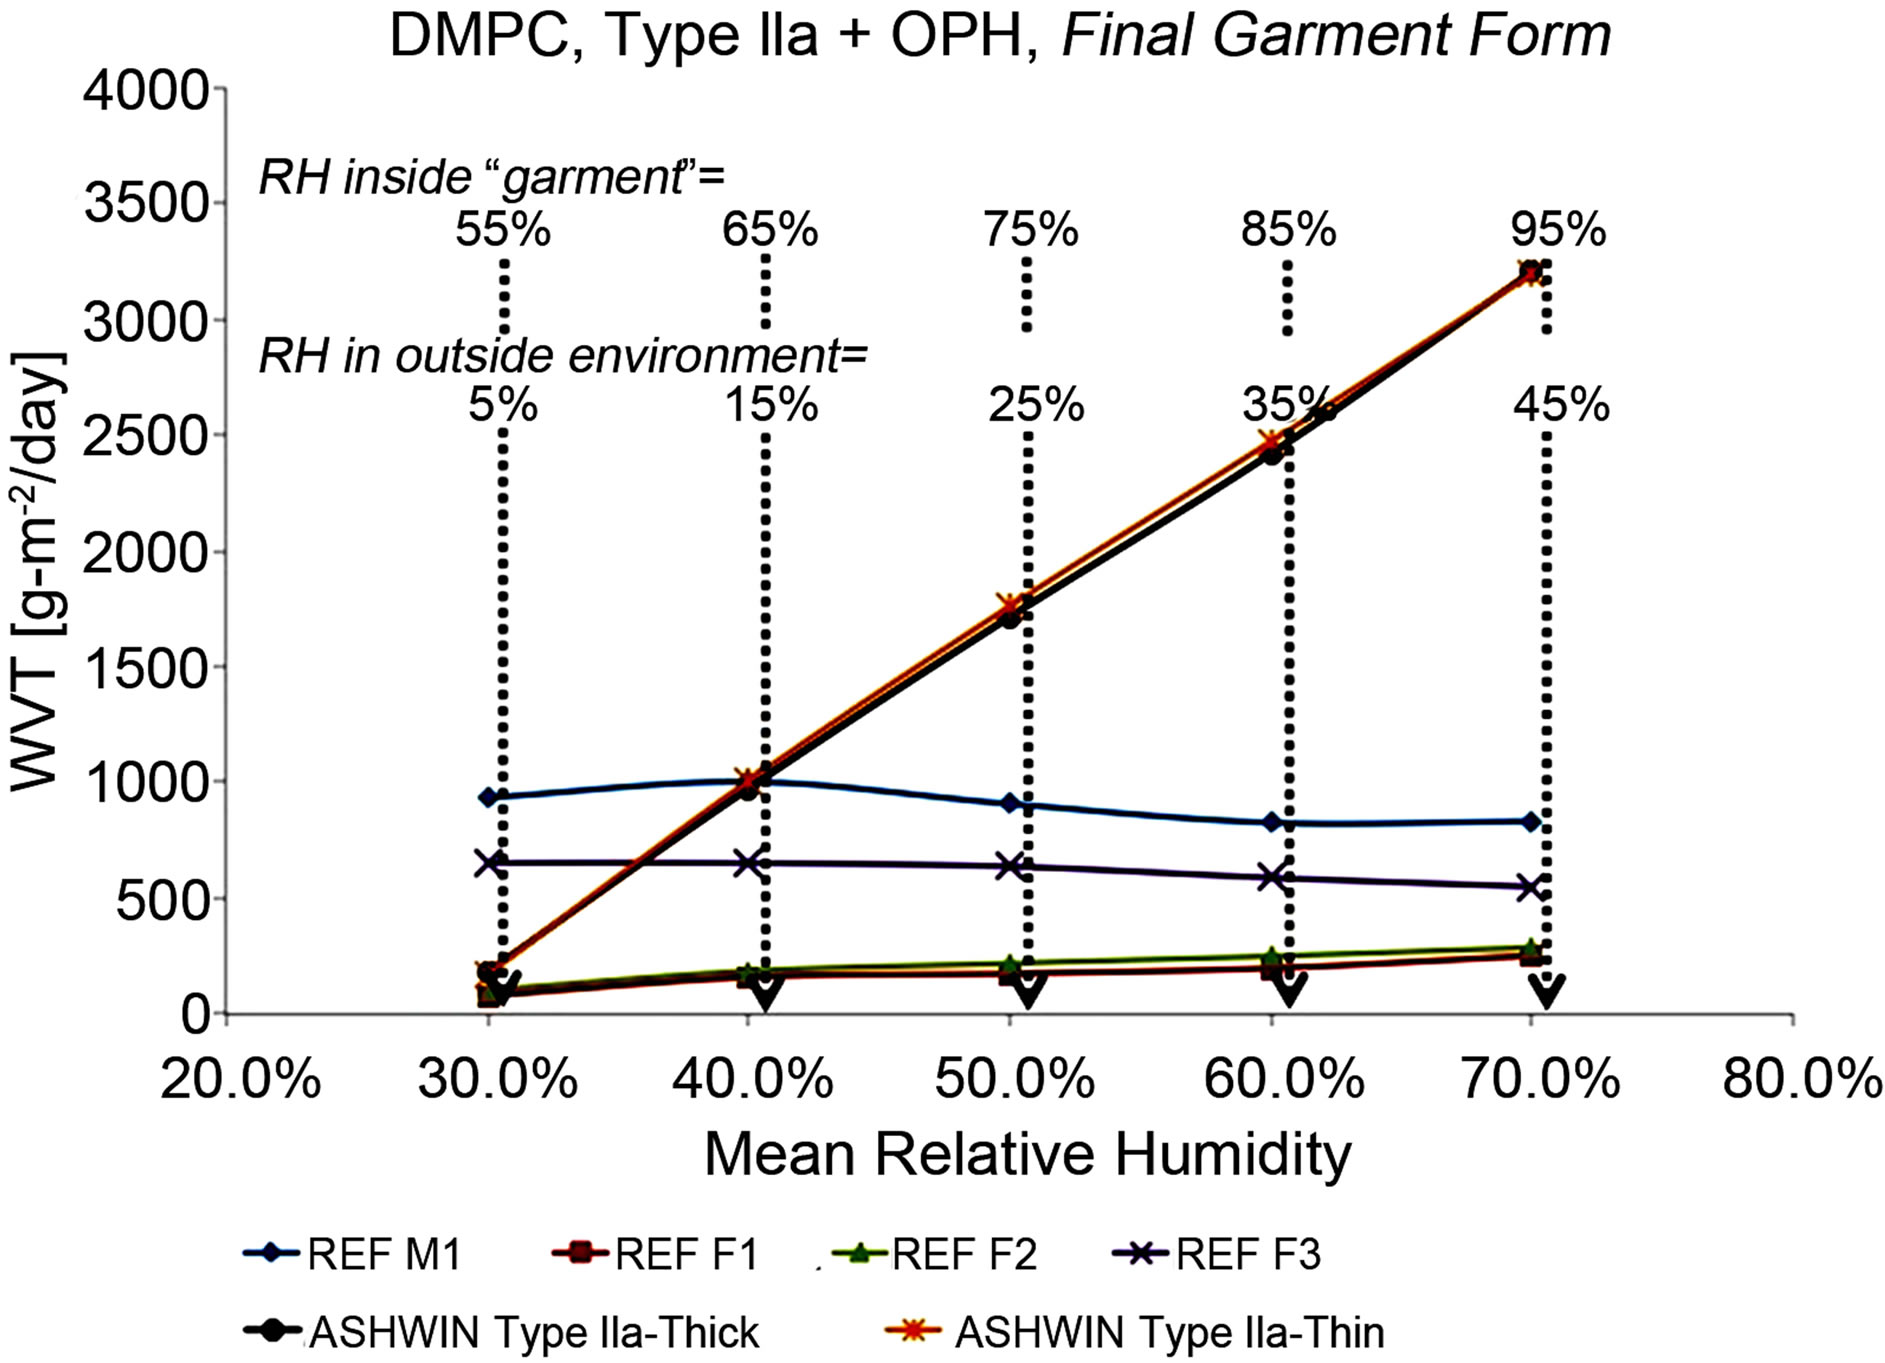
Figure 6. More extensive WVT tests using the DMPC (ASTM F2298) method. All except the references/control materials were carried out on membrane assemblies incurporated into a final, fabric material. (See text for detailed discussion of these results).
Table 2). These were done on the Type IIa membrane configuration, but with OPH (the enzyme organophosphate hydrolase [41-42], see above) incorporated into the CP; the resulting configuration was [inside||CP(OPH)|Au| μP-PSulf|Au|GelEl|μP-PTFE||outside]. Most importantly, these measurements (except for the ones on the reference materials) were performed with our membrane assembly incorporated into a final-form, wearable garment, including additional outside Nylon-Ripstop camouflage cloth and inside cloth liner (see Figure 2). These DMPC tests were done at the US Army Natick Soldier RD&E Center.
The results from these are summarized in Figure 6. A set of five measurements were done, each maintaining a difference in relative humidity (ΔRH) of 50%. In the first set, the “inside” RH was maintained at 55% whilst the “outside” was maintained at 5%, corresponding to very dry, desert conditions. In each set, the RH was progressively increased by 10% on both ends, so that the fifth said had an “inside” RH of 95% and an “outside” RH of 45%, corresponding to a sub-tropical environment. All experiments were thermostatted at 25˚C. Additionally, a number of reference materials were tested: 1) “REF M1”, an expanded microporous PTFE membrane somewhat similar to Gore-Tex® XCR. 2) “REF F2”, a 3-layer fabric with enhanced WVT. 3) “REF F1”, a microporousPTFE-membrane-based 3-layer laminate fabric. 4) “REF F3”, an additional type of microporous-PTFE-membranebased 3-layer laminate fabric.
The DMPC results in Figure 6 show, quite dramatically, that while the reference fabrics (including multilayer, multi-component fabrics with specially enhanced WVT, denoted REF F2, FEF F1 and REF F3) show a constant WVT rate with increased humidity inside the garment, our final-garment materials, incorporating our Type IIa membrane, show sharply increasing WVT with increased internal humidity; this is of course exactly what one would want to increase comfort. And of course, most importantly, in spite of expelling water vapor at a far higher rate than the reference fabrics, our materials also protect against agents, whereas the reference fabrics do not.
With regard to the ASTM F1868 (Sweating Guard Hot Plate) test, just one set of measurements were carried out, for the Type IIa membrane configuration with no voltage applied. This gave a normalized Ref value of 1.01 m2PaW−1, with a sample of Gore-Tex XCR® measured in the same batch of tests yielding a normalized Ref value of 4.9 m2PaW−1, corresponding closely to the literature value [17-18]. This indicates a WVT capacity for our Type IIa membrane configuration in passive mode (no voltage applied) and under sweating human skin conditions, of 4.9/1.01 = 485% of that of the Gore-Tex® standard, while our membrane also provides protection against CW agents which the Gore-Tex® membrane of course doesn’t.
To briefly reiterate the salient findings from the above three types of tests at independent labs then, very high WVT rates were observed for our materials. For example, in a direct comparison, the best performing prior art membrane tested (in passive mode only) by McCullough et al. [17-18], a microporous Nylon, yielded a WVT rate, using the ASTM E96 B Upright Cup method, of 984.8 g∙m2∙d−1. This may be compared with 2564.4 g∙m2∙d−1 and 3706.7 g∙m2∙d−1 for one of our membrane assemblies (for passive and active WVT, respectively), using the same ASTM method. And most importantly, of course, none of the materials studied by McCullough et al. or others [7-23] are able to block CW agents.
3.5. Permeation/Blocking Studies with Chemical Warfare (CW) Agent Simulants Using Industry-Standard Tests
For a proper frame of reference in appreciating the results on simulants, it is pertinent to comparatively view the structures of the simulants and the agents that they are models for. Figure 7 provides this, along with structures of common pesticides. The simulants studied included D(M/I/E)MP = di(methyl/isopropyl/ethyl) methyl phosphonate; DEMTMP = diethyl(methylthiomethyl) phosphonate; Cl-Eth = bis(2-Cl-ethyl amine:HCl), all shown in Figure 7, and methyl salicylate (simulant for HD) and 3-hepten-2-one (simulant for G agents). The methodology used for these studies, based on the TOP-8-2-501 standard, has been described at length in the Experimental Section. DIMP was the primary simulant studied; other simulants were studied briefly to confirm applicability of the methodology. GC-MS formed the primary method of detection and quantitation. Results for DIMP permeation are summarized in Table 3.
These results show, firstly, that the values for total permeation (cumulative, i.e. over the 24 h period) for the simulant DIMP, as measured by GC/MS using our methodology, closely correspond with those for the live agent GB, as measured at Battelle; this is true for both the passive (no voltage applied) and active (−6 V applied) modes, thus validating our methodology. Secondly, they show that the introduction of an additional layer of GelEl, as in Type IIe vs. Type IIa, drastically reduces the DIMP
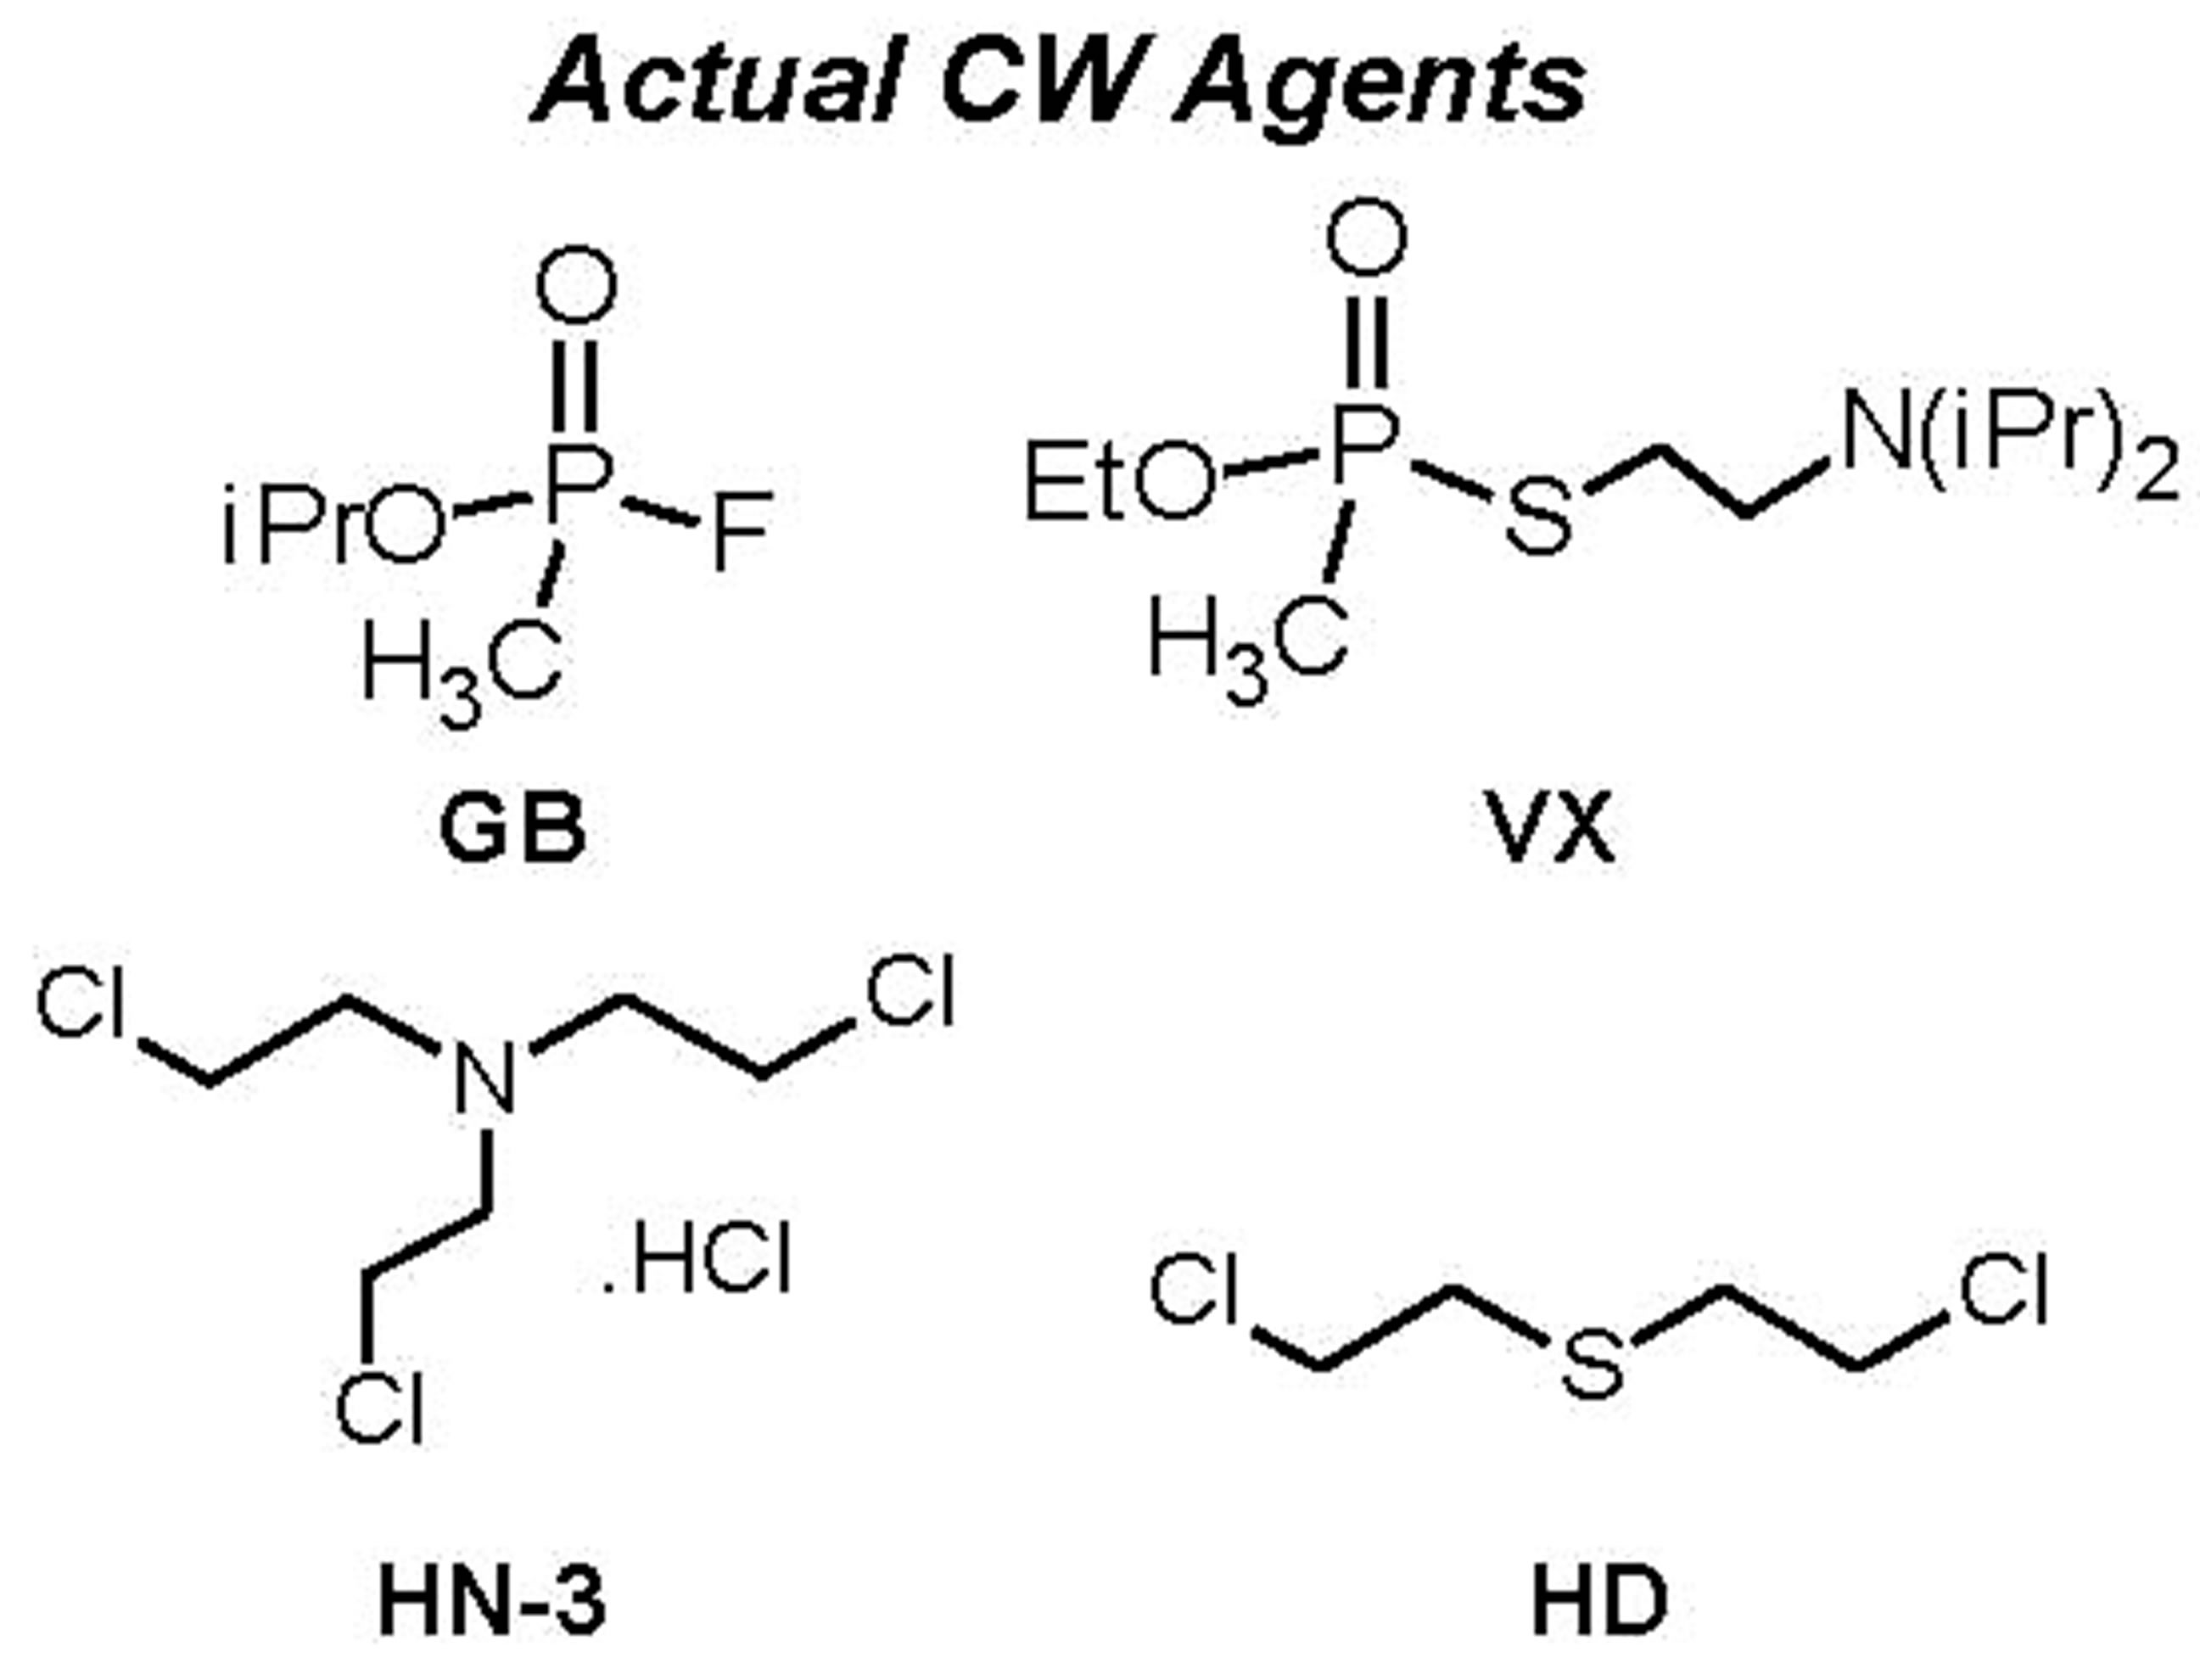
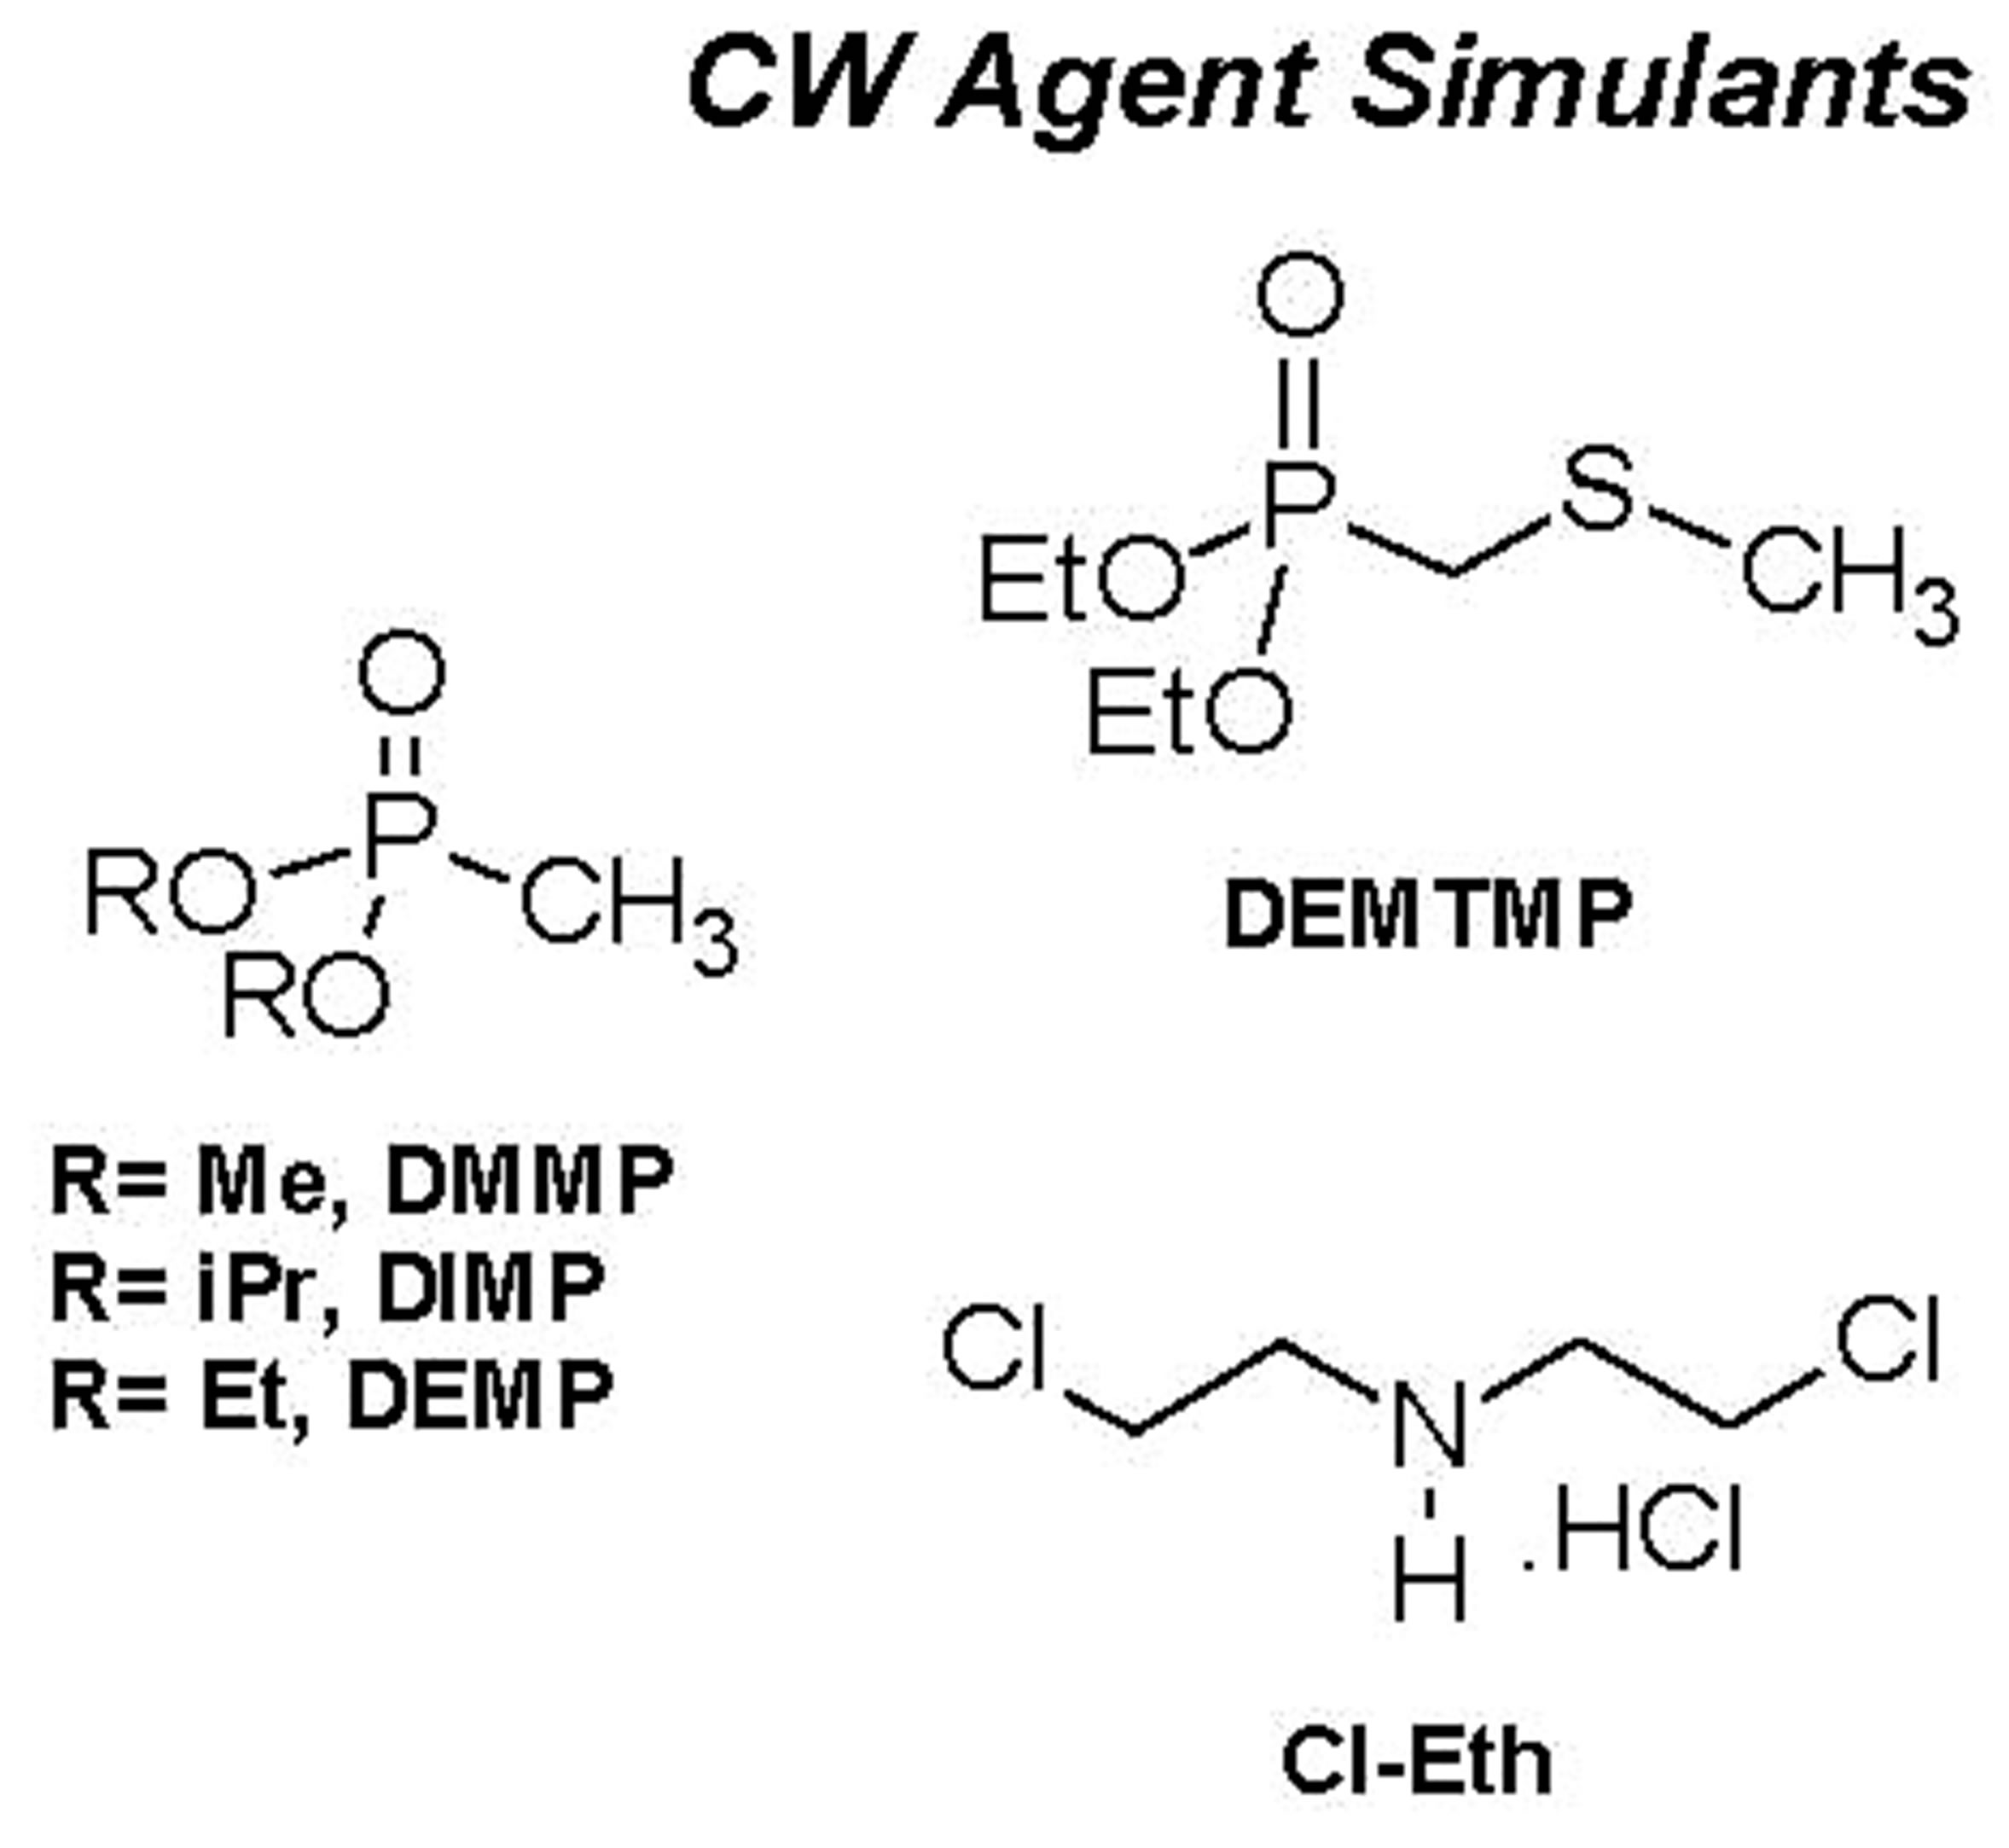

Figure 7. Structures of chemical warfare (CW) agents and simulants/models for these. Also shown, for info only, are structures of common pesticides; the stark similarity of their structures with those of the other categories is evident. (Abbreviations for simulants: D(M/I/E)MP = di(methyl/isopropyl/ethyl) methyl phosphonate; DEMTMP = diethyl(methylthiomethyl) phosphonate; Cl-Eth= bis(2-Cl-ethyl amine: HCl); Mal = Malathion, a common commercial pesticide).
permeation (total permeation drops from 236.23 μg/cm2 to 54.04 μg/cm2). Thirdly, they show that, for Type IIf, i.e. membranes with the enzyme OPH impregnated into the CP, there is a very drastic reduction in the DIMP permeation when a voltage is applied (7.90 μg/cm2) as compared to when no voltage is applied (79.8 μg/cm2), indicating electrochemical activation of the OPH enzyme, as observed by others as well [41-42].
Results for permeation of other simulants were very similar to those for DIMP above and are not given in detail for space reasons. However, we mention that particularly noteworthy was the nearly complete blockage of Malathion (a commercially available pesticide that is a model for the CW agent GB), when present at any con-
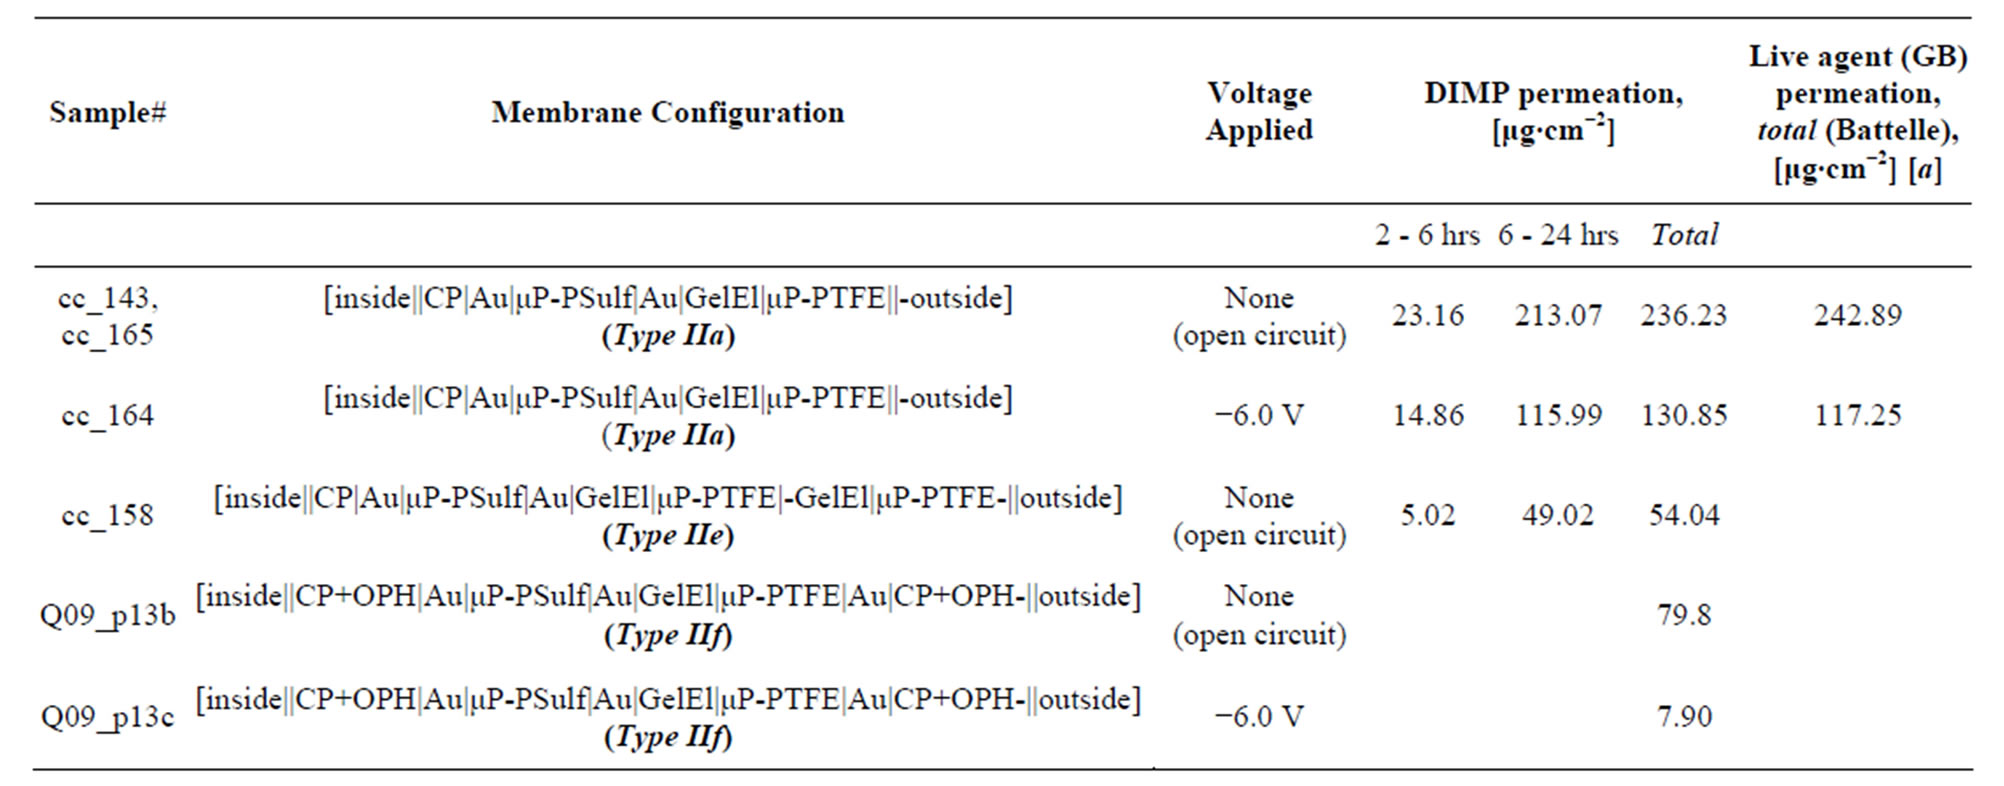
Table 3. Representative results from studies of DIMP permeation, using the GC/MS method described above, for several membrane configurations, as indicated.
[a] As measured at Battelle.
centration above 0.065 mg∙cm−2, in Type IIf membranes; this concentration may be compared with the US Army AEGL-2 (Acute Exposure Guideline Level-2, “disabling”) criterion for GB of 1 mg∙cm−2. (It may be recalled that in Type IIf, the CP is impregnated with the enzyme OPH [41-42]).
It is also to be noted that, as per prior published data on gas permeation through microporous PTFE membranes [13-18] and as expected, unmodified microporous PTFE membranes (GoreTex®, poresize 0.45 μm), were found to be extremely permeable to DIMP in our studies, with permeability within the first 2 hours of tests being about 10× that of the membranes listed in the above table. That is to say, the “plain” microporous membranes would provide no protection whatsoever against agents, as expected.
3.6. Permeation/Blocking Studies with Agents
The methodology for these studies is described at length in the Experimental Section. The structures of the agents tested, known by their military appellations (GB, HD, VX), are shown in Figure 7, where they may also be compared with their corresponding simulants/models. Representative results are given in Table 4. This table also gives, for reference, values of the US Army guidelines for exposure, known as the Acute Exposure Guideline Levels (AEGL), of which AEGL-1, AEGL-2 and AEGL-3 represent, respectively, the “non-disabling”, “disabling” and “lethal” exposure limits.
It is seen from these results (Table 4) that our membranes effectively block agents. GB is the most volatile of the three agents tested; for this agent only, some permeation is seen in Type II membranes. In later work, this permeation was effectively blocked through modification of this membrane configuration, in the Type IIe and Type IIf configurations; these introduced an additional membrane/GelEl layer on the exterior that effectively blocked GB. This was seen in tests with the simulant DIMP (see above) with these modified membrane configurations; tests with live GB agent for these new configurations (Type IIe, Type IIf) are planned for early 2014. More interestingly, the membranes exhibited very slightly poorer blocking in active mode (i.e. with voltage applied) as compared to passive mode. It is proposed that the redox of the CP that occurs on application of voltage may cause a physical change in the conformation of the CP chain and thus a small expansion of the poresize, facilitating increased CW agent permeation. This is also in line with the increased water vapor permeation seen in the active mode as compared to the passive mode (results above). (The structure of the CP/Au/membrane interface, as described above, is again noted in this respect: Rather than clearly defined, solid layers, the Au and the CP actually permeate well into the fibers of the microporous membrane).
3.7. Environmental Durability and Related Studies Using Industry-Standard Tests
The industry-standard tests [24-26] performed on the membrane assemblies under this category included: 1) ASTM D 2261, “Tearing Strength of Fabrics”. 2) ASTM D 5034 (Grab), “Breaking Strength of Textile Fabrics”. 3) ASTM D 3886, “Stoll Flat Abrasion Resistance”. 4) ASTM F392/F392M-11, “Standard Test Method for Flex Durability of Flexible Barrier Materials”, also called the “Gelbo Flex Test”.Results of these tests are given here in summary form in Table 3 above. They may also be briefly summarized
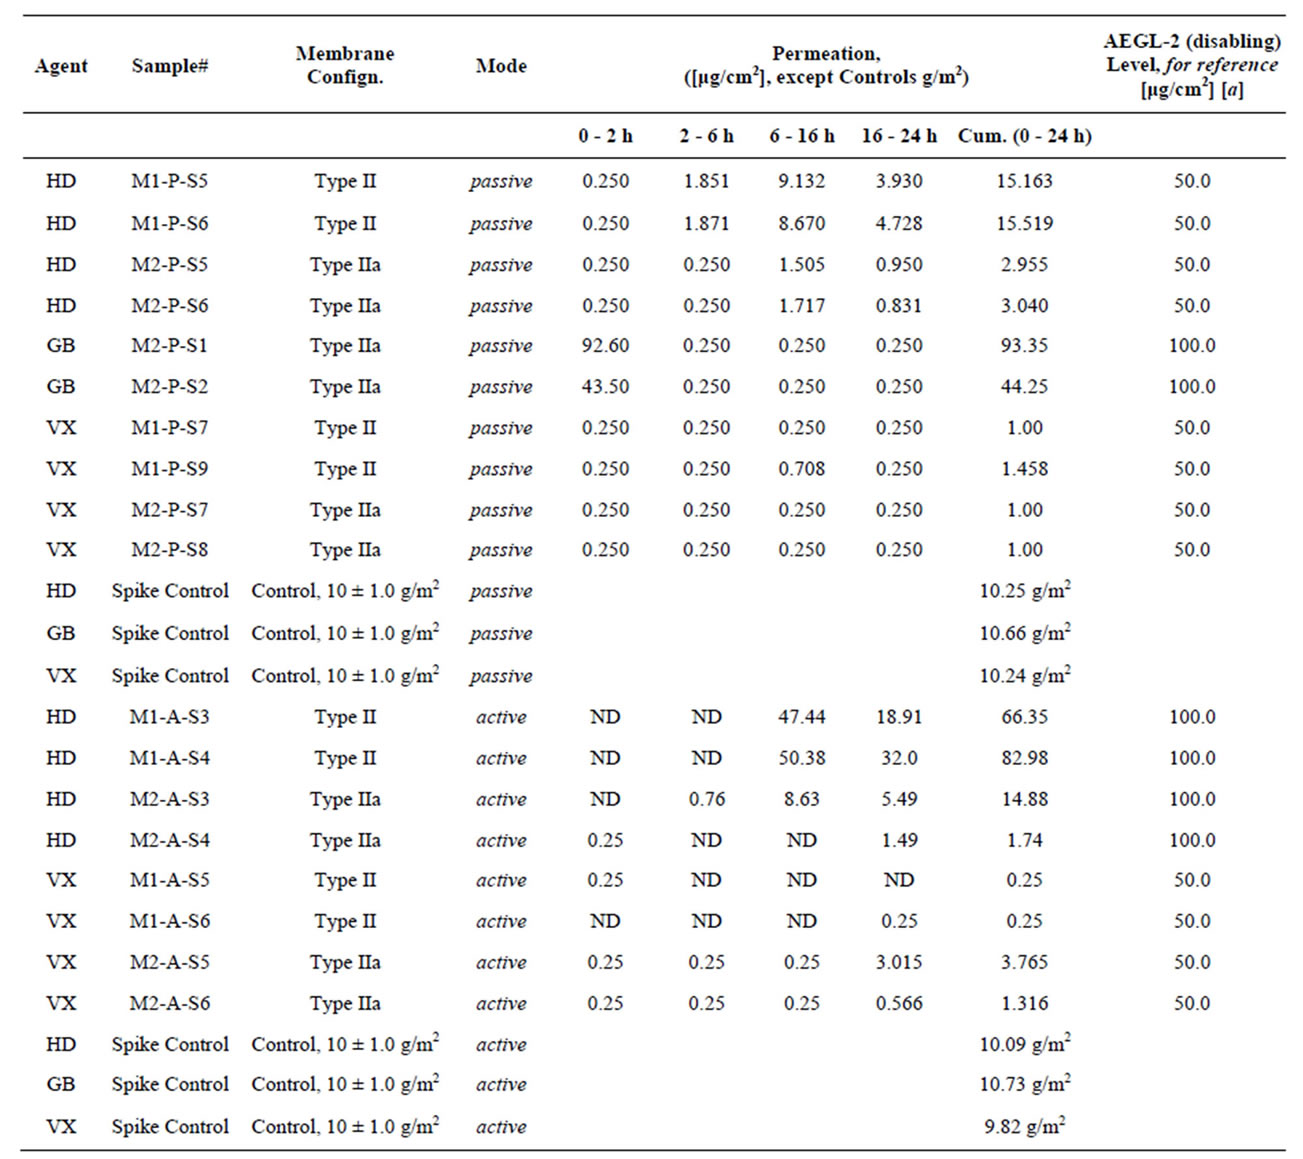
Table 4. Agent permeation results, in passive (no voltage applied) and active (−6 VDC applied) modes. The membrane configurations tested were, as indicated, Type IIa ([inside||CP|Au|μP-PSulf|Au|GelEl|μP-PTFE||outside]) and Type II ([inside||CP|Au|μP-PSulf|Au|GelEl||outside]. (ND = not detected; h = hours.) A value of 0.250 μg/cm2 essentially indicates ND, since that was the detection limit of the instrument.
[a] US army acute exposure guideline levels (AEGL). AEGL-1: Non-disabling; AEGL-2: Disabling; AEGL-3: Lethal.
here: 1) Test: ASTM D 2261, “Tearing Strength of Fabrics”. Result, Type IIa membrane: 0.067 lb-f/N. Reference results: 1 to 2 lb-f/N for typical microporous fabrics such as GoreTex®. 2) Test: ASTM D 5034 (Grab), “Breaking Strength of Textile Fabrics”. Result, Type IIa membrane: 16.4 lb-f. Reference results: 10 to 15 lb-f for typical microporous fabrics such as GoreTex®. 3) Test: ASTM D 3886, “Stoll Flat Abrasion Resistance”. Result, Type IIa membrane: No noticeable wear at 1000 cycles. Reference results: Some wear is observed at about 500 cycles for typical microporous fabrics such as GoreTex®. 4) Test: ASTM F392/F392M-11, “Standard Test Method for Flex Durability of Flexible Barrier Materials”, also called the “Gelbo Flex Test”. For this test, the specimen fabric (15 cm × 9.5 cm) was subjected to flexing, which consisted of a twisting motion followed by a horizontal motion, undergoing a maximum of 180 degree of twist (see photos of apparatus and actual tests in Figure 4). The sample was flexed for 20 cycles at 15 cpm. WVT (ASTM E 96 B) and DIMP permeation were monitored (GC/MS method outlined above), before and after the flexing. The deterioration in WVT was observed to be 12%. The increase in DIMP permeation was not observable (DIMP permeation of preand post-Gelbo flex test samples were both below the detection limit of the method used).
3.8. Practical Aspects of Field Use of Final Garment, Including Power Requirements
From the data above, voltage and power requirements may be arrived at for garment use in the field. Our results indicate that a potentiostatic mode of operation (with (−)6 V as the standard voltage applied) is the preferred mode in practical field applications; among other things, it is much easier to apply a constant potential than a constant current from a power source such as a Li ion battery. In this respect, it is also noted that, as indicated by the chronoamperogram in Figure 5(c), after an initial current spike, the current plateaus to a steady state that is well below the initial spike value. In the field studies currently underway, a “current-limiting” function has been built into the smart Controller used to coordinate application of voltage to the garment. This cuts off the power (i.e. the membrane is brought to open circuit) if the current density exceeds a pre-designated maximum. Another feature of the Controller is input from humidity and temperature sensors both on the inside and the outside of the garment. On the basis of these inputs, the Controller’s control algorithm decides whether to shut off the voltage being applied; the humidity on the internal side of the garment is the main determinant of this decision. The overall product is thus a “smart” garment requiring little user input. (The Controller is the subject of a separate patent application in preparation.)
With a view to such practical field use, current-limiting studies were carried out in a laboratory setting. In a typical such study, a current-limiting DC power supply was used and set at a maximum current output of 50 mA @ (−)6.0 V applied, for a freshly fabricated membrane assembly test sample of dimension 10 cm × 10 cm; this yielded a maximum possible current density of 0.5 mA∙cm−2 or 5 A∙m−2. The test sample was allowed to sit in the lab, in ambient air, for ca. 20 h. It was then hooked up to the current-limiting power supply and the (−)6.0 V applied to it. The chronoamperogram observed showed a maximum current (spike) of 1.6 mA at 1.0 s, which rapidly decayed to <0.5 mA @ 120 s, subsequently maintaining this steady-state level over the 1 h tested. This steady-state current computes to a current density of 0.005 mA∙cm−2 or 0.05 A∙m−2, and the power computes to 0.3 W∙m−2 (6 V × 0.05 A∙m−2). On repeat of this procedure several times, it was observed that the “spike” in the initial current essentially disappeared, yielding only the steady state current, which in turn then fell to ca. half its original value, i.e. ca 0.25 mA. Several such experiments confirmed that freshly fabricated membrane assemblies would need only an initial such “break-in”, on initial voltage application, and would then stabilize to a very low power consumption value, 0.15 W∙m−2 or less.
The above data combined with the extensive [vapor|| membrane||vapor] data presented earlier (including both the lab experiments and the industry-standard tests) allow for the estimation of power requirements (from the voltages applied and current densities measured). These lie in the region of 0.05 W∙m−2 to 0.50 W∙m−2 (i.e. per square meter). To start with, these are extremely low power consumption values. More significantly, these are for constant, continuous application of a voltage (or current) to the membrane garment. Now in actual use with the smart Controller described above, a voltage (or current) would not be continuously applied to the garment. Rather, the Controller would monitor the humidity on the inside of the garment with a sensor and turn the garment “ON” only when the threshold humidity is crossed. It is also noted that the field use garments comprise “pixels” of the membranes of dimension 10 cm × 10 cm each, electrically connected in parallel (cf. Figure 2). The seams between these pixels, of width ca. 2 to 4 mm, are sealed with a flexible, agent-blocking polyurethane adhesive. These seams were tested for agent simulant permeation and were found to be impermeable before and after several stress tests, including the Gelbo Flex test (see results in Supplementary Information).
An issue of concern for field use, and eventual decontamination in the event of agent exposure, is the retention of residual CW agent within the fabric. To evaluate this, full garments incorporating Type IIe and Type IIa membranes were surface-saturated with agent simulant (DIMP). The evaporative loss of DIMP at 25˚C and atmospheric pressure was monitored using weight-loss, GC/MS and other methods. It was found that ca. 33% of the original DIMP was linearly lost every hour, with complete loss of the DIMP within 3.25 h. This demonstrated the membranes would not retain any residual agent within just a few hours of exposure. Other issues of concern for use include the potential denaturing of the enzyme OPH in any membranes incorporating it, especially if a prolonged shelf life is involved. For this reason, and because the membranes with OPH did not perform markedly better than membranes without it except with the agent simulant Malathion, it appears that membranes that incorporate OPH should not be used within the fabric. As of this writing, the fabric samples incorporating our best membrane configurations are being evaluated for consideration in a future garment.
3.9. Potential Mechanism of Large WVT Rates Observed and of Agent Blocking
3.9.1. WVT
Our results, as presented above, and as confirmed with a multitude of tests at independent, external laboratories (also presented above), clearly establish: 1) That our membranes clearly demonstrate passive WVT rates that are multiples of the best rates reported previously. 2) That they display active WVT, demonstrated for the first time ever, at rates which are further increased from the passive rates. 3) And that they simultaneously and efficiently block agents. These results are clearly established. What is not established however is a possible mechanism for the observed WVT in our unique membranes. We now briefly discuss some potential mechanisms that may be postulated, in light of prior, published theoretical and experimental studies [1-23].
As noted above, the CP in our membrane assemblies was placed on the “inside” or interior, (i.e. closest to the skin when worn as a garment). Now a typical membrane configuration, such as Type IIa, displayed an open circuit potential (OCP, as measured with a potentiostat) between the “outside” facing and “inside” facing electrodes, of ca. +200 mV to +300 mV (with the + polarity observed at the CP, i.e. on the “inside” of the garment). These values may be compared with typical zeta potentials, observed in electroosmotic studies with capillaries, membranes and other naturally charged surfaces, of about +50 mV [1-10]. That is to say, as compared to all prior studies on microporous and other membrane and capillary materials, the intrinsic electroosmotic potential observed in our CP-functionalized membranes is ca. four to six times in magnitude. Now it is well established from prior studies [1-13] that this potential difference is the primary driver of the electroosmotic flow. Furthermore, an additional, externally applied voltage may be used to further supplement this intrinsic potential difference, as in the case of the active mode in our membranes.
Thus, one potential, clear explanation for the very large WVT rates observed in the case of our functionalized CP microporous membranes, even in a passive mode (i.e. with no voltage applied), is that the effective, intrinsic electroosmotic potentials in our materials are much larger than those observed in conventional capillaries or microporous (or other) membranes. Now when a further voltage is applied across our membranes (e.g. the 6 V typically applied in our active-mode studies, with the polarity always (+) at the CP on the “inside”), the resultant electric field further enhances the intrinsic electroosmotic potential of our membranes. However, this enhancement may not be significant, due primarily to the large (electrical) resistance of the gel electrolyte; this causes the actual voltage sensed at the CP electrode surface to be significantly less than the 6 V applied; we have confirmed this in OCP (open circuit potential) measurements, as cited earlier. As a result, the observed enhancement of WVT rates on application of a voltage is not large (ca. 44% was the maximum enhancement observed in our work).
It may be argued that the theoretical treatment and experimental observations of electroosmotic flow [1-12, 20-23] intrinsically stipulate that flow occurs only in the presence of an electrical field, i.e. in active mode. However, in this respect, it may be noted that electroosmotic flow is always “active”, because there is always a potential difference, corresponding approximately to the zeta potential, across a membrane or between the ends of a capillary. Indeed, the observed potential difference between the ends of the micropores of our membranes (ca. 200 - 300 mV, see data above and below) can be considered to be equivalent to an actively applied electrical field. Additionally, an analysis of the intrinsic electroosmotic potentials and their gradients present in capillaries and micropores, again based on prior theoretical and experimental work, shows that these inevitably vary significantly, by as much as 75 mV, from one end of any capillary or micropore to another [1-12]. Thus, it may be argued, the term “passive electroosmotic flow” is inherently incorrect, because the electroosmotic flow is in fact always active. Furthermore, when a species, e.g. water in vapor form, is introduced, that changes the electrochemical potential of one end of the capillary or micropore as compared to the other end, the electrical field gradient is further increased. Thus, what one may ascribe as a water vapor concentration difference between one end of a micropore or capillary and the other end may also be considered as an electroosmotic potential difference. During WVT then, the water vapor condenses on the walls of the capillary/micropore at one end and reevaporates at the other end. In other studies in our lab, this intrinsic potential difference and resulting electrical field gradient have been documented, in measurements of potential difference (ΔV) across interfaces using a laboratory potentiostat. Some typical results are as follows: 1) (RH = relative humidity, all measurements at 25˚C) Interface#1 [45% RH||Au|μP-PSulf|Au||45% RH], ΔV across Au electrodes = below noise of potentiostat, i.e. ~0 mV. 2) Interface#2 [90% RH||Au|μP-PSulf|Au|| 45% RH], ΔV across Au electrodes = 95 mV. 3) Interface#3 [90% RH||CP|Au|μP-PSulf|Au||45% RH], ΔV across Au electrodes = 295 mV. These measurements were highly reproducible and reversible. They clearly show that: 1) There is no observable ΔV when the RH at both ends of the membrane is the same. 2) When the RH at both ends is different (90%/45%), the presence of the CP layer causes a dramatic increase in the ΔV (from 95 mV to 295 mV). Finally, it should also be noted that the applicability of electroosmotic flow to combined liquid /vapor phases was clearly demonstrated by our [vapor||μPmembrane||vapor] experiments cited above, which showed a very large WVT upon application of a voltage across the interface.
The above discussion not with standing, regardless of the mechanism of WVT, which may properly be further elucidated in more detailed studies, the fact of the very high rate WVT (in both passive and active modes), as corroborated by several very different methods and at several independent laboratories, is clearly established in our work, as is the fact that the WVT is greatly enhanced with the inclusion of the CP in the membrane.
3.9.2. CW Agent Blocking
With regard to the effective blocking of the CW agents (and simulants) by our membrane assemblies, this may be ascribed primarily to the GelEl. The unique, patented [35-38] composition of the GelEl allows for water vapor penetration and transport within it, while serving as an impermeable barrier to organic molecules (in our case, those possessing phosphonate and structurally related moieties). This is confirmed by the observation, reported above, that our membrane assemblies, when they do not have GelEl, are significantly permeable to agents and simulants.
4. Conclusions
In this communication, we have demonstrated passive as well as active electroosmotic WVT, across unique, functionalized CP microporous membranes, the latter for the first time to our knowledge. This occurs together with simultaneous blocking of CW agents and simulants, again for the first time to our knowledge. The membrane assemblies demonstrate typical passive WVT rates more than 2.5 times as high and active rates more than 3.5 times as high as the highest previously reported (passive) WVT rates, for Nylon microporous membranes; these latter of course do not possess any agent blocking capability as our membranes do. Agent blocking was demonstrated with agents. All WVT and other measurements were independently corroborated at external laboratories. The membrane assemblies passed all relevant environmental durability tests. They were incorporated into “smart” final-form fabrics. Likely mechanisms of the significantly enhanced electroosmotic transport as well as the CW agents blocking in these membranes were discussed. Many issues relating to field use, such as power consumption and “smart” control were resolved. Garments incorporating these unique membranes are currently under test. The ultimate objective of this work is to create lightweight, comfortable protective garments.
5. Acknowledgements
Partial support of this work by the U.S. Army Engineering Research Development Command-Engineering Research Lab (ERDC-CERL) and U.S. Defense Threat Reduction Agency (DTRA) through Contract #W9132T07C0012 to Ashwin-Ushas Corporation is gratefully acknowledged.
REFERENCES
- M. Smoluchowski, “ Elektroosomosis,” In: L. Graetz, Ed., Handbuch der Elektrizitaet und des Magnetismus, Barth Verlag, Leipzig, 1921, p. 366.
- M. Smoluchowski, “Elektroosmosis,” Zeitschrift für Physikalische Chemie, Vol. 93, 1918, p. 129.
- D. C. Henry, “The Cataphoresis of Suspended Particles. Part I. The Equation of Cataphoresis,” Proceedings of the Royal Society A, Vol. 133, No. 133, 1931, p. 106. doi:10.1098/rspa.1931.0133
- D. A. Saville, “Electrokinetic Effects with Small Particles,” Annual Review of Fluid Mechanics, Vol. 9, 1977, p. 321.
- Y. Xu, “Tutorial: Capillary Electrophoresis,” The Chemical Educator, Vol. 1, No. 2, 1996, pp. 1-14. doi:10.1007/s00897960023a
- Zetasizer Nano Series User Manual, “Zeta Potential Theory,” Chapter 16, Malvern Instruments Ltd., Malvern.
- B. D. Bowen, “Theory of Electrokinetic Measurements in Sandwich Cells,” Journal of Colloid and Interface Science, Vol. 98, No. 1, 1984, pp. 236-244.
- A. Hernandez, R. Lopez, J. I. Calvo and P. Pradanos, “A Network Microcapillary Model for Electrokinetic Phenomena through Microporous Membranes,” Colloids and Surfaces A: Physicochemical and Engineering Aspects, Vol. 145, No. 1-3, 1998, p. 11.
- S. Basu and M. M. Sharma, “An Improved Space-Charge Model for Flow through Charged Microporous Membranes,” Journal of Membrane Science, Vol. 124, No. 1, 1997, pp. 77-91. doi:10.1016/S0376-7388(96)00229-3
- B. D. Bowen and R. A. Clark, “Electro-Osomosis at Microporous Membranes and the Determination of ZetaPotential,” Journal of Colloid and Interface Science, Vol. 97, No. 2, 1984. pp. 401-409. doi:10.1016/0021-9797(84)90311-4
- M. Kozak and E. J. Davis, “Electrokinetic Phenomena in Fibrous Porous Media,” Journal of Colloid and Interface Science, Vol. 112, No. 2, 1986, pp. 403-410. doi:10.1016/0021-9797(86)90108-6
- M. Mullet, P. Fievet, J. C. Reggiani and J. Pagetti, “Surface Electrochemical Properties of Mixed Oxide Ceramic Membranes: Zeta-Potential and Surface Charge Density,” Journal of Membrane Science, Vol. 123, No. 2, 1997, pp. 244-265 doi:10.1016/S0376-7388(96)00220-7
- B. Halford, “Raincoats,” Chemical & Engineering News, Vol. 84, No. 24, 2006, p. 39. doi:10.1021/cen-v084n024.p039
- L. K. Wolf, “Shielding Soldiers with Fabric,” Chemical & Engineering News, Vol. 90, No. 15, 2012, pp. 36-38.
- W. L. Gore & Associates. http://www.gore.com
- DuPont breathable fabric. http://www2.dupont.com/Active_Layer/en_US/assets/downloads/K-06012-1%20Active%20Layer.pdf http://www2.dupont.com/Active_Layer/en_US/assets/downloads/APA60015NC000.pdf
- E. A. McCullough, M. Kwon and H. Shim, “A Comparison of Standard Methods for Measuring Water Vapour Permeability of Fabrics,” Measurement Science and Technology, Vol. 14, No. 8, 2003, pp. 1402-1408. doi:10.1088/0957-0233/14/8/328
- E. A. McCullough, J. Huang and C. S. Kim, “An Explanation and Comparison of Sweating Hot Plate Standards,” Journal of ASTM International, Vol. 1, No. 7, 2004, Article ID: JAI12098. http://www.astm.org/JOURNALS/JAI/PAGES/JAI12098.htm
- J. Walker, H. Schreuder-Gibson, W. Yeomans, F. Hoskin, R. C. Cheng, R. Yin and R. Hill, “Development of SelfDecontaminating Textiles with Microporous Membranes,” Report, US Defense Technical Information Center, 2002.
- S. K. Vajandar, D. Xu, D. Li, D. Markov, J. Wikswo and W. Hofmeister, “SiO2-Coated Porous Anodic Alumina Membranes for High Flow Rate Electroosmotic Pumping,” Nanotechnology, Vol. 18, No. 27, 2007, Article ID: 275705.
- S. A. Miller and C. R. Martin, “Controlling the Rate and Direction of Electroosmotic Flow in Template-Prepared Carbon Nanotube Membranes,” Journal of Electroanalytical Chemistry, Vol. 522, No. 1, 2002, pp. 66-69. doi:10.1016/S0022-0728(02)00648-4
- S. K. Li, A.-H. Ghanem and W. I. Higuchi, “Pore Charge Distribution Considerations in Human Epidermal Membrane Electroosmosis,” Journal of Pharmaceutical Sciences, Vol. 88, No. 10, 1999, pp. 1044-1049. doi:10.1021/js980442x
- C. K. Lee and J. Hong, “Characterization of Electric Charges in Microporous Membranes,” Journal of Membrane Science, Vol. 39, No. 1, 1988, pp. 79-88. doi:10.1016/S0376-7388(00)80995-3
- Detailed Descriptions of All the American Society for Testing and Materials (ASTM) Tests quoted in this communication are available on the ASTM website at: http://www.astm.org/Standard/index.shtml.
- Details of Related Tests of the International Standards Organization, ISO, Geneva. http://www.iso.org/iso/home.html
- Test Operations Procedure (TOP) 8-2-501, Permeation and Penetration of Air-Permeable, Semipermeable, and Impermeable Materials with Chemical Agents or Simulants. http://ammtiac.alionscience.com/ammt/iacdocs.do?115337
- R. B. Lindsay, A. G. Pappas and J. M. Baranoski, “Test Results of Air-Permeable Charcoal Impregnated Suits to Challenge by Chemical and Biological Warfare Agents and Simulants,” Report #A368614, US Defense Technical Information Center, May 2003.
- CW Protective Equipment: An Overview of Respiratory and Body Protection. http://www.opcw.org/resp/html/equip.htm
- http://www.army.mil/factfiles/equipment/nbc/jslist.html http://tech.military.com/equipment/view/88668/jslist.html
- J. M. Sloan, E. Napadensky, D. M. Crawford and Y. A. El-Abd, “Nanostructured Polymer Membranes for Chemical Protective Clothing,” Weapons and Materials Research Directorate, Army Research Lab, Aberdeen Proving Ground, MD, 2004.
- E. Napadensky and Y. A. El-Abd, “Breathability and Selectivity of Selected Materials for Protective Clothing,” Report# A602524, US Defense Technical Information Center, 2004.
- E. Klemperer, “Toxic Industrial Chemical Tests of Resistance to Permation by Protective Suits,” Report# A063134, US Defense Technical Information Center, 2006.
- P. Chandrasekhar, B. J. Zay, G. C. Birur, S. Rawal, A. A. Pierson, L. Kauder and T. Swanson, “Large, Switchable Electrochromism in the Visible Through Far-Infrared in Conducting Polymer Devices,” Advanced Functional Materials, Vol. 12, No. 2, 2002, pp. 95-103. doi:10.1002/1616-3028(20020201)12:2<95::AID-ADFM95>3.0.CO;2-N
- P. Chandrasekhar, B. J. Zay, D. A. Ross, T. M. McQueeney, G. C. Birur, T. Swanson, L. Kauder and D. Douglas, “Chromogenic Phenomena in Polymers: Tunable Optical Properties,” S. A. Jenekhe and D. J. Kiserow, Eds., ACS Symposium Series, American Chemical Society, Oxford University Press, New York, 2004, pp. 66-79.
- P. Chandrasekhar, US Patent No. 5,995,273, 1999.
- P. Chandrasekhar, US Patent No. 6,033,592, 2000.
- P. Chandrasekhar, Canadian Patent No. 2,321,894, 2007.
- P. Chandrasekhar, European Patent No. 99908208.4, 2009.
- P. Chandrasekhar, “Conducting Polymers: Fundamentals and Applications. A Practical Approach,” Springer Verlag, Berlin, 1999.
- P. Chandrasekhar, B. J. Zay, T. M. McQueeney, G. C. Birur, V. Sitaram, R. Menon and R. L. Elsenbaumer, Physical, Chemical, Theoretical Aspects of Conducting Polymer Electrochromics in the Visible, IR and Microwave Regions,” Synthetic Metals, Vol. 155, No. 3, 2005, pp. 623-627. doi:10.1016/j.synthmet.2005.08.015
- J. Chen, B. Winther-Jensen, C. Lynam, O. Ngamna, S. Moulton, W. Zhang and G. G. Wallace, “A Simple Means to Immobilize Enzyme into Conducting Polymers via Entrapment,” Electrochemical and Solid-State Letters, Vol. 9, No. 7, 2006, pp. H68-H70. doi:10.1149/1.2201306
- A. Mulchandani, P. Mulchandani, W. Chen, J. Wang and L. Chen, “Amperometric Thick-Film Strip Electrodes for Monitoring Organophosphate Nerve Agents Based on Immobilized Organophosphorus Hydrolase,” Analytical Chemistry, Vol. 71, No. 11, 1999, pp. 2246-2249. doi:10.1021/ac9813179
- Information on the US Army’s Joint Service Lightweight Integrated Suit Technology (JSLIST), including the suits (uniforms) currently deployed. http://www.army.mil/factfiles/equipment/nbc/jslist.html.
- E. Wilusz, Q. Truong, D. H. McCullough III., J. Li and S. L. Regen, “Perforated Monolayers for Enhanced Permselectivity in Chemical Biological Barrier Membranes,” Report# A650334, US Defense Technical Information Center, 2004. http://www.dtic.mil/dtic/
- A. Prasad, “Polyethylene, Low-Density,” In: J. E. Mark, Ed., Polymer Data Handbook, Oxford University Press, Oxford, 1996, p. 571.
NOTES
*Corresponding author.