Theoretical Economics Letters
Vol.4 No.5(2014), Article ID:46609,10 pages
DOI:10.4236/tel.2014.45044
An Option Pricing Analysis of Exotic Bonus Certificates—The Case of Bonus Certificates PLUS
Rodrigo Hernández1, Pu Liu2
1Accounting, Finance and Business Law Department, Radford University, Radford, USA
2Finance Department, University of Arkansas, Fayeteville, USA
Email: rjhernand@radford.edu, pliu@walton.uark.edu
Copyright © 2014 by authors and Scientific Research Publishing Inc.
This work is licensed under the Creative Commons Attribution International License (CC BY).
http://creativecommons.org/licenses/by/4.0/


Received 25 April 2014; revised 24 May 2014; accepted 31 May 2014
Abstract
In this paper we introduce a new financial product named Bonus Certificates PLUS and we provide detailed descriptions of the product specifications. We show that the payoff of a Bonus Certificates PLUS can be duplicated by the combination of a long position in the underlying asset, a short position on zero coupon bonds, a long position in down-and-out call options on the underlying asset, a long position in down-and-in call options on the underlying asset, and a long position in the downand-out put options. We develop a pricing formula to price the certificates. A sample of ten Bonus Certificates PLUS outstanding on December 2007 is presented as an example to examine how well the model fits empirical data. The profitability in the primary market is examined and the results show that issuing Bonus Certificates PLUS is a profitable business. The results are in line with previous studies pricing other structured products. Finally, we simulate and present the sensitivities of the certificates to changes in different pricing inputs.
Keywords: Bonus Certificates, Option Pricing, Structured Products, Financial Innovation

1. Introduction
Modern wealth management products (also known as structured products) have been growing explosively in volume and complexity during the last two decades [1] [2] . This new trend of more complex securities has caught the attention of academicians [2] [3] , media [4] -[10] , and regulators [11] . For example in Hernandez et al. [2] , the authors analyze Bonus Certificates, a type of Outperformance Certificate “upgraded” with barrier options to provide extra capital protection as long as the underlying asset price does not breach a lower barrier. In a similar way, Outperformance Certificates PLUS can also be considered as an “upgraded” Outperformance Certificate with embedded barrier options to outperform the return of the underlying asset if the later ever drops below a predetermined barrier [12] .
This paper examines a new financial product known as Bonus Certificates PLUS (to be referred to as BCP henceforth), one of the equity-linked structured products issued by major banks in Europe. Bonus Certificates PLUS can be considered as an “upgraded” Bonus Certificate with additional barrier options. BCP (also known by the commercial names of “Power Plus Certificates” or “Bonus Extra Plus Certificates”) are one of the equitylinked “structured products” issued by major banks in Europe. The rate of return on a BCP is contingent upon the performance of a pre-determined underlying asset over a pre-specified period (known as the term to maturity). As long as the underlying asset price never drops to a pre-determined level (knock-out level) anytime between the issue date and the maturity date, the investors of the certificates will receive a return equal to a pre-specified multiple (known as participation rate) times the return on the underlying asset if the price of the underlying asset goes up during the term to maturity. However, if the price of the underlying asset goes down during the term, the investors of the certificates will receive full capital protection.
If the underlying asset price ever drops to the knock-out level anytime during the term to maturity and closes above the barrier level, the investors of the certificates will receive a redemption amount equal to the underlying asset plus a supplemental amount equal to a pre-specified multiple, equal to the participation rate minus one1, times the difference between the closing price of the underlying asset on maturity date and the knock-out level. If the underlying asset price ever drops to the knock-out level anytime during the term to maturity and closes below the knock-out level, the investors of the certificates will receive the same return as the underlying asset. In calculating the return on the underlying asset, the certificate issuers will use only the change in the asset price, and the cash dividend paid during the period is not included. In other words, investors in the BCP do not receive cash dividends even the underlying assets pay dividends during the term to maturity.
The purpose of the paper is to extend Hernandez et al. [3] to Bonus Certificates PLUS and to provide an indepth economic analysis for the certificates to explore how the principles of financial engineering are applied to the creation of new structured products. A pricing model for the certificates is developed by using option pricing formulas. In addition, ten Bonus Certificates PLUS issued by well-recognized large banks in Europe are priced by calculating the cost of portfolios with a payoff similar to the payoff of the certificates.
The remainder of the paper is organized as follows. The design of BCPs is introduced in Section 2. A pricing model for BCPs is developed in Section 3. In Section 4, we price ten certificates that have complete data and calculate the profit to the issuer in the primary market based on our pricing model developed in Section 3. We find that on average issuers earn a profit of 2% in the €177 million sample. In Section 5, we present the sensitivities of the BCPs to changes in the pricing input variables. Section 6 concludes.
2. Description of the Product
The rate of return of a BCP is contingent upon the price performance of its underlying asset over its term to maturity. The beginning date for calculating the gain (or loss) of the underlying asset is known as the initial fixing date (or trade date) and the ending date of the period is known as the final fixing date (or maturity date). The price of the underlying asset on the initial fixing date is referred to as the initial fixing level, and the price of the underlying asset on maturity date is referred to as the valuation price. Denoting the underlying asset price on the initial fixing date as I0, the knock-out level as IKO, the valuation price as IT, and the participation rate as p, then for an initial investment of €100 in a certificate, the total value that an investor will receive on maturity date, VT, (known as the redemption amount) is equal to:
 (1)
(1)
Alternatively, the relationship between the terminal value of a certificate and the terminal value of the underlying asset based on the change in the underlying asset price (without taking into account dividends) with a knock-out level at 70% of the initial fixing level and a participation rate of 150%, can be represented in Figure 1.
The solid line in Figure 1 represents the terminal value of the certificate on maturity day T as a function of the terminal value of the underlying asset when the knock-out level is never broken over the term of maturity. The dashed line represents the terminal value of the certificate on maturity day T, as a function of the terminal value of the underlying asset when the knock-out level is broken over the term of maturity. The dotted line represents the terminal value of the underlying asset. The slope for the value of the underlying asset (dotted line) is, of course, one. The slope for the value of the certificate when the price of the underlying asset goes up and the knock-out level is never broken over the term to maturity (solid line) is equal to participation rate (i.e. 150% in the example). The slope for the value of the certificate when the knock-out level is broken over the term of maturity (dashed line) and the price of the underlying asset closes higher than the knock-out level, is also equal to participation rate (i.e. 150% in the example). In Appendix, we present the summary information for one BCP in our sample.
3. The Pricing of Bonus Certificates PLUS
The redemption amount, from Equation (1), for holding one BCP, VT, when the underlying asset price has never dropped to the knock-out level between the initial fixing date and the final fixing date of the certificate, for an initial investment of €100, a knock-out level IKO, a participation rate p, and a term to maturity T, is:
 (2)
(2)
The redemption value, from Equation (1), for holding one certificate, VT, when the underlying asset price ever dropped to the knock-out level the initial fixing date and the final fixing date of the certificate, is:
 (3)
(3)
A long position in the underlying asset will generate a payoff IT on maturity date T plus cash dividends on exdividend dates. Since BCP do not pay cash dividends, the payoff IT in Equations (2) and (3) can be duplicated by

Figure 1. The terminal value of an investment of €100 in BCP as a function of final fixing level IT, with a knock-out level at 70% of the initial fixing level and a participation rate of 150%.
taking a long position in the underlying asset, and a short position on zero coupon bonds of which the face values are equal to the amount of dividends and the maturity dates are the ex-dividend dates. The payoff Max[0, I0-IT] in Equation (2) is the payoff of a long position on put options on the underlying asset with an exercise price I0. This put option exists as long as the price of the underlying asset has never dropped to the knock-out level between the initial fixing date and the final fixing date of the certificate (i.e. down-and-out put option). The payoff Max[0, IT-I0] in Equation (2) is the payoff of a long position on call options on the underlying asset with an exercise price I0. This call option exists as long as the price of the underlying asset has never dropped to the knock-out level between the initial fixing date and the final fixing date of the certificate (i.e. down-and-out call option). The payoff Max[0, IT-IKO] in Equation (3) is the payoff of a long position on call options on the underlying asset with an exercise price IKO. This call option exists as long as the price of the underlying asset has dropped to the barrier level between the issue date and the maturity date of the certificate (i.e. down-and-in call option). So the payoff for investing in one BCP is the same as the combined payoffs of taking the following five positions:
1) A long position in the underlying asset. The number of shares equal to €100/I0;
2) A short position in zero coupon bonds. The face values of the bonds are the cash dividends to be paid by €100/I0 shares of the underlying asset and the maturity dates are the ex-dividend dates of cash dividends;
3) A long position in down-and-in call option on the underlying asset. The number of options is €100/I0 (p − 1). The exercise price and barrier level of the options is IKO and the term to expiration of the options is T, the same as the term to maturity of the certificate.
4) A long position in down-and-out call option on the underlying asset. The number of options is €100/I0 (p − 1). The exercise price of the options is I0, the barrier level of the option is IKO, and the term to expiration of the options is T, the same as the term to maturity of the certificate.
5) A long position in down-and-out put option on the underlying asset. The number of options is €100/I0. The exercise price of the options is I0, the barrier level of the options is IKO and the term to expiration of the options is T, the same as the term to maturity of the certificate.
Since the payoff of BCP is the same as the combined payoffs of the above five positions, we can calculate the fair value of the certificates based on the value of the five positions. Any selling price of the certificates above the value of the above five positions is the gain to the certificate issuer. The value of Position 1 is the price of €100/I0 shares of the underlying asset on fixing date I0. The value of Position 2 is the present value of cash dividends to be paid by €100/I0 shares of the underlying asset, to be denoted as PVD. The value of Position 3 is the value of €100/I0 (p − 1) shares of down-and-in call options with each call value of Cdi [13] :
 (4)
(4)
r is the risk-free rate of interest, T is the term to maturity of the certificate, X is the exercise price, IKO is the barrier level, σ is the standard deviation of the underlying asset return, q is the dividend yield of the underlying asset, and
 (5)
(5)
 (6)
(6)
The value of Position 4 is the value of €100/I0 (p − 1) shares of down-and-out call options with each call value of Cdo equal to the value of a regular call minus the value of a down-and-in call option [13] :
 (7)
(7)
The value of Position 5 is the value of €100/I0 shares of down-and-out put options with each put value of Pdo equal to the value of a regular put minus the value of a down-and-in put option [13] :
 (8)
(8)
and,
 (9)
(9)
where
 (10)
(10)
 (11)
(11)
Therefore, the total cost, TC, for each BCP is
 (12)
(12)
If we denote B0 as the issue price of the certificate, and TC as the total cost (fair value) of issuance, any issue price above the fair value is the gain to the certificate issuer. And the profit function for the issuer is
 (13)
(13)
The profitability is measured by the profit ( ) as a percentage of the total issuing cost
(TC), i.e.
) as a percentage of the total issuing cost
(TC), i.e.
 (14)
(14)
4. The Bonus Certificate PLUS Market and Profitability
Our sample consists of ten BCPs outstanding in December 2007 issued between July 2004 and June 2006 by UBS AG (9 certificates) and Bayerische Hypound Vereinsbank AG (1 certificate). We developed our sample from final term sheets published on web pages of each bank. In Table 1 we present the descriptive statistics for the BCP market. The total value issued is €177.1 million on 10 issues. The median size is €16.03 million with 250 thousand certificates in each issue. The median term to maturity is 3.55 years with a median leverage factor of 150%. One feature especially worth noting is that the median selling price is 100% of the reference price for both.
We examine the profitability of issuing BCPs and in order to calculate the issuer’s profit, the following data is needed: 1) the price of the underlying assets, I0, 2) the cash dividends to be paid by the underlying assets and the ex-dividend date in order to calculate the dividend yield, q, 3) the risk-free rate of interest, r, and 4) the volatility of the underlying assets, σ. Equations (4) and (9) are based on continuous dividend yield. Since the dividends

Table 1 . Descriptive statistics.
aAs a percentage of the underlying asset’s price on the issue date.
from the underlying security are discrete, the following approach is used to calculate the equivalent continuous dividend yield for underlying security that pays discrete dividends. For an underlying asset that is an index with a price I0 at t = 0 (the issue date) and that pays n dividends during a time period T with cash dividend Di being paid at time ti, the equivalent dividend yield q will be such that
 (15)
(15)
The prices and dividends of the underlying assets are obtained from Bloomberg; the risk-free rate of interest is the yield on swap rates where the term to maturity matches those of the certificates. The volatility, σ, of the underlying asset is the historical volatility calculated from the underlying securities prices in the previous 260 days. We calculate the profit for each certificate issue that has complete data based on Equation (12). We present the profitability of issuing BCPs in Table2 The results in Table 2 show that average profit is 1.82% for 10 issues on top of a 2% - 3% front load fee usually charged when the certificates are sold to retail investors. Our finding that BCPs are overpriced is consistent with prior research on structured products that report that structured products have been overpriced, 2% - 7% on average in the primary market based on theoretical pricing models [2] [3] [12] [14] -[25] for various types of structured products.
5. The Bonus Certificates PLUS Sensitivities
The characteristics of BCPs can be expressed in terms of sensitivities, sometimes referred to as “Greeks”, such as Delta, Gamma, Vega, Theta, Rho, Psi, and so on. These sensitivities are the mathematical first and second derivatives of the pricing formula (i.e. sum of replicating positions), with respect to the pricing input variables. Delta (∆) measures the change in the option price per $1 increase in the underlying asset price. Gamma (Γ) measures the change in Delta per $1 increase in the underlying asset price. Vega, sometimes also referred to as “Kappa” or “Lambda”, measures the change in the option price per 1% increase in the volatility of the underlying asset’s returns. Theta (θ) measures the change in the option price per 1 day decrease in the term to maturity of the option. Rho (ρ) measures the change in the option price per 1% increase in the interest rate. Psi (ψ) measures the change in the option price per 1% increase in the dividend yield of the underlying asset.
Delta: Figure 2 presents the behavior of delta for three BCPs with different term to maturities. For BCPs delta
Table 2 . Profitability.

Figure 2. Bonus Certificates PLUS Deltas for at-the-money EUR 15.43 initial fixing level for different times to expiration. Assumes knock-out level at 70% of the initial fixing, participate rate 150%, σ = 17.526%, r = 2.903%, and δ = 4.931%.
is positive, as the underlying asset increases the BCP price increases. Gamma: represents the change in delta as the underlying asset price increases by $1. Figure 3 presents the behavior of gamma for three BCPs with different term to maturities. Vega: represents the change in the option price per 1% increase in the volatility of the underlying asset’s returns. Figure 4 presents the behavior of vegas for three BCPs with different term to maturities. Theta: represents the change in the option price per 1-day decrease in the term to maturity of the BCP. Figure 5 presents the behavior of thetas for three BCPs with different term to maturities.

Figure 3. Bonus Certificates PLUS Gammas for at-the-money EUR 15.43 initial fixing level for different times to expiration. Assumes knock-out level at 70% of the initial fixing, participate rate 150%, σ = 17.526%, r = 2.903%, and δ = 4.931%.

Figure 4. Bonus Certificates PLUS Vegas for at-the-money EUR 15.43 initial fixing level for different times to expiration. Assumes knock-out level at 70% of the initial fixing, participate rate 150%, σ = 17.526%, r = 2.903%, and δ = 4.931%.

Figure 5. Bonus Certificates PLUS Thetas for at-the-money EUR 15.43 initial fixing level for different times to expiration. Assumes knock-out level at 70% of the initial fixing, participate rate 150%, σ = 17.526%, r = 2.903%, and δ = 4.931%.
Rho: measures the change in the option price per 1% increase in the interest rate. Figure 6 presents the behavior of rho for three BCPs with different term to maturities. Figure 6 assumes 1 basis point change in the interest rate (i.e. 1/100 of one percent). The rho for the BCPs is almost always positive and as the underlying asset price increases the BCP’s rho increases. As time to expiration increases, rho is higher in value (i.e. smaller negative impact).
Psi: represents the change in the option price per 1% increase in the dividend yield of the underlying asset. Figure 7 assumes 1 basis point change in the dividend yield (i.e. 1/100 of one percent) and presents the behavior of psi for three BCPs with different term to maturities. The psi for the BCPs is almost always negative, as the underlying asset price increases the BCP’s psi decreases. As time to expiration increases, phi is lower in value (i.e. larger negative impact).
6. Conclusion
This paper introduces a newly structured product known as Bonus Certificates Plus and provides a detailed description of the product specifications. Further, it develops a pricing model for the certificates that it is applied to a sample of ten certificates to examine how well the model fits empirical data. The results indicate that issuing the certificates is a profitable business for the issuers. The results are in line with previous studies pricing other structured products. The paper provides insights into the design, the payoff, the pricing and the profitability of

Figure 6. Bonus Certificates PLUS Rhos for at-the-money EUR 15.43 initial fixing level for different times to expiration. Assumes knock-out level at 70% of the initial fixing, participate rate 150%, σ = 17.526%, r = 2.903%, and δ = 4.931%.
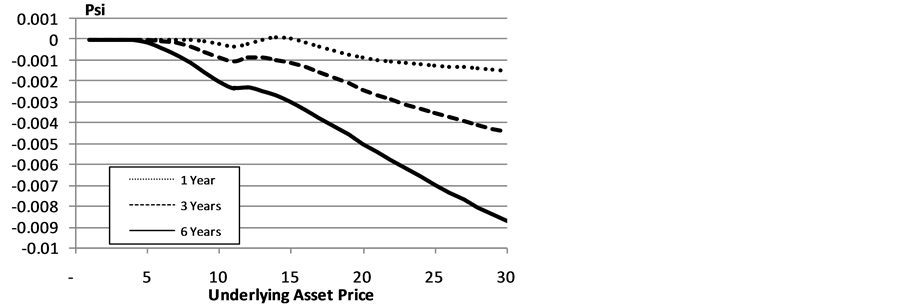
Figure 7. Bonus Certificates PLUS Psis for at-the-money EUR 15.43 initial fixing level for different times to expiration. Assumes knock-out level at 70% of the initial fixing, participate rate 150%, σ = 17.526%, r = 2.903%, and δ = 4.931%.
this exotic bonus certificate. The methodology and approach used in this paper can be easily extended to the analysis of other structured products.
References
- Das, S. (2001) Structured Products and Hybrid Securities. John Wiley & Sons Ltd., Singapore.
- Hernandez, R., Lee, W. and Liu, P. (2010) An Economic Analysis of Reverse Exchangeable Securities—An Option-Pricing Approach. Review of Futures Markets, 19, 67-95.
- Hernandez, R., Brusa, J. and Liu, P. (2008) An Economic Analysis of Bonus Certificates—Second-Generation of Structured Products. Review of Futures Markets, 16, 419-451.
- Laise, E. (2006) An Arcane Investment Hits Main Street. Wall Street Journal—Eastern Edition, 247, D1-D3.
- Maxey, D. (2006) Market Builds for Structured Products. Wall Street Journal—Eastern Edition.
- Ricks, T. (1988) SEC Chief Calls Some Financial Products Too Dangerous’ for Individual Investors. Wall Street Journal, 1.
- Lyon, P. (2005) Editor’s Letter: The NASD Guidance Does Seem to Suggest That Structured Products Should Be the Preserve of the Privileged Few Who Are Eligible for Options Trading. Structured Products.
- Lyon, P. (2005) US Retail in the Firing Line. Structured Products.
- Simmons, J. (2006) Derivatives Dynamo. Bloomberg Markets, 55-60.
- Isakov, D. (2007) Le prix eleve de certains instruments tient aux frictions qui apparaissentsur le marche. Le Temps.
- National Association of Securities Dealer (2005) Notice to Members 05-59 Guidance Concerning the Sale of Structured Products.
- Hernandez, R., Tobler, C. and Liu, P. (2014) Exotic Outperformance Certificates—The Case of Outperformance Certificates PLUS. Journal of Applied Financial Research (Forthcoming).
- Hull, J. (2003) Options, Futures, and Other Derivatives. Pearson Education Inc., Upper Saddle River.
- Chance, D. and Broughton, J. (1988) Market Index Depository Liabilities. Journal of Financial Services Research, 1, 335-352. http://dx.doi.org/10.1007/BF00235203
- Abken, P. (1989) A Survey and Analysis of Index-Linked Certificates of Deposit. Working Paper, Federal Reserve Bank of Atlanta, Atlanta.
- Chen, A. and Kensinger, J. (1990) An Analysis of Market-Index Certificates of Deposit. Journal of Financial Services Research, 4, 93-110. http://dx.doi.org/10.1007/BF00352565
- Chen, K. and Sears, R. (1990) Pricing
the SPIN. Financial Management, 19, 36-47.
http://dx.doi.org/10.2307/3665633 - Baubonis, C., Gastineau, G. and Purcell, D. (1993) The Banker’s Guide to Equity-Linked Certificates of Deposit. Journal of Derivatives, 1, 87-95. http://dx.doi.org/10.3905/jod.1993.407880
- Burth, S., Kraus, T. and Wohlwend, H. (2001) The Pricing of Structured Products in the Swiss Market. Journal of Derivatives, 9, 30-40. http://dx.doi.org/10.3905/jod.2001.319173
- Wilkens, S., Erner, C. and Roder, K. (2003) The Pricing of Structured Products in Germany. Journal of Derivatives, 11, 55-69. http://dx.doi.org/10.3905/jod.2003.319211
- Grunbichler, A. and Wohlwend,
H. (2005) The Valuation of Structured Products: Empirical Findings for the Swiss
Market. Financial Markets and Portfolio Management, 19, 361-380.
http://dx.doi.org/10.1007/s11408-005-6457-3 - Stoimenov, P. and Wilkens, S. (2005) Are Structured Products “Fairly” Priced? An Analysis of the German Market for Equity-Linked Instruments. Journal of Banking and Finance, 29, 2971-2993. http://dx.doi.org/10.1016/j.jbankfin.2004.11.001
- Benet, B., Giannetti, A.
and Pissaris, S. (2006) Gains from Structured Product Markets: The Case of Reverse-Exchangeable
Securities (RES). Journal of Banking and Finance, 30, 111-132.
http://dx.doi.org/10.1016/j.jbankfin.2005.01.008 - Hernandez, R., Jones, J. and Gu, Y. (2011) An Economic Analysis of Protect Certificates—An Option-Pricing Approach. Banking and Finance Review, 3, 17-40.
- Hernandez, R., Lee, W., Liu, P. and Dai, T. (2013) Outperformance Certificates: Analysis, Pricing, Interpretation, and Performance. Review of Quantitative Finance and Accounting, 40, 691-713. http://dx.doi.org/10.1007/s11156-012-0294-z
Appendix
NOTES

1Payoffs are different for Bonus Certificates and BCPs. For Bonus Certificates, participation rate is equal or greater than 100% when the final underlying asset price is over I0; for BCPs, the participation rate is greater than 100% when the final underlying asset price is over I0 and the knock-out level was never touched but also when the final underlying asset price is over IKO and the knock-out level was ever touched.