Theoretical Economics Letters
Vol. 3 No. 5A1 (2013) , Article ID: 36262 , 7 pages DOI:10.4236/tel.2013.35A1003
An Analysis of Ethanol Investment Decisions in Thailand
1Crawford School of Public Policy, Australian National University, Canberra, Australia
2Agricultural and Resource Economics, University of California at Davis, Davis, USA
3College of Economics and Management, Nanjing Agricultural University, Nanjing, China
Email: nisal.herath@gmail.com, cclin@primal.ucdavis.edu, fujinyi@njau.edu.cn
Copyright © 2013 Nisal Herath Mudiyanselage et al. This is an open access article distributed under the Creative Commons Attribution License, which permits unrestricted use, distribution, and reproduction in any medium, provided the original work is properly cited.
Received June 15, 2013; revised July 15, 2013; accepted August 13, 2013
Keywords: Ethanol; Thailand
ABSTRACT
This paper analyzes the decision to invest in building ethanol plants in Thailand. We analyze the effects of economic factors, strategic factors, and government policies on ethanol investment using discrete response and fixed effects regression models. Results show that the main factor that affects the decision to invest in building an ethanol plant in a particular changwat is the number of ethanol plants already in the changwat. The number of ethanol plants already in the changwat has a significant negative effect on the decision to invest in building an ethanol plant in a particular changwat, which suggests that potential investors are deterred by local competition in input and output markets.
1. Introduction
As a country develops, the energy needs of the country also increase. Industries will expand and the number of cars will increase, thus increasing the need for fossil fuelbased energy. This is the case in Thailand, where the demand for energy is expected to grow rapidly [1]. Thailand has a large net fuel import, totaling $7,908 million in value in the year 2006 [2]. Petroleum imports also accounted for 6.64% of GDP in 2003 [2]. To address its high dependence on foreign sources of energy and to enable the country to meet some of its energy needs domestically, Thailand has implemented policies to encourage the production and use of ethanol and biodiesel. This paper analyzes the effects of these policies, along with economic factors and strategic factors, on decisions to invest in ethanol in Thailand.
The history of the ethanol industry in Thailand has several important events [3]. These events include King Bhumipol sanctioning a study on converting sugar cane to alternative fuels in 1985; the Royal Chitralada Project, which tested ethanol production from sugar cane in 1994; and the National Metals and Materials Technology Center collaborating in ethanol research with Ford Motor Corporation in 1999. Mr. Alongkorn Polaboo, who was a Member of Parliament, endorsed ethanol and, along with other ethanol promoters, established the National Ethanol Committee in 2001, attended the International Symposium on Alcohol Fuel in 2003 and instituted the Ethanol-Biodiesel Foundation in 2003. In 2003, the government of Thailand chose Gasohol 95 (E10) as the blend to be distributed [3]. According to the government strategy established in 2003, the quantity of ethanol to be used would be one million liters per day in 2006 and three million liters per day in 2011.
Thailand has vast agricultural resources. Some of the main feedstocks used in ethanol production are corn, cassava, sugarcane and molasses, which are based on of the large scale cultivation of corn, cassava and sugarcane in Thailand.
The first ethanol plant to produce ethanol in Thailand was the PawnWiLai Inter Group Trading plant. This plant is located in Ayutthaya changwat of Thailand and began operation in October 2003, producing 25,000 liters per day. The main feedstocks used to produce ethanol in this plant are molasses and cassava.
This paper analyzes the decision to invest in building ethanol plants in Thailand. We analyze the effects of economic factors, strategic factors, and government policy on ethanol investment using discrete response and fixed effects regression models. Results show that the main factor that affects the decision to invest in building an ethanol plant in a particular changwat is the number of ethanol plants already in the changwat. The number of ethanol plants already in the changwat has a significant negative effect on the decision to invest in building an ethanol plant in a particular changwat, which suggests that potential investors are deterred by local competition in input and output markets.
2. Thailand’s Ethanol Industry and Ethanol Policies
The Thai government implemented a two-phase gasohol program which began in 2004 [2]. Gasohol is a gasoline-ethanol blend. In Phase 1, which spanned from 2004-2006, three new ethanol plants began production. In Phase 2, which spans from 2007-2012, eighteen new biodiesel plants will begin production. The main feedstocks for the ethanol industry include corn, cassava, sugarcane, and molasses.
The government determines the required blends of ethanol. Currently there are specifications for Gasohol 91 and Gasohol 95. The government also provides incentives for investment along with infrastructure to increase the output of ethanol. Currently there are 22 different ethanol plants being operated in 17 changwats in Thailand. The current production capacity is 4,795,000 liters per day.
Previous studies of the ethanol policies in Thailand have not looked the effects of individual policies, but instead have looked at the effects of the ethanol program as a whole. According to these studies, since the implementation of the ethanol program, there has been an increase in certain feedstock prices [2]. The prices of sugarcane and molasses have increased and have become more volatile, even despite government price supports [4]. This has the potential to lead to food shortages. There are also environmental impacts as well [5], including a decrease in the levels of greenhouse gas emissions in Thailand [6]. The agricultural industry has been able to meet the required production levels [6]. This paper builds upon the previous studies by analyzing individual policies and by analyzing their impacts on ethanol investment.
3. Data
3.1. Plant Data
There were 3 different sources for plant data. One was the report An Update on Ethanol Production and Utilization in Thailand by the U.S. Department of Energy. The second was the Department of Alternative Energy Development and Efficiency website. All of the sources contained information on the changwat of the plant, capacity, feedstock used, and production commencement date.
In the regressions that were used, the dependent variable, the decision to invest, was based upon the plant data. According to the data, the maximum number of plants contained in a single changwat was three. Based on the maximum number of plants, each changwat had up to three potential entrants depending on the number of plants already in the changwat, so that the maximum possible number plants that could be built in the changwat was three. The dummy variable for the decision to invest is equal to zero for each potential entrant until the year that the plant was built, at which date the dummy variable is equal to one, and after which the potential entrant drops out of the data set since the decision to enter has already been made.
Another variable that was based of plant data was the number of plants in a changwat. This variable contained the sum of the number of existing plants in each changwat in each year.
3.2. Gasoline Price Data
The source of the gasoline price data was the Energy Policy and Planning Office website. The data spans from 2004 to 2011. We used the price for ULG 95 gasoline, which is gasoline that has a 95 octane rating. The gasoline prices are national level prices and are measured in Baht per liter. Also from the Energy Policy and Planning Office was data for the cost of transport to each changwat. The transportation cost data was used to calculate the changwat-level gasoline price.
3.3. Policy Data
There were 4 different sources for policy variable data. One source was Thailand’s Energy Policy and Development Plan made in 2006. Another source was the report An Assessment of the Biofuels Industry in Thailand made for the United Nations Conference on Trade and Development. The third source was the report Sustainable Bioenergy created for the International Seminar on Sustainable Energy Development in Thailand: Options and Tools. The final source was Asian Development Bank report Status and Potential for the Development of Biofuels and Rural Renewable Energy. All of the policy variables were national-level policies. Binary variables were created from this based upon whether the policy was in effect during a certain year.
In this paper we examine the following policies: the 2002 tax break, the 2007 production rate, the 2008 Oil Palm Industrial Development Plan, and the 2006 energy plan. Table 1 describes the policies used in our analysis.
3.4. Feedstock Production Data
The source of feedstock production data for cassava and sugarcane was the Asian Development Bank report Status and Potential for the Development of Biofuels and Rural Renewable Energy. The data spans the years 2005 and 2006, and contains changwat-level production and area data.
Molasses data was obtained from the Office of the Cane and Sugar Board website. The duration of the data was from 1988 to 2007. The data was at the region level.
The source of feedstock production data for corn was the Bank of Thailand website. The data spans from January 2000 to December 2010. The data was converted to yearly data by taking the average of the monthly data. The production data for corn was national-level production measured in thousands of metric tons.
3.5. Natural Gas Price Data
The source of natural gas price data was the Energy Policy and Planning Office website. The data spans from 2002 to 2005. The data was converted to yearly data by taking the average of the applicable monthly data. The natural gas prices are national level prices and are measured in Baht per liter. Also from the Energy Policy and Planning Office was data for the transportation cost to each changwat. The transportation cost data was used to calculate the changwat-level natural gas price. The transportation cost for natural gas was assumed to be equivalent to that for petroleum.
3.6. Ethanol Price Data
The source of ethanol price data was the Energy Policy and Planning Office website. The data spans from January 2007 to November 2011. The ethanol prices are national-level prices and are measured in Baht per liter.
Summary statistics of the variables are presented in Table 2.
4. Methodology
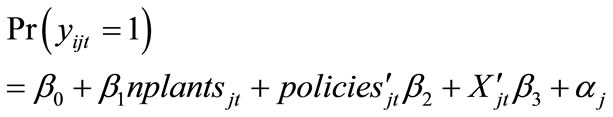
To analyze the effects of economic factors, strategic factors, and government policy on ethanol investment decisions, we use discrete response and fixed effects regression models. In all these regressions, the dependent variable is the probability 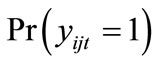 that the dummy
  for a potential entrant i in changwat j deciding to invest in an ethanol plant at time t is equal to 1. The regressors include the number of plants
  already in changwat j at time t; the vector of policy variables
 ; and the other exogenous regressors
 , which include gasoline price, ethanol price, natural gas price, and feedstock production.
We first run the following OLS model:
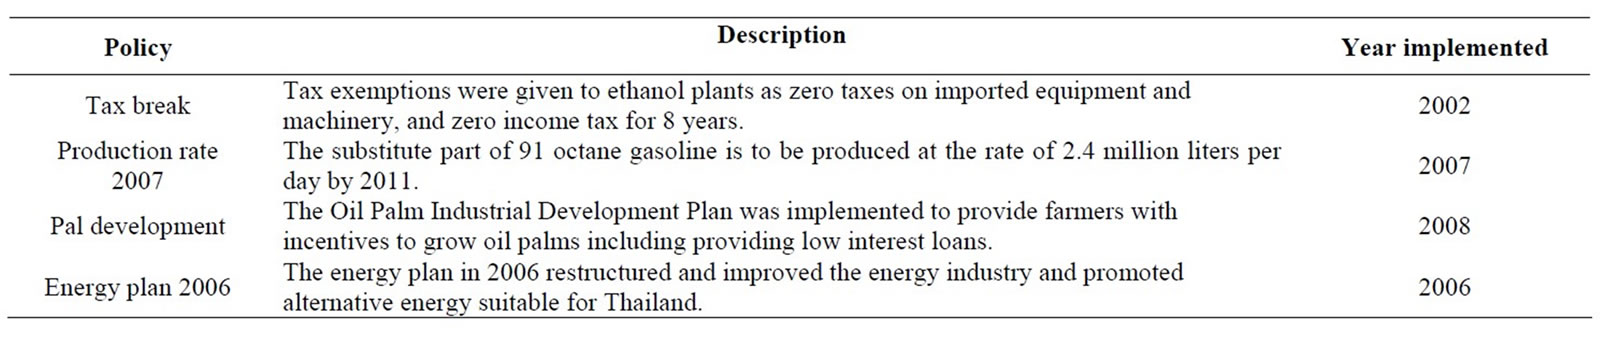
Table 1. Ethanol policies.
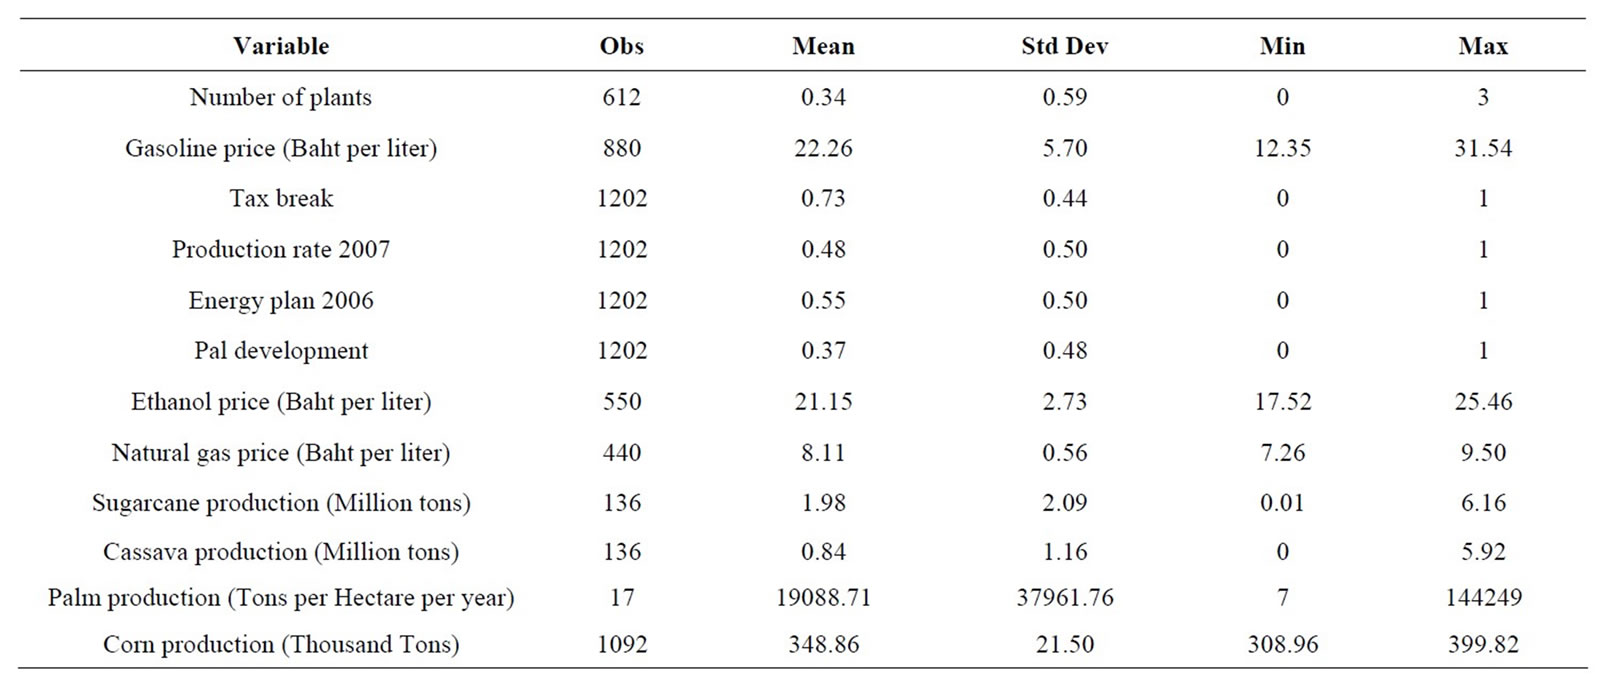
Table 2. Summary statistics.
 .
.
In this model, the coefficient  measures the change in the probability of investing if there was an additional ethanol plant in the changwat, holding all the other variables constant. If the coefficient
  is positive then as the number of plants in changwat increases the probability of investment increases, however, if the coefficient
  is negative then as the number of plants in changwat increases the probability of investment decreases.
  measures the net strategic effect of other plants.
  would have a positive coefficient if there is an agglomeration effect in which existing infrastructure or an experienced local labor force would increase the probability of investment in a particular changwat.
  would have a negative coefficient if there is a competition effect due to local competition with other plants in input and output markets [7-9].
The coefficient  measures the change in the probability of investing if each policy variable had been in place in a certain year. If the coefficient
  is positive for a particular policy, then having that policy in effect in a changwat increases the probability of investment; however, if the coefficient
  is negative, then having that policy in effect in a changwat decreases the probability of investment.
Second, we run the following logit model:
where  is the logistic cumulative distribution function.
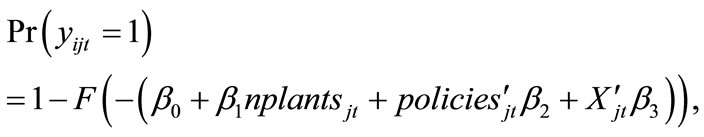
Third, we run the following probit model:
 where
where  denotes the standard normal cumulative distribution function.
Finally, we run the following fixed effects model:
where  is the fixed effect. We run the model using changwat fixed effects and also with region fixed effects.
Table 3 lists the changwats belonging to each region in Thailand.
5. Results
The regression results are presented in Table 4. We also
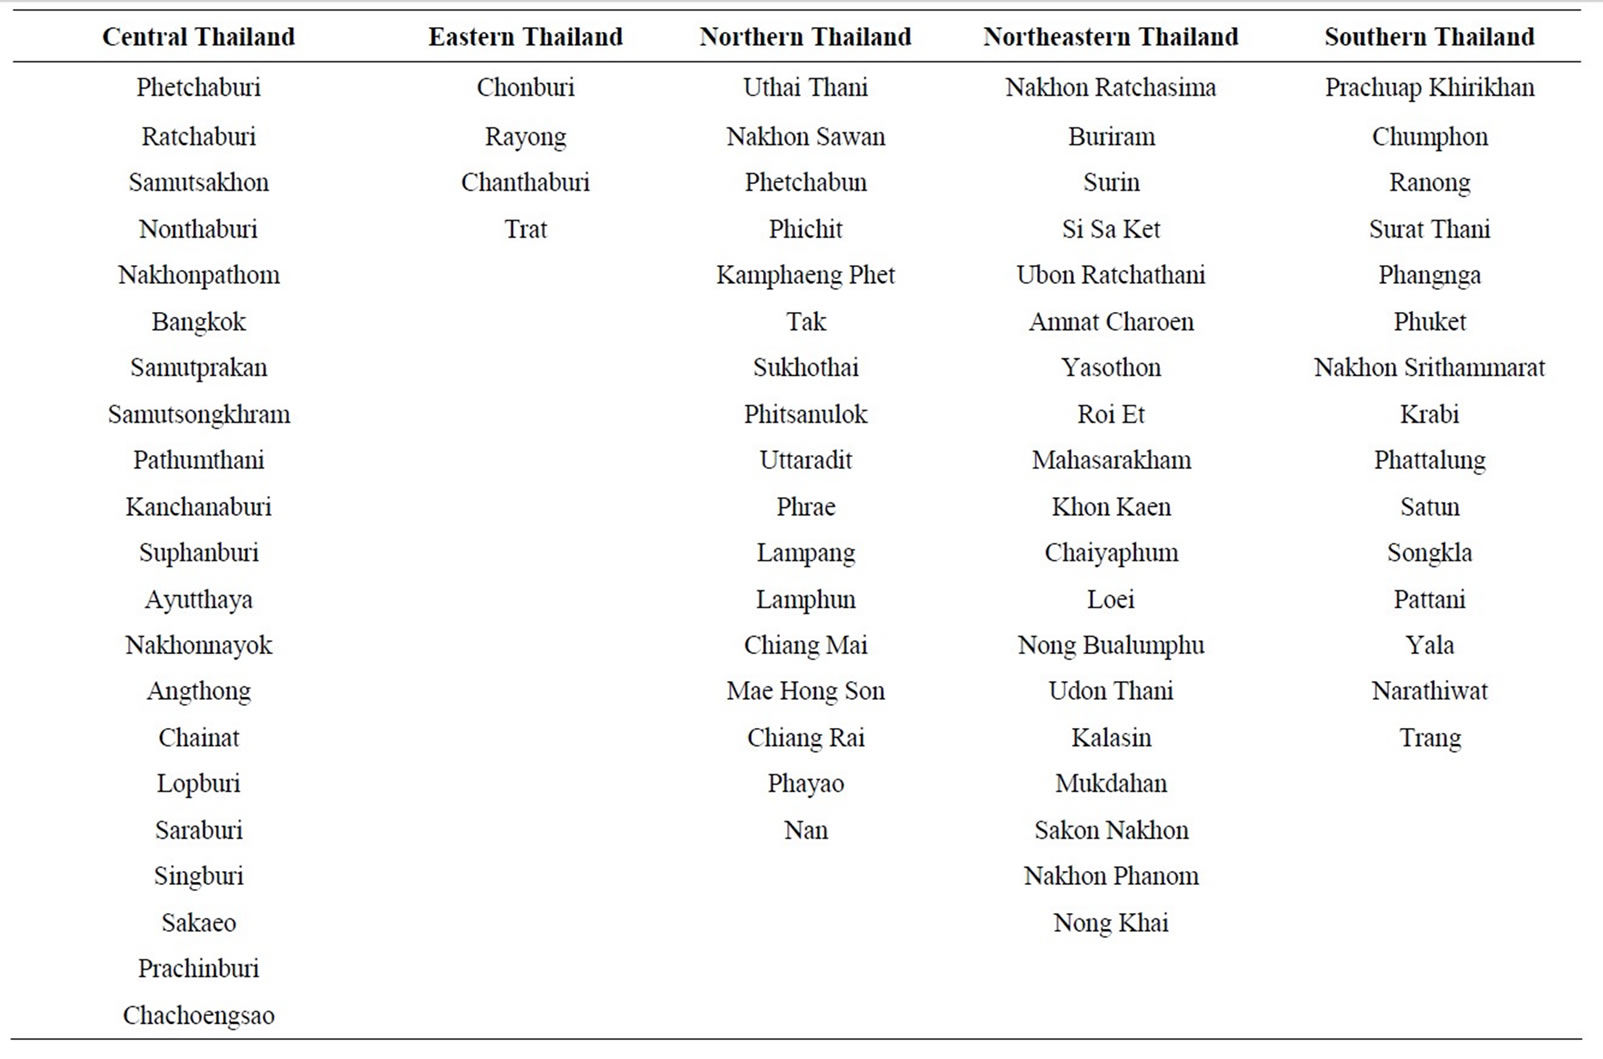
Table 3. Changwats by region.
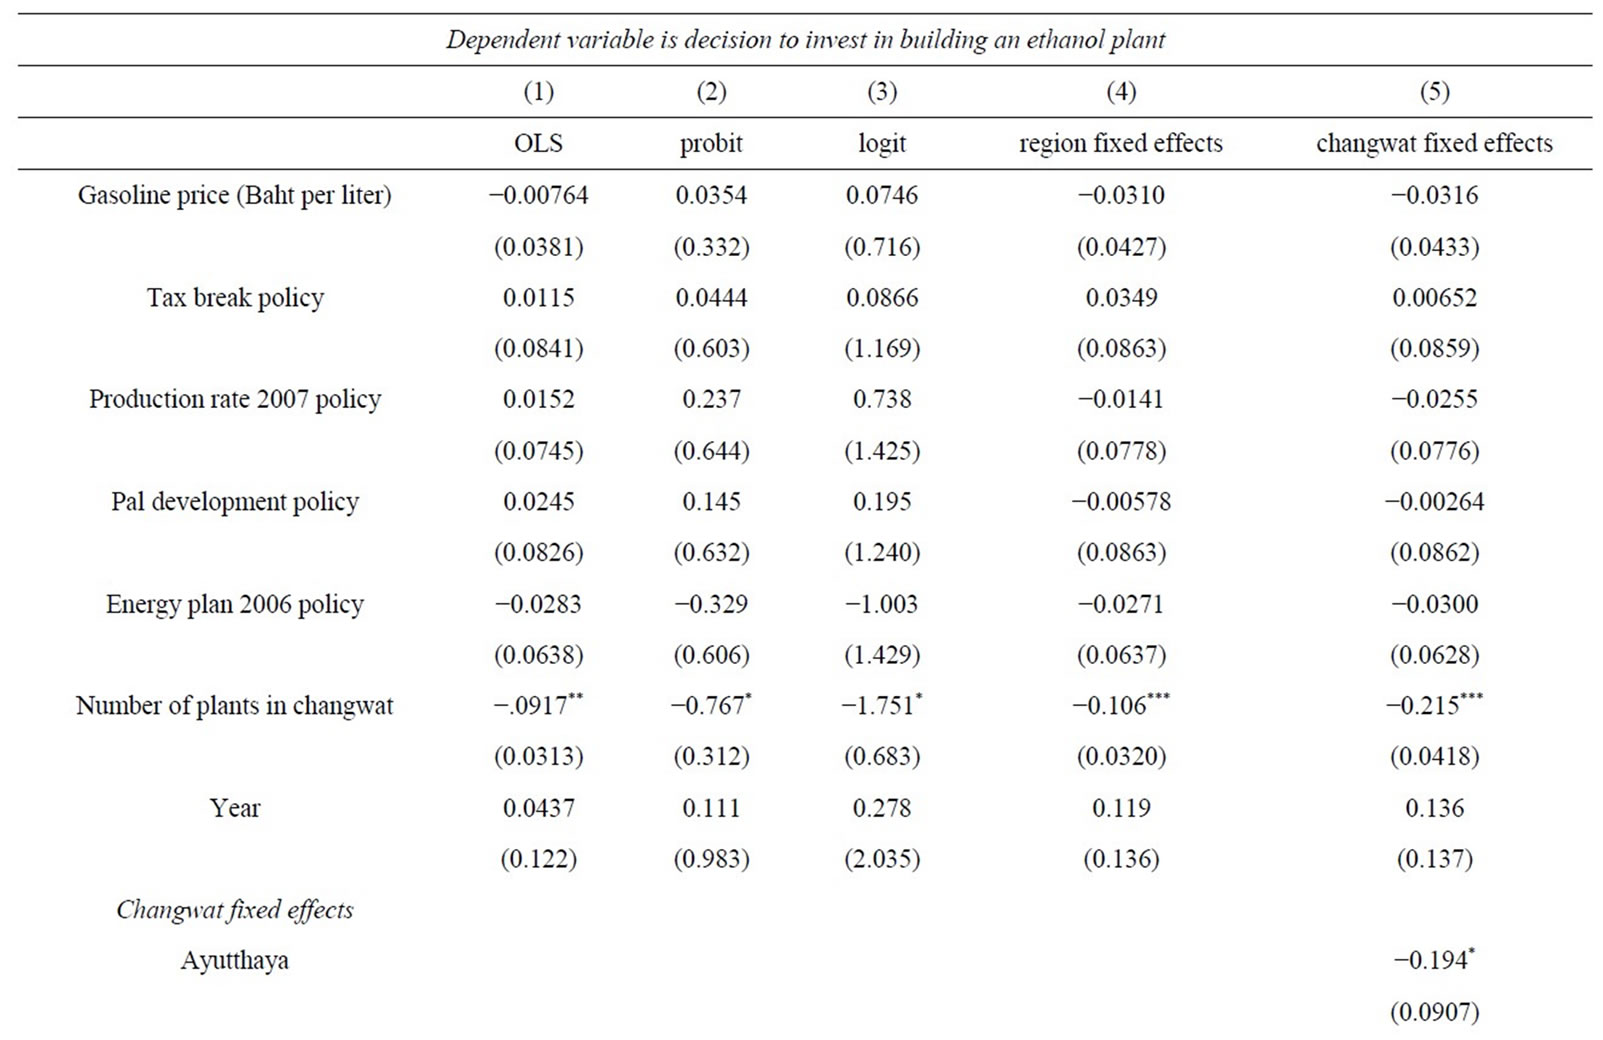
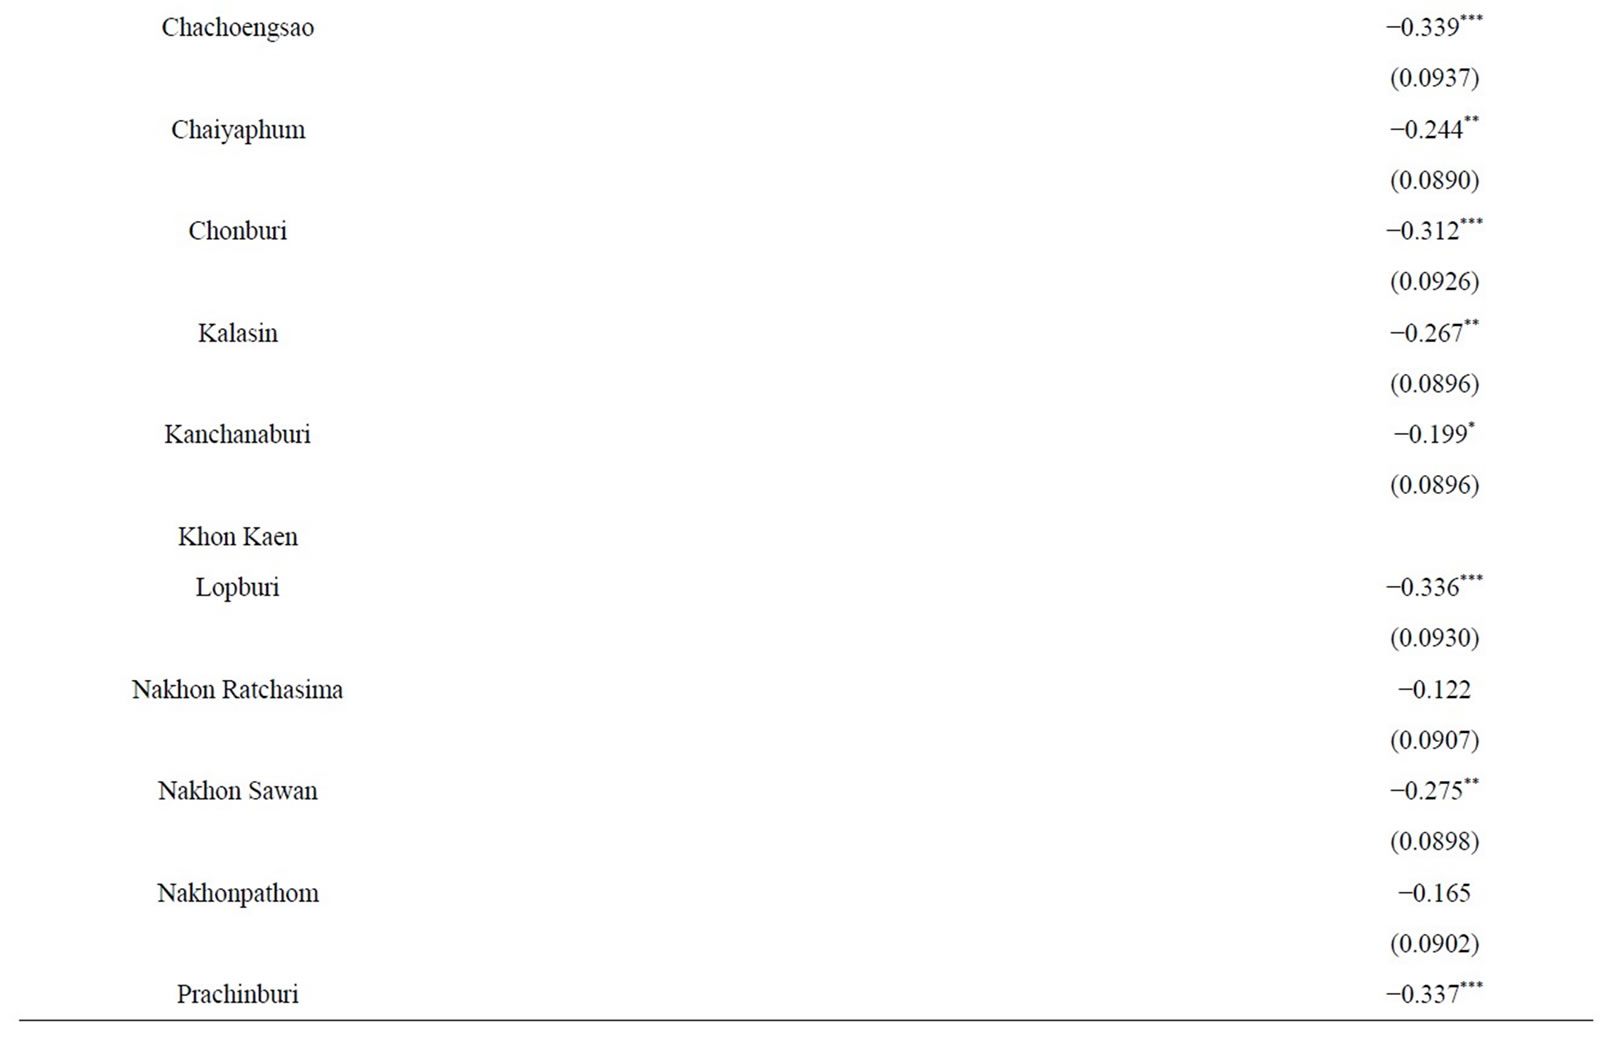
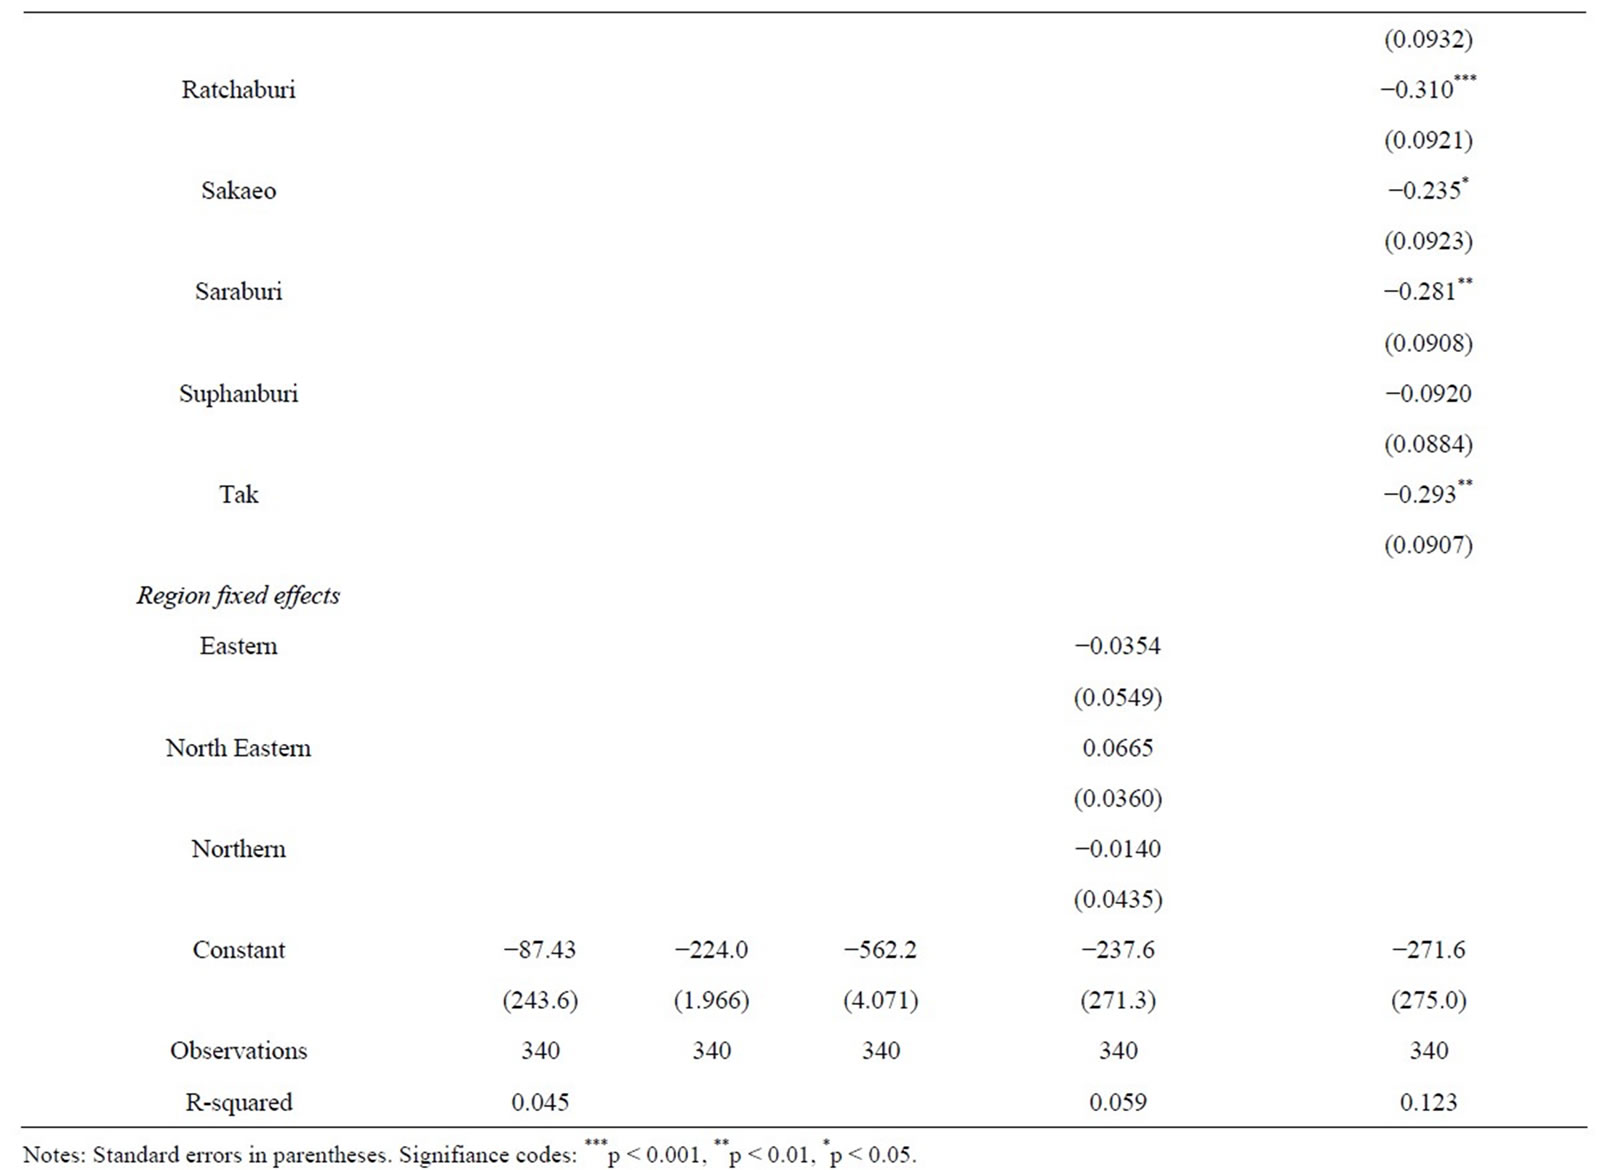
Table 4. Results.
ran regressions that included feedstock production, natural gas price and/or ethanol price, but because these variables were not significant and because the data for these variables were sparse and therefore their inclusion limited the number of observations in our regressions, we focus on and report the regressions without them.
According to the results, the only variable that has a consistently statistically significant effect on the decision to invest in building an ethanol plant is the number of plants already in the changwat. The negative statistically significant variable number of plants in changwat shows that means the competition effect dominates the agglomeration effect, which suggests that potential investors are deterred by local competition in input and output markets and that the potential benefits of existing infrastructure are not significant factors in the decision to invest.
The year variable in each model is significant positive. This means that the time trend is positive; the probability of investing in ethanol plants has increased over time.
In the fixed effect model some the changwats are also statistically significant. All the significant changwat fixed effects were negative. The changwats that were statistically significant with a negative coefficient were: Ayutthaya, Chachoengsao, Chaiyaphum, Chonburi, Kalasin, Kanchanaburi, Khon Kaen, Lopburi, Nakhon Ratchasima, Nakhon Sawan, Nakhonpathom, Prachinburi, Ratchaburi, Sakaeo, Saraburi, Suphanburi, and Tak. For these changwats, the probability of investing in building an ethanol was lower, all else equal.
6. Conclusions
This paper analyzes the effects of economic factors, strategic factors, and government policy on ethanol investment using discrete response and fixed effects regression models. Results show that the main factor that affects the decision to invest in building an ethanol plant in a particular changwat is the number of ethanol plants already in the changwat. The number of ethanol plants already in the changwat has a significant negative effect on the decision to invest in building an ethanol plant in a particular changwat, which suggests that potential investors are deterred by local competition in input and output markets. The input markets include the local feedstock markets and the output markets include the local ethanol market.
Our results show that feedstock prices, feedstock production, gasoline price, policies do not have a significant effect on the decision to invest in an ethanol plant in a changwat. Investors would more likely build ethanol plants in changwats that do not have ethanol plants or only have a small number of ethanol plants. Some of the changwats in Thailand are more likely to have ethanol plants than others. Since the time trend is also positive the overall probability of investment is increasing as well.
7. Acknowledgements
This research was supported by a grant from the Sustainable Transportation Center at the University of California at Davis, which receives funding from the U.S. Department of Transportation and Caltrans, the California Department of Transportation, through the University Transportation Centers program. This research was also supported by a grant from the Institute of Transportation Studies Multi-campus Research Program and Initiative on Sustainable Transportation. Lin is a member of the Giannini Foundation for Agricultural Economics. All errors are our own.
REFERENCES
- Rabobank International, “Biofuel: A Sustainable Energy in Thailand,” 2005. www.rabobank.com/far
- J. B. Gonsalves, “An Assessment of the Biofuels Industry in Thailand,” Conference on Trade and Development, Geneva, 19 September 2006, pp. 3-28. http://www.unctad.org/en/docs/ditcted20067_en.pdf
- P. Bhandhubayong, “Development of Ethanol as a Transportation Fuel in Thailand,” Environmental Research Institute, Riverside, 2003. www.eri.ucr.edu/ISAFXVCD/ISAFXVAF/DETFT.pdf
- S. Yoosi and C. Sorapipatan, “A Study of Ethanol Production Cost for Gasoline Substitution in Thailand and Its Competitiveness,” Thammasat International Journal of Science and Technology, Vol. 12, No. 1, 2007, pp. 69-80.
- S. Chirapanda, S. Techasriprasert, S. Pratummin, S. Jain and P. Wongtarua, “Strategies and Options for Integrating Biofuel and Rural Renewable Energy Production into Rural Agriculture for Poverty Reduction: Thailand,” Asian Development Bank, Manila, 2009.
- W. Amatayakul and G. Berndes, “Fuel Ethanol Program in Thailand: Energy, Agricultural, and Environmental Trade-Offs and Prospects for CO2 Abatement,” Energy for Sustainable Development, Vol. 11, No. 3, 2007, pp. 51-66. doi:10.1016/S0973-0826(08)60577-3
- C.-Y. C. Lin and F. Yi, “Ethanol Plant Investment in Canada: A Structural Model,” Working Paper, University of California at Davis, Davis, 2013.
- C.-Y. C. Lin and F. Yi, “What Factors Affect the Decision to Invest in a Fuel Ethanol Plant: A Structural Model of the Investment Timing Game in Europe,” Working Paper, University of California at Davis, Davis, 2013.
- C.-Y. C. Lin and K. Thome, “Investment in Corn-Ethanol Plants in the Midwestern United States: An Analysis Using Reduced-Form and Structural Models,” Working Paper, University of California at Davis, Davis, 2013.