Open Journal of Marine Science
Vol.4 No.2(2014), Article ID:44564,7 pages DOI:10.4236/ojms.2014.42008
Cell Size Dependent Responses of Phytoplankton Assemblages to Nitrate and Phosphate Additions in Surface Waters of the Northern South China Sea
Rong Yi1,2, Yehui Tan1, Shengfu Wang1, Pingping Shen1, Zhixin Ke1, Liangmin Huang1, Xingyu Song1*, Gang Li1*
1Key Laboratory of Tropical Marine Bio-Resources and Ecology, South China Sea Institute of Oceanology, CAS, Guangzhou, China
2University of the Chinese Academy of Sciences, Beijing, China
Email: *songxy@scsio.ac.cn, *ligang@scsio.ac.cn
Copyright © 2014 by authors and Scientific Research Publishing Inc.
This work is licensed under the Creative Commons Attribution International License (CC BY).
http://creativecommons.org/licenses/by/4.0/


Received 30 January 2014; revised 2 March 2014; accepted 21 March 2014
ABSTRACT
Bioavailability of nitrogen (N) and phosphorus (P) is known to affect marine phytoplankton physiology, thus influencing their primary productivity; and it’s of general interest to see how the N or/and P additions affect the differently cell-sized phytoplankton assemblages. Data from the northern South China Sea showed that P addition increased up to 6 times of total chl a content within 24 h in the estuarine water; and N+P addition increased more than 20 times of chl a within 144 h in the pelagic water. The P addition powered 18.0% and 149% increase in the carbon fixation of larger (>3 μm) and smaller (<3 μm) cell assemblies from the estuarine water, respectively; while the limited effects were observed between them in the pelagic water. Additions of N and P interactively increased the carbon fixation of both cell-sized assemblies in the pelagic water, but only small cell-sized fraction in the estuarine water. Moreover, the estuarine phytoplankton cells appeared to respond faster to the nutrient additions than the pelagic ones, and the smaller cells respond to a greater extent than their larger counterparts in the estuarine water but not in the pelagic water.
Keywords:Nutrient Addition; Carbon Fixation; Cell Size; Phytoplankton Assemblages; South China Sea

1. Introduction
In large areas of the South China Sea (SCS), the standing stock and production of phytoplankton are very low although there is ample light penetration to drive photosynthesis [1] . This paucity of biomass and production is usually thought to be resulted from the impoverished essential macro-nutrients of e.g. nitrogen or/and phosphorus within the euphotic zone, due to the permanent stratification of water column [2] [3] . This hypothesis is supported by the increase of biomass and production of phytoplankton that occurs episodically when mesoscale physical turbidity enhances the nutrient levels within the euphotic zone [2] [4] . For e.g. typhoon Kai-Tak of 2000 triggered an averaged 30-fold increase of surface chlorophyll a content through uplifting nutrients from the below mixed layer and relaxing phytoplankton from the nutrient limitation [2] . Similar increase of phytoplankton biomass by typhoon Damrey of 2005 was also observed in both the offshore and coastal waters, associated with the injection of nutrients into the euphotic zone [4] . Little has been concerned how the phytoplankton assemblages respond to the nutrient increase in the field conditions of the South China Sea.
The cell size of phytoplankton plays a vital role in determining the efficiency of element or energy transfer in marine food webs, thus the production of higher trophic levels [5] ; it also varies greatly in the temporal and spatial scales [6] -[8] . The differently cell-sized phytoplankton often have different capacities of nutrients/energy requirements [9] [10] , photosynthetic carbon fixation [11] as well as tolerance to light stress [1] . For e.g. smaller cells utilize nutrients and light energy more efficiently than larger ones, due to their higher biomass-normalized metabolic rates associated with higher surface to volume ratios [9] , thus leading to their dominances in the oligotrophic oceans as well as the deep sea water [12] . The smaller cells also have lower photosynthetic capacities as compared to the larger ones [1] [11] and are more vulnerable to photoinhibition if based on DNA damage [13] or carbon fixation reduction [1] [14] . To what extent the smaller and larger cells respond differently to the nutrient additions is still unclear, although it is important to understand the effects of increasing eutrophications upon the phytoplankton communities. In this paper, we showed the effects of nitrate or/and phosphate additions on the biomass and carbon fixation of differently cell-sized phytoplankton assemblages from the surface waters of the northern South China Sea.
2. Materials and Methods
2.1. Sampling Protocol
The experiments were carried out on board of R/V “Shiyan III” in the South China Sea (SCS) during a cruise dated from September 8 to 15 of 2010. A total of four stations were settled in the Pearl River estuary and SCS pelagic waters (Figure 1) wherein the nutrient levels differed greatly (Table 1). During the cruise, surface seawater with phytoplankton assemblages was collected with a 15 L acid-cleaned (1 N HCl) polycarbonate carboy.
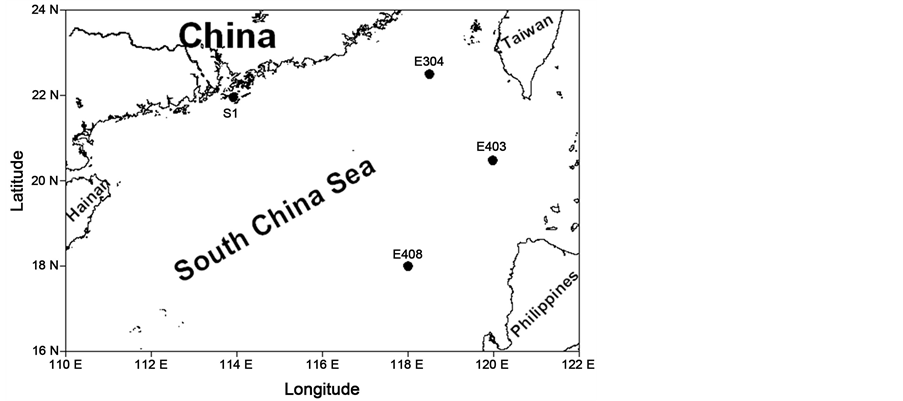
Figure 1. Sampling stations (black circles) during the cruise dated from September 8 to 15 of 2010 in the South China Sea.

Table 1. Physical, chemical and biological characters of the sampling sites from September 8 to 15 of 2010: temperature (Temp, ˚C), salinity (Sal) and nutrient concentrations (μmol∙L−1) of nitrate , nitrite
 , ammonium
 , phosphates
  and silicate
 , as well as phytoplankton biomass (chl a, μg∙L−1) and proportion (%) of <3 μm cell fraction.
The collected water samples were used immediately (within 15 min) for the nutrient addition experiments and determinations of phytoplankton chlorophyll a (chl a) content as well as background nutrient levels as described below.
2.2. Nutrient Addition Experiments
Two sets of experiments were performed to examine the effects of nitrate or/and phosphate additions on phytoplankton assemblages. Firstly, the collected seawater from each station was pre-filtrated through a 180 μm pore-size mesh (to remove most zooplankton) and dispended into 2.5 L polycarbonate bottles, implementing with 3 nutrient treatments (triplicate for each): a) enriched with nitrate (N) to final 10 μmol∙L−1, b) enriched with phosphate (P) to final 1.0 μmol∙L−1, and c) enriched with N and P (N + P) to the same level as above. Three bottles were set as control without any nutrients addition. After the aforesaid treated, all the 12 bottles from each station were incubated for 4 days (144 h) in a shade-free water tank with the flowing-through surface seawater to control temperature to similar as SST. After 24, 48, 96 and 144 h incubations, 400 ml sample was collected from each bottle to determine chl a concentration as described below, and the chl a was also measured ahead the incubations. Secondly, the pre-filtrated samples were put into 250 ml polycarbonate bottles, with 3 nutrient treatments and one control (triplicate for each) as described above. A 500 μl of 5 μCi (0.185 MBq) NaH14CO3 solution (ICN Radiochemicals, USA) was inoculated to each bottle, and all the bottles with samples were incubated for 24 h in the aforesaid tank. Duplicate bottles of each treatment and control were wrapped in black foil and incubated as dark samples. After the incubations, each sample was sequentially filtered onto a 3 μm poresize polycarbonate filters (25 mm in diameter, Osmonics Inc.) and 0.7 μm pore-size glass fiber filter (25 mm in diameter, Whatman GF/F), which were frozen immediately and stored at −20˚C for later analysis. The frozen filter was then placed into a 20 ml scintillation vial, thawed and inoculated with 0.5 ml of 0.5 mol∙L−1 HCl, and left uncapped for 24 h to expel the non-fixed 14C in a fume hood. A 5 ml scintillation cocktail was added to each vial and the radioactivity was measured with a liquid scintillation counter (LS 6500, Beckman Coulter, USA). The photosynthetic carbon fixation was calculated following the JGOFS 14C-protocol [15] .
2.3. Chlorophyll a Analyses
Ahead or during the incubation experiments, 400 ml water samples were filtered onto a Whatman GF/F filter that was wrapped in aluminum foil, frozen and stored at −20˚C for later analysis. Chl a content was measured by fluorescence with a Turner Design 10 fluorometer after a complete extraction with 90% acetone (v/v) overnight in darkness at −20˚C [16] . To determine the <3 μm cell-sized fraction, the water sample was pre-filtrated through a 3 μm pore-size polycarbonate filter, then filtered onto a 0.7 μm pore-size glass fiber filter and the chl a was measured the same as above.
2.4. Environmental Parameters
The temperature and salinity of the sampling sites were obtained with a multi-parameter water quality monitor sonde (YSI 6600, Yellow Springs Instruments, USA). The background concentrations of nitrate ( ), nitrite (
 ), phosphate (
 ) and silicate (
 ) were analyzed with a nutrient auto-analyzer (Quickchem 8500, Lachat Instruments, USA) [17] . This equipment has been calibrated regularly with the help of the manufacturer against CSK standard solutions.
2.5. Statics
Mean and standard deviations were calculated and presented in the figures. One way ANOVA was used to determine the significant differences between the treatments.
3. Results
The field environmental factors and phytoplankton biomass (chl a) are shown in Table 1. Contents of nitrogen ( ,
, and
and ) and silicate (
 ) were significantly higher at S1 station, as compared to other stations; while the phosphate (
 ) displayed no significant differences among the four stations. Chl a biomass at S1 station was 3.07 μg∙L−1, being approximately 20 times as high as the others, whereas the proportion of <3 μm cell-sized fraction (15%) was only one-fifth (Table 1).
Phytoplankton biomass increased significantly after the nutrient additions (Figure 2). At S1 station that is located in the estuary (Figure 1), approximately 6 times increase of chl a from 5.9 to 42.9 μg∙L−1 occurred within 24 h after the phosphate (P) addition but without any significant increase present by the nitrate (N) addition (Figure 2(A)), mirroring the P limitation on the growth of phytoplankton in this estuarine water. Limited effects of N or P additions were observed upon phytoplankton growth at other sites i.e. E408 and E304; however, the interactive effects of N and P additions occurred, with 24 and 56 times increase in chl a biomass within 144 h, from 0.18 to 4.5 μg∙L−1 and from 0.15 to 8.6 μg∙L−1, respectively (Figures 2(B) and (C)). More importantly, the response time indicated by the time point of starting up of chl a increase delayed to 48 h and 96 h at respectively E408 and E304, reflecting a slower response of phytoplankton from the pelagic water than that from the estuarine water.
Photosynthetic carbon fixation of phytoplankton assemblages were significantly enhanced by the nutrient
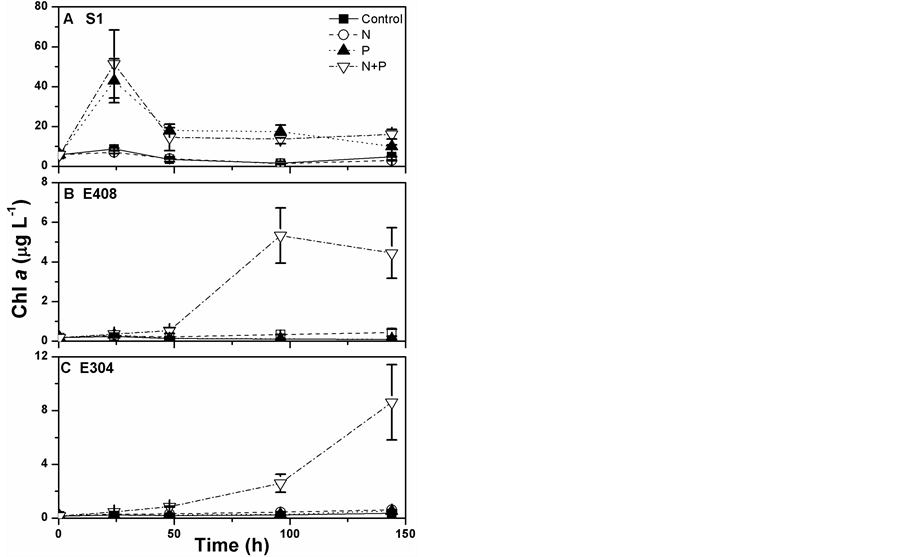
Figure 2. Changes in phytoplankton biomass (chl a, μg∙L−1) as the cultured time (h) under the conditions with or without nutrient additions at the stations: A) S1, B) E408 and C) E304. Vertical bars represent the standard deviations (n = 3).
additions in most of the stations (Figure 3). In particular in estuarine water (S1 station), P addition increased up to 18.0% and 149% of the carbon fixation of >3 μm and <3 μm cell-sized phytoplankton assemblies, respectively; but less effects were observed in the pelagic water (Figures 3(E) and (F)). The N addition had no significant promotion upon the carbon fixation of both cell-sized fractions, neither in the estuarine nor in the pelagic waters. However, additions of N and P interactively increased the carbon fixation, especially in the pelagic water e.g. at E304 where the promotions were 20.2% and 11.2% for >3 μm and <3 μm cell-sized assemblies, respectively (Figures 3(E) and (F)). Moreover, the combined effects by N and P additions were merely observed on the smaller cell-sized fraction in the estuarine water.
4. Discussion
Types of nutrients limitation on phytoplankton growth often varied spatially, e.g. shift from Pto N-limitation
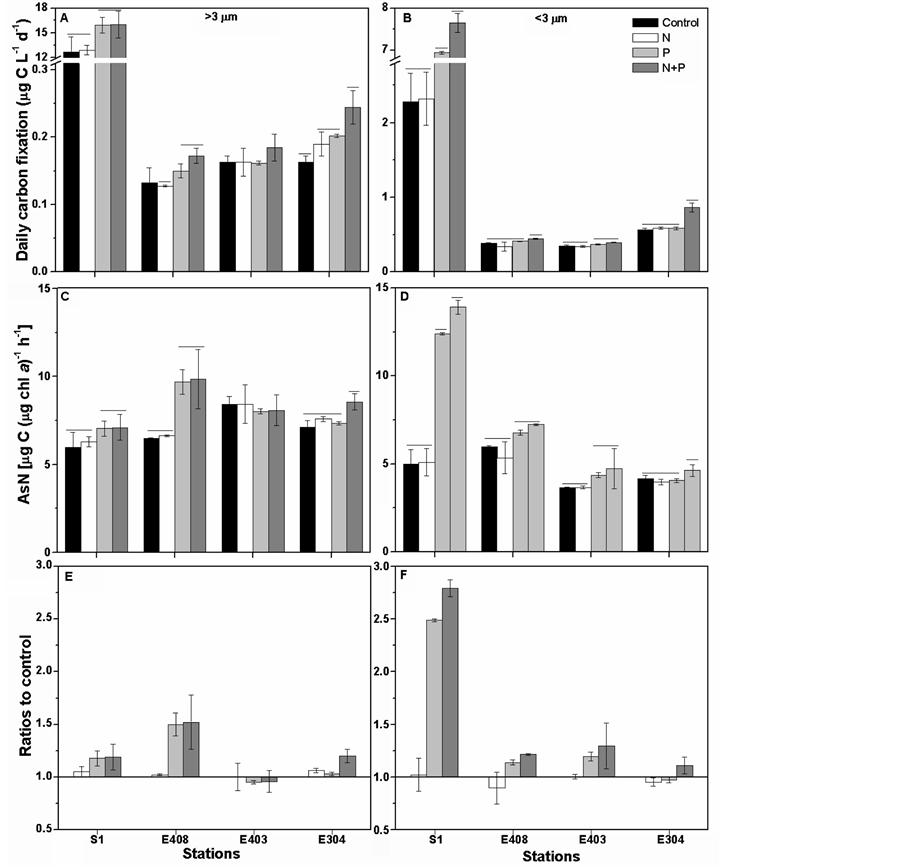
Figure 3. ((A), (B)) Daily carbon fixation (μg C L−1∙d−1) of phytoplankton assemblages in >3 μm or <3 μm cell-sized fractions under different nutrient additions, ((C), (D)) photosynthetic carbon fixation rate [AsN, μg C (μg chl a)−1∙h−1] of >3 μm or <3 μm cell-sized fractions and ((E), (F)) the ratios of treatments of nutrient additions to control of >3 μm or <3 μm cell-sized fractions. The vertical bars represent the standard deviations (n = 3); whereas the horizontal bars indicate the significant differences (p < 0.05).
across the Pearl River plume [18] . Being consistent with these results, P addition sharply increased the phytoplankton biomass of this estuary, but not in the pelagic water of the South China Sea (Figure 2). Our results also give a new perspective that the N and P additions interactively increased the chl a biomass in the pelagic water (Figures 2(B) and (C)). Usually, very low N and P contents prevail over the surface water of the South China Sea, even under the detectable limits [19] ; while the additions of solely N or P had no profound effects on phytoplankton growth (Figures 2(B) and (C)), which might be accounted for by the extremely high or low N:P ratios after the N or P additions (i.e. 67 ± 9 and 2.3 ± 0.6, Table 1) since the well growth of phytoplankton cells needs a proper N:P ratio of 16:1 [20] . The nutrient enrichments can alter phytoplankton species compositions [10] [21] , it might also be one of the causes for the changes of chl a biomass (Figure 2); unfortunately, we did not check if the species changed during our incubations.
Phytoplankton with different cell-size usually showed differential physiological behaviors to the changes in environmental factors [6] [10] [11] . For e.g., the smaller cells showed more susceptibility to the solar UVRcaused damages on their DNA molecules, compared to the larger ones [13] . The smaller cells (<3 μm) have also been detected to respond faster and to a greater extent to the increases of nutrient levels as compared to their larger counterparts (<3 μm) if based on the chl a biomass [9] [21] or carbon fixation (Figure 3), thus leading to the spatial variations in primary productivity [12] . Apart from the differences in the cell-sized fractions, the stability of water column wherein phytoplankton lives also affects their responses to the environment changes [6] . For e.g. the results by Li et al. [22] indicated that phytoplankton assemblages were more sensitive to the photoinhibition after typhoon, due to disturbance of the stratification of water column as well as the changes of phytoplankton cell communities. Moreover, the coastal phytoplankton assemblies are detected to respond faster to nutrient additions than the offshore assemblies (Figure 2). Actually, both the coastal and offshore phytoplankton have started up to respond to the nutrient changes immediately (within one day) after N and P additions if based on the carbon fixation (Figure 3); however, the changes of chl a biomass to a detectable level might need more time due to the slower accumulation of organic matters within cells, thus resulting in an insignificant difference between the treated samples and controls during the first two days (Figures 2(B) and (C)). Based on our data, the effects of increasing eutropications on phytoplankton would differ greatly in the spatial scale if considering the variations of community structure and the differential responses of different cell-sized phytoplankton to the nutrient changes.
Acknowledgements
We are very thankful for the comments of the anonymous reviewers that helped to improve our manuscript. This work was supported by the CAS Strategic Pilot Science and Technology (XDA11020200, XDA05030403); the National Project of Basic Sciences and Technology (2012FY112400, 2013FY111200); the National Natural Science Foundation of China (41130855, 41206132, 41276162, 41276161); and the CAS Knowledge Innovation Program (SQ201115). Thanks are also given to the sharing cruise of NNSFC and open cruise of SCSIO and to the captain and crews of Shiyan III for their logistic support during our experiments.
References
- Li, G., Gao, K. and Gao, G. (2011) Differential Impacts of Solar UV Radiation on Photosynthetic Carbon Fixation From the Coastal to Offshore Surface Waters in the South China Sea. Photochemistry and Photobiology, 87, 329-334. http://dx.doi.org/10.1111/j.1751-1097.2010.00862.x
- Lin, I.I., Liu, W.T., Wu, C.C., Wong, G.T.F., Hu, C., Chen, Z., Liang, W.D., Yang, Y. and Liu, K.K. (2003) New Evidence for Enhanced Ocean Primary Production Triggered by Tropical Cyclone. Geophysical Research Letter, 30, 1718. http://dx.doi.org/10.1029/2003GL017141
- Ning, X., Chai, F., Xue, H.F., Cai, Y., Liu, C. and Shi, J. (2004) Physical Biological Oceanographic Coupling Influencing Phytoplankton and Primary Production in the South China Sea. Journal of Geophysical Research, 109, C10005. http://dx.doi.org/10.1029/2004JC002365
- Zheng, G. and Tang, D. (2007) Offshore and Nearshore Chlorophyll Increases Induced by Typhoon Winds and Subsequent Terrestrial Rainwater Runoff. Marine Ecology Progress Series, 333, 61-74. http://dx.doi.org/10.3354/meps333061
- Finkel, Z.V., Beardall, J., Flynn, K.J., Quigg, A., Rees, T.A.V. and Raven, J.A. (2010) Phytoplankton in a Changing World: Cell Cize and Elemental Stoichiometry. Journal of Plankton Research, 32, 119-137. http://dx.doi.org/10.1093/plankt/fbp098
- Raven, J.A. (1998) Small Is Beautiful: The Picophytoplankton. Functional Ecology, 12, 503-513. http://dx.doi.org/10.1046/j.1365-2435.1998.00233.x
- Chang, F.H., Zeldis, J., Gall, M. and Hall, J. (2003) Seasonal and Spatial Variation of Phytoplankton Assemblages, Biomass and Cell Size from Spring to Summer across the North-Eastern New Zealand Continental Shelf. Journal of Plankton Research, 25, 737-758. http://dx.doi.org/10.1093/plankt/25.7.737
- Li, W.K.W. (2002) Macroecological Patterns of Phytoplankton in the Northwestern North Atlantic Ocean. Nature, 419, 154-157. http://dx.doi.org/10.1038/nature00994
- Raven, J.A. and Kübler, J.E. (2002) New Light on the Scaling of Metabolic Rate with the Size of Algae. Journal of Phycology, 38, 11-16. http://dx.doi.org/10.1046/j.1529-8817.2002.01125.x
- Mei, Z., Finkel, Z.V. and Irwin, A.J. (2011) Phytoplankton Growth Allometry and Size-dependent C:N Stoichiometry Revealed by Avariable Quota Model. Marine Ecology Progress Series, 434, 29-43. http://dx.doi.org/10.3354/meps09149
- Li, G. and Gao, K. (2013) Cell Size-Dependent Effects of Solar UV on Primary Production in Coastal Waters of the South China Sea. Estuaries and Coasts, 36, 728-736. http://dx.doi.org/10.1007/s12237-013-9591-6
- Li, G., Huang, L., Liu, H., Ke, Z., Lin, Q., Ni, G., Yin, J., Li, K., Song, X., Shen, P. and Tan, Y. (2012) Latitudinal Variability (6˚S-20˚N) of Early-Summer Phytoplankton Species Compositions and Size-Fractioned Productivity from Java Sea to South China Sea. Marine Biology Research, 8, 163-171. http://dx.doi.org/10.1080/17451000.2011.615323
- Helbling, E.W., Buma, A.G.J., De Boer, M.K. and Villafañe, V.E. (2001) In Situ Impact of Solar Ultraviolet Radiation on Photosynthesis and DNA in Temperate Marine Phytoplankton. Marine Ecology Progress Series, 211, 43-49. http://dx.doi.org/10.3354/meps211043
- Laurion, I. and Vincent, W.F. (1998) Cell Size versus Taxonomic Composition as Determinants of UV-Sensitivity in Natural Phytoplankton Communities. Limnology and Oceanography, 43, 1774-1779.
- Knap, A., Michaels, A., Close, A., Ducklow, H. and Dickson, A. (1996) Protocols for the Joint Global Ocean Flux Study (JGOFS) Core Measurements. JGOFS Report No. 19, Reprint of the IOC Manuals and Guides No. 29, UNESCO, Paris, 43-90.
- Parsons, T.R., Maita, Y. and Lalli, C.M. (1984) A Manual of Chemical and Biological Methods for Seawater Analysis. Pergamon Press, Toronto, 1-173.
- Kirkwood, D.S., Aminot, A. and Carlberg, S.R. (1996) The 1994 QUASIMEME Laboratory Performance Study: Nutrients in Seawater and Standard Solutions. Marine Pollution Bulletin, 32, 640-645. http://dx.doi.org/10.1016/0025-326X(96)00076-8
- Yin, K., Qian, P., Wu, M.C.S., Chen, J., Huang, L., Song, X. and Jian, W. (2001) Shift from P to N Limitation of Phytoplankton Biomass across the Pearl River Estuarine Plume during Summer. Marine Ecology Progress Series, 221, 17-28. http://dx.doi.org/10.3354/meps221017
- Chen, C.T.A., Wang, S.L., Wang, B.J. and Pai, S.C. (2001) Nutrient Budgets for the South China Sea Basin. Marine Chemistry, 75, 281-300. http://dx.doi.org/10.1016/S0304-4203(01)00041-X
- Redfield, A. (1958) The Biological Control of Chemical Factors in the Environment. American Scientist, 46, 205-221.
- Marañón, E., Cermeño, P., López-Sandoval, D.C., Rodríguez-Ramos, T., Sobrino, C., Huete-Ortega, M., Blanco, J.M. and Rodríguez, J. (2013) Unimodal Size Scaling of Phytoplankton Growth and the Size Dependence of Nutrient Uptake and Use. Ecology Letters, 16, 371-379. http://dx.doi.org/10.1111/ele.12052
NOTES

*Corresponding authors.