Open Journal of Clinical Diagnostics
Vol.3 No.1(2013), Article ID:28796,5 pages DOI:10.4236/ojcd.2013.31003
Computed tomography perfusion measurements for definition of lesions in early acute stroke*
SHAPE \* MERGEFORMAT ![]()
1Radiology Department, Riga Stradins University, Riga, Latvia
2Institute of Diagnostic Radiology, Paula Stradins Clinical University Hospital, Riga, Latvia
3Neurology Department, Paula Stradins Clinical University Hospital, Riga, Latvia
Email: mradzina@gmail.com
Received 8 February 2013; revised 9 March 2013; accepted 17 March 2013
Keywords: Brain; Computed Tomography; Perfusion; Acute Stroke
ABSTRACT
Background: Perfusion computed tomography (CT) is an evolving technique in the diagnosis of acute stroke. After complex deconvolution algorithms, perfusion color maps-cerebral blood flow (CBF), cerebral blood volume (CBV), and mean transit time (MTT)— are produced, they give visual confirmation of perfusion deficit in ischemic area, but some discrepancies exist regarding this technique in reliability of quantitative detection of tissue viability: penumbra (tissue at risk) that surrounds core (necrosis). Purpose: The purpose of this prospective study was to define brain tissue viability grade on the basis of the perfusion CT parameters in acute stroke patients. Material and Methods: Multimodal CT imaging protocol (unenhanced CT of the brain, CT angiography of head and neck blood vessels, followed by brain perfusion CT and 24 hours follow-up brain CT) was performed. Perfusion deficit was detected first visually, with subsequent manual quantitative and relative measurements in affected and contra-lateral hemisphere in 87 patients. Results: Visual perfusion deficit on perfusion CT images was found in 78 cases (38 female, 40 male; mean age 30 - 84 years): penumbra lesion (n = 49) and core lesion (n = 42). Both lesion types were detected by increased MTT on perfusion CT map, penumbra area showed mean values 202.40% (113% - 345% ± 57.17) and core (41% - 320% ± 64.53) in comparison to contra-lateral hemisphere. CBV mean values in penumbra group were increased up to 113.10% (45% - 276% ± 36.29) and in core decreased till 41.82% (3% - 107% ± 27.09). CBF values were decreased up to 65.63% (31% - 137% ± 22) in penumbra lesion and markedly decreased till 25.94% (4% - 79% ± 17.35) in core. Conclusion: Our study shows that perfusion CT measurements relative threshold values are recommended in definition of penumbra and core lesions in acute stroke patients.
1. INTRODUCTION
At present, timely brain imaging and interpretation remains critical to the fast evaluation and diagnosis of patients with potential ischemic strokes. Perfusion computed tomography (CT) is playing an increasing role in the initial evaluation of acute stroke. Cerebral hemodynamic status can be provided by perfusion color maps —cerebral blood flow (CBF), cerebral blood volume (CBV), and mean transit time (MTT)—that are produced after complex calculation. The technique gives quantitative, reproducible and timely evaluation of cerebral perfusion. These maps give visual confirmation of perfusion deficit in ischemic area, but some discrepancies exist regarding this technique in reliability of quantitative detection of tissue viability: penumbra (tissue at risk) that surrounds core (necrosis) [1]. Despite discrepancy in different studies, perfusion CT has been used frequently as diagnostic for cerebral ischemia and with more defined threshold values it may be used also as parameter in optimal treatment selection [2].
2. AIM OF THE STUDY
The purpose of this study was to define brain tissue viability grade on the basis of the perfusion CT parameters in acute stroke patients and determine relative threshold values.
3. MATERIAL AND METHODS
3.1. General
As a prospective selected cohort study multimodal CT imaging protocol (unenhanced CT of the brain, CT angiography of head and neck blood vessels, followed by brain perfusion CT and 24 hours follow-up brain CT) was performed in 87 patients (average age 77 years, 54 female, 34 male) within 9 hours (average 3.5 - 4.5 hours) after onset of acute ischemic stroke symptoms, admitted to emergency department. Diagnostic imaging was performed using 64 row multislice CT scanner during period of January 2011 till July 2012 with standardized protocol and safe ionizing radiation exposure.
3.2. Exclusion Criteria
Patients with hemorrhagic stroke or ischemic area seen on unenhanced CT were not included in study, as well as wake up strokes with unknown exact onset time.
3.3. CT Protocols
The patients were examined using a 64 row multislice CT system (General Electric Light Speed VCT XT 64). Multimodal CT protocol included unenhanced CT of the brain (CT), CT angiography (CTA), followed by brain perfusion CT (CTP) and follow-up brain CT after 24 hours.
Non-enhanced CT was performed as routine protocol with axial scans from level of C1-C2 vertebral body till vertex with radiation exposure 120 kV un 250 mA, at the cranial basis scans with 2.5 mm slice thickness, supratentorial part with slice thickness of 5 mm, average 40 images.
CT angiography was done from aortic arch to the vertex after intravenous administration of iodine contrast media bolus 80 - 100 ml with speed of 5 ml per second and following saline flush 40 ml. Test mode was used to acquire individual optimal contrast enhancement in the aortic arch. CTA examination was performed in thin slice technique 0.625 mm, 120 kV, 300 - 800 mA, speed 0.5 - 0.7 sec per rotation), on average 500 - 600 images obtained.
Examination was followed by perfusion CT imaging, the optimal area was determined by clinical symptoms and should included circle of Willis. After intravenous bolus administration of iodine contrast media 40 ml with rate 5 ml per second, followed by saline flush 20 ml, a dynamic repeated series in the brain area of 4 cm thickness above cranial basis were acquired during 50 seconds. Average 712 images obtained, including 8 levels.
3.4. Image Processing
All multimodal CT images were analyzed on Advantage Workstation version 4.4 (General Electric). CT and CTA images were evaluated in specified postprocessing software and resulted in reformated images, showing vessel occlusion site and extracranial blood vessel changes.
Acquired perfusion CT data (8 levels, 712 images for each person) were analyzed by semi-automated deconvolution method [3,4], using postprocessing software, relying on conclusion that time based variables are the most reliable perfusion parameters when intravascular tracking tracers are used [5]. Subsequently, manual quantitative and relative measurements were performed in affected and contra-lateral hemisphere, drawing standardized region of interest (ROI) in the manually selected reference artery (anterior cerebral artery) and vein (sagittal superior sinus) as suggested in previous studies [6,7]. Perfusion deficit was detected first visually, using three perfusion color maps: mean transit time (MTT) in seconds, cerebral blood flow (CBF) as ml per 100 grams of brain tissue per minute and cerebral blood volume (CBV) as ml per 100 grams of brain tissue. Defined quantitative and relative measurements were performed in affected and contra-lateral hemisphere, drawing standardized region of interest (ROI) in the manually selected defect region and defining values by two groups for penumbra (potential reversible) and core (irreversible) lesions (see Figure 1 for an illustration of the results).
3.5. Data Analysis
Data analysis was performed using Excel 2003 (Microsoft) and the Statistical Package for the Social Sciences (SPSS, version 19). Descriptive statistics were used for calculating mean values and standard deviations of the samples and measurements. The Kolgomorov-Smirnov test was used to determine the normal data distribution, as most of the study variables did not meet the normal distribution (p < 0.05), the nonparametric tests were used. Groups were compared by independent variable test and Chi square test. Comparison was determined by comparing means or using multiple variable correlation methods (Spearmen’s correlation and exact Fisher’s test).
A p value of less than 0.05 was considered as confirming statistically significant difference.
4. RESULTS
Focal brain perfusion deficit on perfusion CT images was found in 78 cases (38 female, 40 male; mean age 30 - 84 years). Two groups of lesions were found: penumbra lesion (n = 49) was defined as CBF and CBV map mismatch, core lesion (n = 42) defined by CTP parameter CBF and CBV map lesion area match that corresponded to MTT map lesion area and clinical symptoms.
Technically impaired exams with motion artifacts (n = 5) and perfusion maps without visual perfusion lesion were excluded from further detailed analysis (n = 4).
Both lesion types first were detected by increased MTT values on perfusion CT map, penumbra area showed mean values 202.40% (113% - 345% ± 57.17) and core
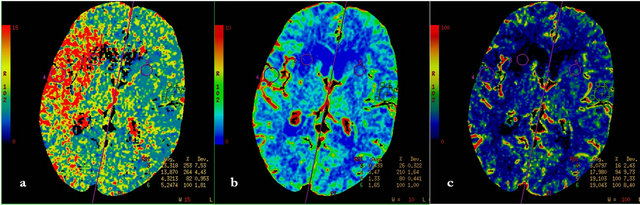
Figure 1. F, 85 y, left hemiparesis, 2 hours after onset, a—MTT map, b—CBF map, c—CBV map. All three perfusion maps show irreversible (core) lesion at the level of right caudal nucleus, it is surrounded with penumbra lesion, that is detected by mismatch of CBV and CBF maps and quantitative mismatch with MTT map (relative MTT—253%).
area showed 192.40% (41% - 320% ± 64.53) in comparison to contra-lateral hemisphere as shown in Figure 2.
CBV mean values in penumbra group were increased 113.10% (45% - 276% ± 36.29) and in core group decreased till 41.82% (3% - 107% ± 27.09).
CBF values were decreased on average till 65.63% (31% - 137% ± 22) in penumbra lesion and markedly decreased till 25.94% (4% - 79% ± 17.35) in core.
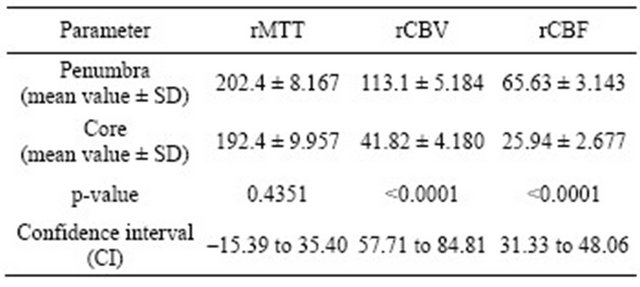
Using non-parametric T-test, there was no significant difference in the MTT values between two groups (t = 0.78; p = 0.43), but we detected statistically significant difference between groups in values of CBF (t = 9.44; p = 0.0001) and CBV (t = 10.47; p = 0.0001) (see Table 1).
There was highly significant correlation between CBF and CBV decrease in core (r = 0.841; p < 0.01) and decreased CBF (r = 0.461; p < 0.01) with variable CBV values in penumbra locations (r = 0.240; p < 0.05).
Mean values given in Table 1 and Figure 2 were considered as threshold values for defining penumbra and core lesions.
5. DISCUSSION
There have been recently several critical articles that stated conflicted interpretation of perfusion (MTT, CBV and CBF) parameters [6], use of non-standardized protocols for image postprocessing and analysis [8] that leads to unreliable results [9]. At present still timely brain imaging and interpretation remains critical to the fast evaluation and diagnosis of patients with potential ischemic strokes as stated in recent ischemic stroke guidelines [10].
Perfusion deficit seen on CT maps is related to brain autoregulation mechanisms. Imaging detects changes that are associated with the development of infarction e.g. edema, necrosis, but do not represent infarction itself [11]. The technique gives quantitative, reproducible and timely evaluation of cerebral perfusion. Any perfusion pressure decrease appears as increased
Table 1. Computed tomography perfusion relative threshold values in core and penumbra lesions calculated from perfusion CT maps (MTT, CBV, CBF) in comparison to contralateral hemisphere. r-represents relative meaning of value (rMTT respectively relative MTT value).
MTT on perfusion CT maps [12,13]. It is visual easy detectable parameter, but non-specific for definition of perfusion deficit grade as shown in results of this study.
Although there are known absolute values for normal perfusion in gray and white matter [14,15], ischemic region includes both, and it was demonstrated in our results as variability of values, because lesion included both types of lesions. Absolute values may vary depending on ROI location and predominance of brain matter type as stated by Schaefer et al. [16], so in our study relative values are more representing lesion area findings.
There are authors that defined MTT value above 145% as optimal for ischemic lesion detection [16], which is correspond to our results, although our study shows higher threshold value. These findings were also confirmed in few cases of extracranial severe stenoses during our study, where MTT increase till 150% did not correspond to clinical symptomatic ischemic area. The latter was also stated by Gelfand and authors-if CT angiography does not correspond to perfusion CT findings with increased MTT, a transitory circulation changes or other stroke mimicking pathologies e.g. Neoplasm, venous
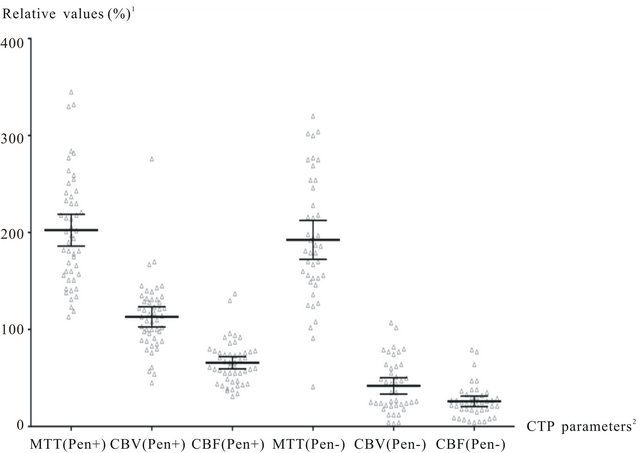
Figure 2. Computed tomography perfusion parameters in Core un Penumbra groups. 1—comparison to contralateral hemisphere; 2—penumbra (Pen+), core (Pen−). MTT values are increased in both lesion types (core and penumbra) >190%, CBV values are above normal level (100) in penumbra lesions. CBF and CBV are markedly decreased in core lesions below 40%.
thrombosis or seizure related hypoperfusion should be considered [13,17], therefore not all perfusion abnormallities seen on perfusion CT maps are specifically related to cerebrovascular disease. MTT increase may also be seen when there are proximal causes of delayed blood supply to the brain [13] (e.g. possible extracranial vessel stenoses, occlusions that may cause delay or dispersion of the bolus of contrast material). This flow pattern should be assessed on CT angiography before interpretation of perfusion CT maps [18].
Penumbra tissue maintains regional CBF by vasodilatation, to provide more oxygen to the area and results in normal or increased CBV level. Our study results correlating to that CBV (cerebral blood volume) map show the competency of autoregulation mechanisms and show different results in penumbra lesions [16]. Variable rCBV values (increased, normal, decreased) in penumbra location well correlate with previous PET (positron emission tomography) studies, that initial brain volume increase is needed for sufficient brain blood supply (CBF), that is followed by CBV decrease in ischemic area [19]. Like other latter studies [20], we defined penumbra as CBV/ CBF mismatch and core like match of CBV and CBF lesions. If CBF lesion is larger than CBV pathologic region, it suggests salvageable tissue and requires active revascularization treatment. If pathology areas match, it is evaluated as necrosis of tissue. Only penumbra area has preserved or increased CBV values due to capillary dildatation, therefore core lesion is characterized by depletion of autoregulation mechanisms and CBV marked decrease [20] as shown in our study.
Our results with rCBF in core less than 40%, correlate to other published author data that ischemic tissue with CBF more than 35% may be salvageable, if recanalized during five hours after onset [16].
According to our and other studies, brain perfusion deficit grades can be defined based on differences in perfusion CT maps, based on CBV and CBF map mismatch in penumbra lesion and CBV and CBF lesion congruency.
In the present study, low sample should be considered as restriction, although our data showed significant results and showed potential for further studies with larger cohort.
6. CONCLUSION
Our study shows that perfusion CT measurements relative threshold values are recommended in definition of penumbra and core lesions in acute stroke patients. General parameter that confirms hypoperfusion is increased MTT > 190%. Penumbra lesion is characterized by MTT increase and CBF decrease, while CBV shows variable values. Relative threshold values for irreversible lesion: CBF less than 30-40% and CBV less than 40% in comparison to contra-lateral hemisphere.
7. ACKNOWLEDGEMENTS
This study was supported by the European Social Funds in Latvia (grant. No. 2009/0147/1DP/1.1.2.1.2/09/IPIA/ VIAA/009). Special gratitude to Janis Savlovskis for data analysis support.
![]()
![]()
REFERENCES
- Grillo, G., Hoeffner, E.G., Case, I., Jain, R., et al. (2004) Cerebral perfusion CT: Technique and clinical applications. Radiology, 231, 632-644.
- Wintermark, M., Albers, G.W., Alexandrov, A.V., et al. (2008) Acute stroke imaging research roadmap. American Journal of Neuroradiology, 29, 23-30.
- Wintermark, M., Maeder, P., Thiran, J.P., Schnyder, P. and Meuli, R. (2001) Quantitative assessment of regional cerebral blood flows by perfusion CT studies at low injection rates: A critical review of the underlying theoretical models. European Radiology, 11, 1220-1230. doi:10.1007/s003300000707
- Kudo, K., Terae, S., Katoh, C., et al. (2003) Quantitative cerebral blood flow measurement with dynamic perfusion CT using the vascular-pixel elimination method: Comparison with H2 (15) O positron emission tomography. American Journal of Neuroradiology, 24, 419-426.
- Wintermark, M., Fralnders, A.E., Velthuis, B., et al. (2006) Perfusion-CT assessment of infarct core and penumbra: Receiver operating characteristic curve analysis in 130 patients suspected of acute hemispheric stroke. Stroke, 37, 979-985. doi:10.1161/01.STR.0000209238.61459.39
- Wintermark, M., Lau, B.C., Chien, J. and Arora, S. (2008) The anterior cerebral artery is an appropriate arterial input function for perfusion-CT processing in patients with acute stroke. Neuroradiology, 50, 227-236. doi:10.1007/s00234-007-0336-8
- Konstas, A.A., Goldmakher, G.V., Lee, T.Y. and Lev, M.H. (2009) Theoretic basis and technical implementations of CT perfusion in acute ischemic stroke. Part 1. Theoretic basis. American Journal of Neuroradiology, 30, 662-668. doi:10.3174/ajnr.A1487
- Kamalian, S., Maas, M.B., Goldmacher, G.V., et al. (2011) CT cerebral blood flow maps optimally correlate with admission diffusion-weighted imaging in acute stroke but thresholds vary by postprocessing platform. Stroke, 42, 1923-1932. doi:10.1161/STROKEAHA.110.610618
- Fiorella, D., Heiserman, J., Prenger, E., et al. (2004) Assessment of the reproducibility of postprocessing dynamic CT perfusion data. American Journal of Neuroradiology, 25, 97-107.
- Jauch, E.C., Saver, J.L., Adams, H.P., Bruno, A., Connors, J.J. and Demaerschalk, B.M. (2013) Guidelines for the eraly management of patients with acute ischemic stroke: A guideline for healthcare professionals from the American Heart Association/American Stroke Association. Stroke, 44, 870-974. doi:10.1161/STR.0b013e318284056a
- Dzialowski, I., Klotz, E., Goericke, S., et al. (2007) Ischemic brain tissue water content: CT monitoring during middle cerebral artery occlusion and reperfusion in rats. Radiology, 243, 720.
- Ebinger, M., De Silva, D.A., Christensen, S., et al. (2009) Imaging the penumbra—Strategies to detect tissue at risk after ischemic stroke. Journal of Clinical Neuroscience, 16, 178-187. doi:10.1016/j.jocn.2008.04.002
- Leiva-Salinas, C., Provenzale, J.M. and Wintermark, M. (2011) Responses to the 10 most frequently asked questions about perfusion CT. American Journal of Radiology, 196, 53-60.
- Leiva-Salinas, C. and Wintermark, M. (2010) Imaging of Acute ischemic stroke. Neuroimaging Clinics of North America, 20, 455-468. doi:10.1016/j.nic.2010.07.002
- Murphy, B.D., Fox, A.J., Lee, D.H., et al. (2008) White matter thresholds for ischemic penumbra and infarct core in patients with acute stroke: CT perfusion study. Radiology, 247, 818-25. doi:10.1148/radiol.2473070551
- Schaefer, P.W., Roccatagiata, L., Ledezma, C., et al. (2006) First-pass quantitative CT perfusion identifies thresholds for salvageable penumbra in acute stroke patients treated with intra-arterial therapy. American Journal of Neuroradiology, 27, 20-25.
- Gelfand, J.M., Wintermark, M. and Josephson, S.A. (2010) Cerebral perfusion-CT patterns following seizure. European Journal of Neurology, 17, 594-601. doi:10.1111/j.1468-1331.2009.02869.x
- Bivard, A., McElduff, P., Spratt, N., et al. (2011) Defining the extent of irreversible brain ischemia using perfusion computed tomography. Cerebrovascular Diseases, 31, 238-244. doi:10.1159/000321897
- Heiss, W.D., Sobesky, J. and Hesselmann, V. (2004) Identifying thresholds for penumbra and irreversible tissue damage. Stroke, 35, 2671-2674. doi:10.1161/01.STR.0000143329.81997.8a
- Wintermark, M., Rechhart, M., Thiran, J.P., et al. (2002) Prognostic accuracy of cerebral blood flow measurement by perfusion computed tomography, at the time of emergency room admission, in acute stroke patients. Annals of Neurology, 51, 417-432. doi:10.1002/ana.10136
NOTES
*The authors state no conflict of interest.