Open Journal of Nursing
Vol.3 No.3(2013), Article ID:34952,9 pages DOI:10.4236/ojn.2013.33043
Diabetes group medical visits and outcomes of care in low-income, rural, uninsured persons
![]()
1School of Nursing, Morgantown Campus, West Virginia University, Morgantown, USA
2School of Pharmacy, Morgantown Campus, West Virginia University, Morgantown, USA
Email: *jamallow@hsc.wvu.edu, ltheeke@hsc.wvu.edu, twhetsel@hsc.wvu.edu, ebarnes@hsc.wvu.edu
Copyright © 2013 Jennifer A. Mallow et al. This is an open access article distributed under the Creative Commons Attribution License, which permits unrestricted use, distribution, and reproduction in any medium, provided the original work is properly cited.
Received 11 May 2013; revised 12 June 2013; accepted 30 June 2013
Keywords: Diabetes; Group Visits; Uninsured; Rural
ABSTRACT
Purpose: The purpose of this study was to test the effectiveness of Diabetes Group Medical Visits (DGMVs) verses usual care in a sample of low-income patients with diabetes receiving care at a rural free clinic. Methods: Data were collected through chart review, using direct data entry into Microsoft Access. Participants were included if they met the inclusion criteria: 1) age ≥ 18 years; 2) diagnosis of diabetes; 3) uninsured and received care between May 2007 and August 2009. Fifty-three participants attended DGMVs and were compared to 58 participants who received usual care. Results: The personal characteristics and biophysical measures of this population differed from previously studied Group Visit populations. The majority of patients were female (73.9%), white (95.5%), younger than 50 (53.2%), driving long distances to receive care (mean miles = 21, SD 20.4) and had a high school education or less (95.4%). Participants were severely obese (mean BMI = 37.6, SD 28.48) and had 5 co-morbid conditions other than diabetes (mean = 5.5, SD 2.1). Those attending DGMVs had higher baseline A1C, depression scores, BMIs, and more pain than usual care. There was a statistically significant decrease in systolic pressure from time one to time two in patients who attended DGMVs t(52) = 2.18, (p = 0.03). There was no significant impact on outcomes of patients who received usual care. However, it is important to note that the majority of patients attended three or fewer DGMVs visits in one year. Conclusion: Group visits may not be enough to improve outcomes in this population. Previous studies suggest that improvements are seen in those who attend more frequently. Hence, the lack of improvement in biophysical outcomes may be due to low attendance. The limited impact of this traditional style intervention in relation to low attendance argues the need to test alternative interventions to reach this population.
1. INTRODUCTION
There are 62 million Americans currently residing in rural areas [1] and it is estimated that 20 percent of this rural population is uninsured. This number is projected to increase to 25 percent by 2019 [2]. In the United States, diabetes is the most prevalent in the rural southeastern region [3]. Close to 12 percent of people in southeastern region of the country have diabetes, compared to 8.5 percent in the rest of the country. The high prevalence of diabetes in this region makes access to care crucially important. Rural populations with low socioeconomic status are at higher risk of poor diabetes control, decreased selfmanagement, and development of complications [4]. Due to a lack of primary care providers in rural areas, interventions that achieve improved outcomes while allowing the primary care provider to optimize time, reduce costs, and provide culturally acceptable care are needed [3].
There is evidence that Diabetes Group Medical Visits (DGMVs) may reduce costs, improve outcomes, and enhance patient and clinician satisfaction of care [5]. Diabetes Group Medical Visits typically combines a group education component and an individual patient office visit [6]. This differs from group diabetes education where patients may receive group education but do not receive health care. This study aimed to describe a sample of low income, uninsured adults with diabetes who were receiving care through a rural free clinic in the southeastern portion of the United States and explore the differences in outcomes between two groups; persons attending DGMVs versus those receiving usual care.
Diabetes group medical visits have been studied in various patient populations and numerous disciplines. Typically, in quantitative studies, health outcomes are measured to determine effectiveness of group visits. The outcomes measured vary from study to study. Frequently, studies that use group medical visits as an intervention, measure outcomes of adherence such as body mass index, weight, glycosylated hemoglobin, fasting blood glucose, blood creatinine, lipids, microalbuminuria, blood pressure, evidence of end organ damage, depression, anxiety, medication use, and foot care. Other studies evaluated process of care indicators such as prescribed ACE inhibitors, aspirin, cholesterol management, cholesterol treatment, measurement of glycosylated hemoglobin, measurement of microalbumin, Pneumovax administration, influenza vaccine administration, eye examination, and foot examination [7-26]. Other than A1C, no two researchers found in this review, measured the same outcomes of care in persons with diabetes who received group medical visits or used the same measurement tools. The literature supported outcome measures that were used for the proposed study. The outcomes measured include body weight, body mass index, fasting blood glucose, A1C, serum creatinine, lipids, blood pressure and microalbumin.
The theoretical framework used to guide this study was the Quality Health Outcomes Model (QHOM). There are four major concepts included in this model: system, interventions, patients, and outcomes. The QHOM posits that system characteristics are the mediators of patient characteristics and interventions in producing patient outcomes [27]. The QHOM proposes that outcome measures should be the result of care interventions that integrate functional, social, psychological, physical, and physiologic aspects of people’s experience in health and illness. The QHOM further postulates that interventions affect and are affected by both the system and patient characteristics in producing desired outcomes [28]. Additionally, according to the QHOM, patient characteristics can affect outcomes of care. The design of this study was guided by major concepts of the QHOM. The system in this study was a free clinic in North Central West Virginia, the intervention was DGMVs, the patients were low income uninsured adults, and the outcomes were biophysical measures (See Figure 1).
1.1. Purpose
The purpose of this study is to describe a sample of uninsured adults with diabetes who were receiving care at a rural free clinic and explore the differences in outcomes between two groups; persons attending Diabetes Group Medical Visits (DGMVs) versus those receiving usual care.
1.2. Design and Specific Aims
This retrospective study was conducted at a free clinic in West Virginia, using chart review of a convenience sample of patients who met the inclusion criteria. The inclusion criteria were: 1) age ≥ 18 years; 2) diagnosis of diabetes; 3) uninsured and received care at a free clinic during the study period. The only specific exclusion criteria were an accidental charting of diabetes where no diabetes existed. Two independent groups were studied, those who attended DGMVs and those who did not attend DGMVs. To achieve a power of 0.8, estimating a
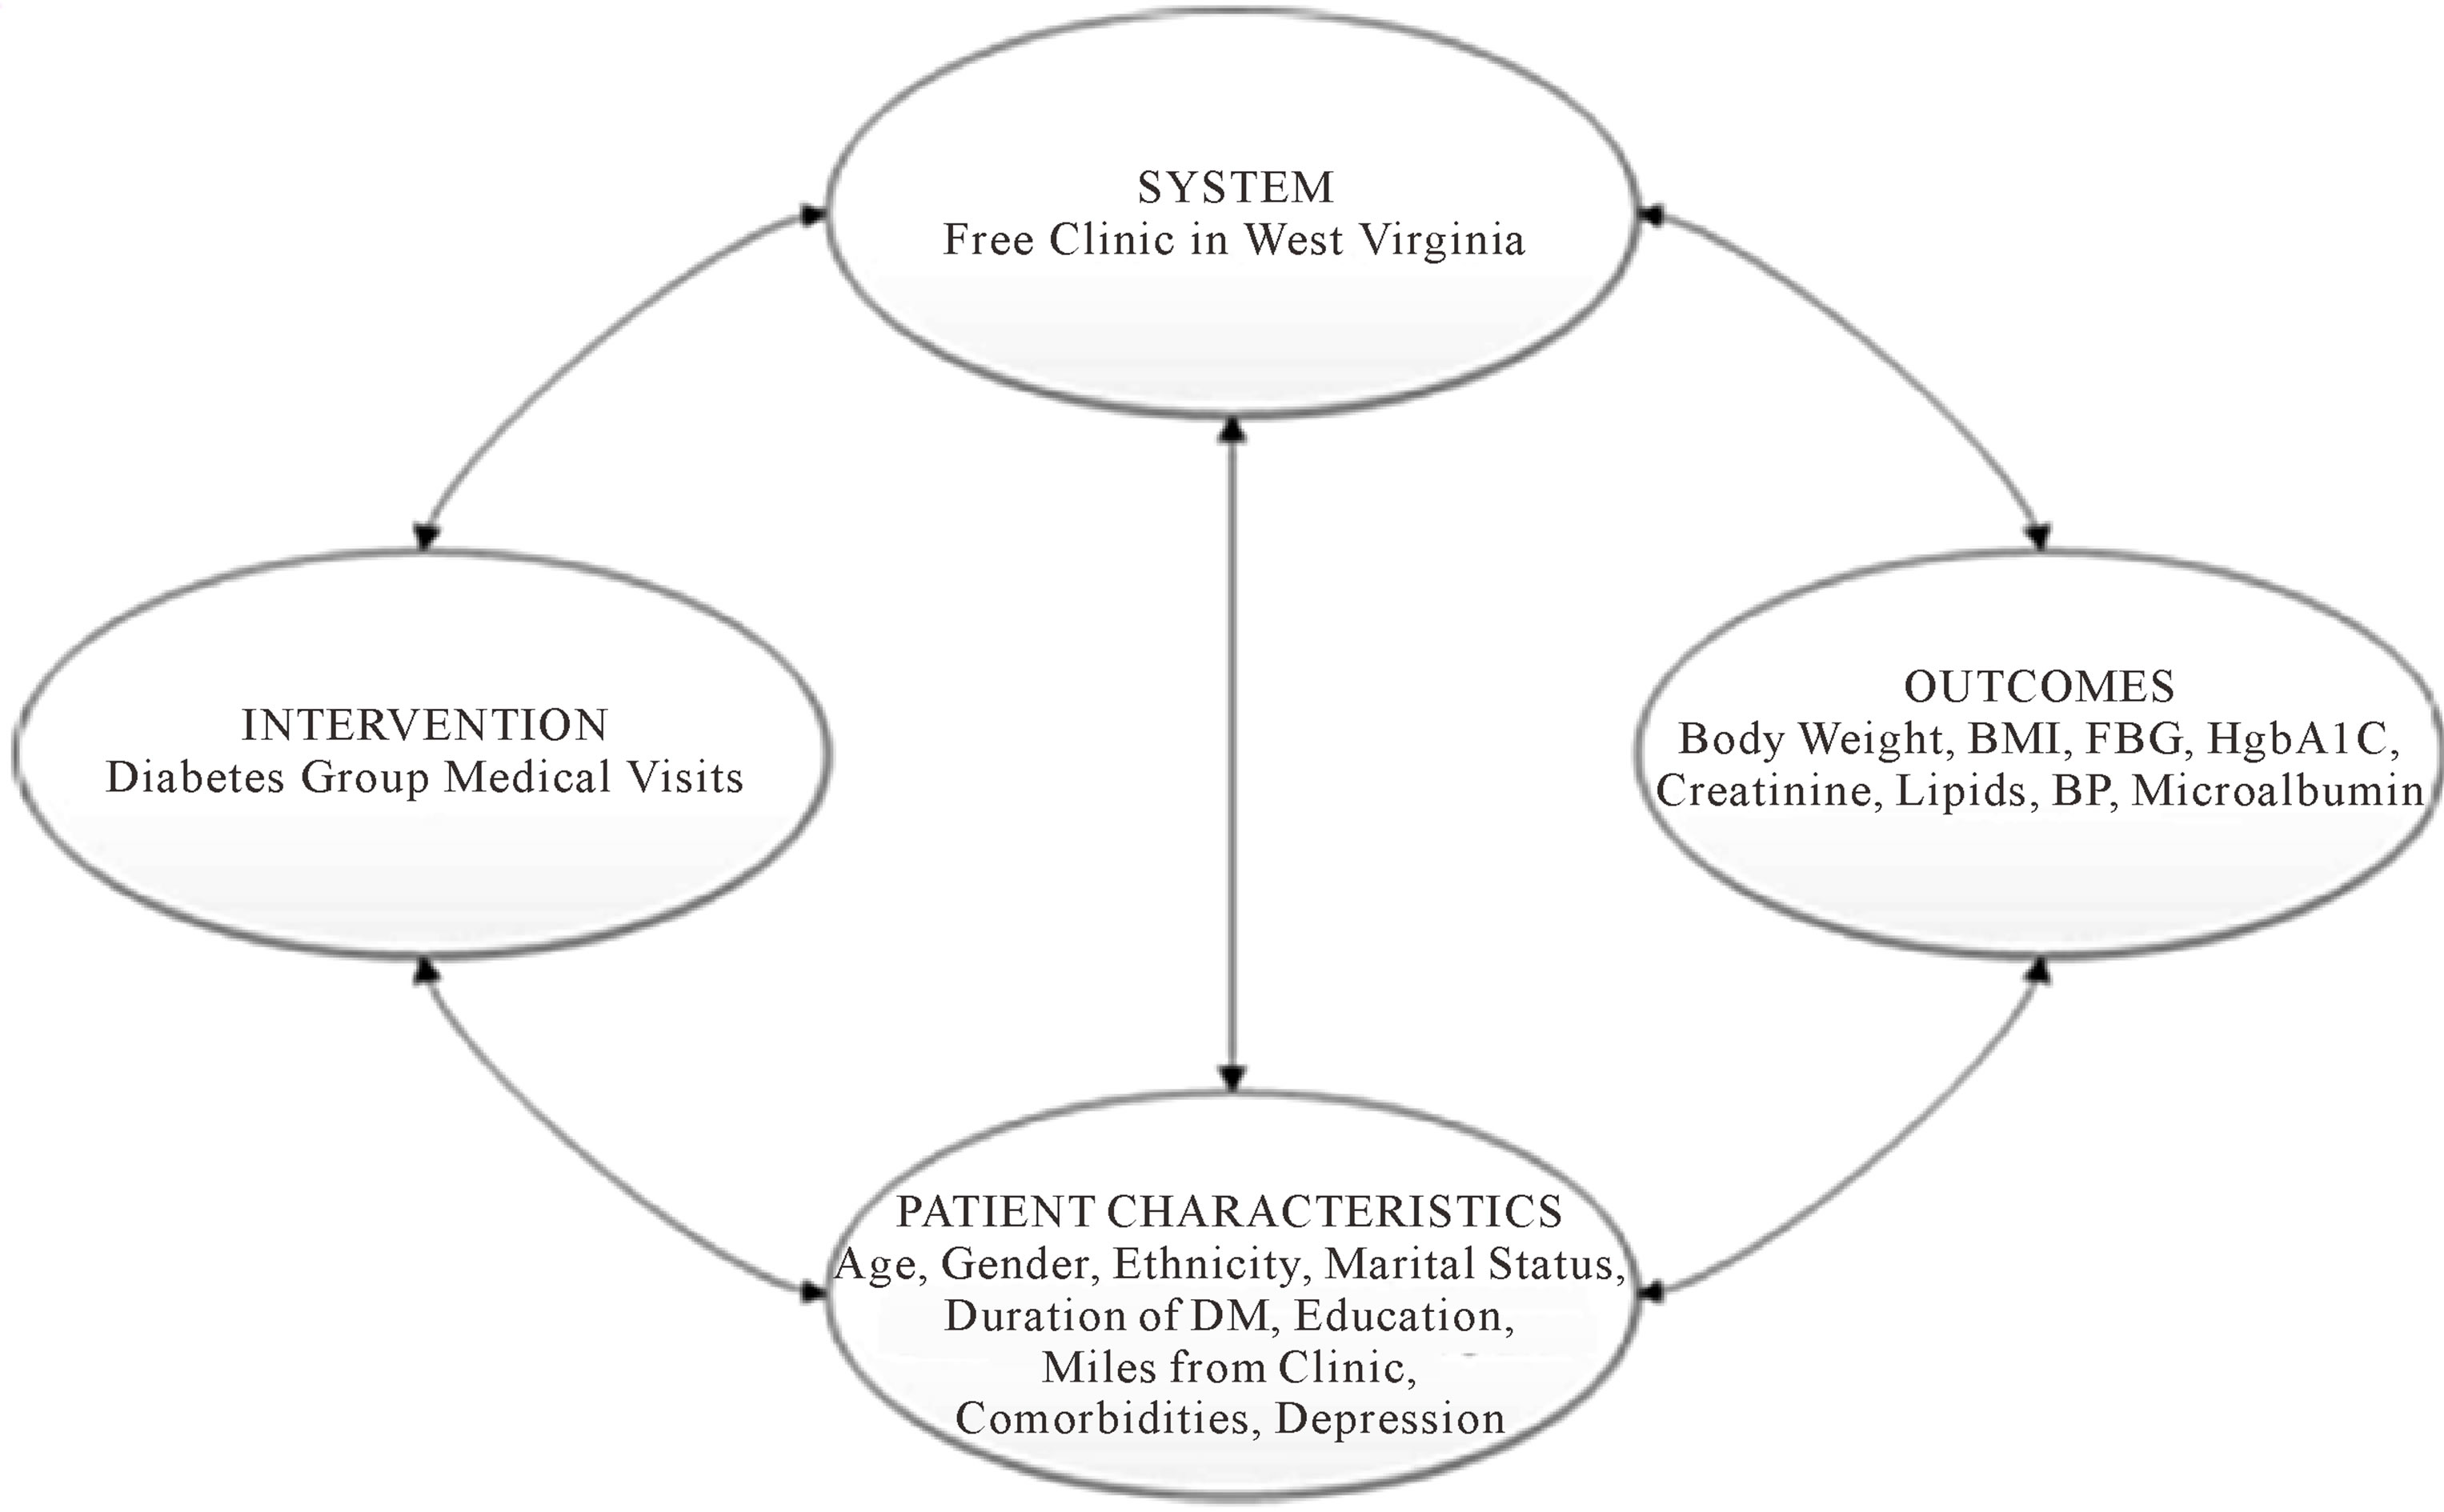
Figure 1. Quality health outcomes model [27].
medium effect size to detect a difference in means between two independent groups, a sample of 51 charts in each group was required (Calculated with G × Power 3). The significance level of p = 0.05 was used for all analyses. Specifically the aims of this study were:
• To describe this population of low income, uninsured patients receiving care at a free clinic in West Virginia.
• To compare biophysical outcomes of care in persons with diabetes before attending DGMVs and one year after attending DGMVs.
• To compare biophysical outcomes of care in uninsured persons with diabetes who receive usual care in a free clinic at baseline and after one year.
• To analyze the differences in biophysical outcomes in persons with diabetes who attend DGMVs versus those who receive usual care in a free clinic at base line and then again after one year.
• To analyze the differences in characteristics of uninsured persons with diabetes who are attendees of DGMVs versus those who receive usual care.
2. METHOD
2.1. Setting of Study
This study took place in North Central West Virginiain a free clinic that provides service to rural uninsured persons.
2.2. Sample
A registry of all persons with a diagnosis of diabetes was kept by the free clinic. The charts of all persons with diabetes who received care from May 2007, when DGMVs were started at the clinic, to August 18, 2009 were identified and reviewed.
2.3. Data Collection
Study variables were collected from the charts on or after May 2007. Biophysical outcomes of care for both groups were collected from the charts and recorded at two separate time periods that were one year apart. Data was captured electronically and a data file was imported into Statistical Package of Social Sciences (SPSS), version 18 for analysis.
2.4. Description of Intervention
The DGMV took place as an additional health care visit and was meant to supplement individual healthcare visits to improve patient outcomes. DGMVs included group education and interaction and elements of an individual patient visit, such as the collection of vital signs, history taking, physical exam, medication adjustments, appropriate standardized referrals, and laboratory procedures related to diabetes care [29]. The curriculum for this clinic’s DGMV, which was adapted from the American Diabetes Association’s standards of care [30] was developed by a Nurse Practitioner (author JM) at the clinic in conjunction with a PharmD (author TW). The free clinic offered up to six DGMVs in which the patients were provided education about blood glucose monitoring, medication, nutrition, exercise, foot care, heart disease, complications including sick day care, and behavior changes. The patients were scheduled to attend the clinic up to once a month until they had received all of the education offered by the DGMVs. Because the classes were offered four times per month, the patients could schedule at their convenience. Hence, the participants in each group varied from class to class. Patients were referred to the DGMV by their primary care provider for additional care. Attendance at the DGMVs was voluntary and the patients did not receive incentive to attend.
Usual care for persons with diabetes in the free clinic where the study took place included collection of vital signs, history taking, physical exam, medication adjustments, appropriate referrals, laboratory procedures, and education provided by the health care provider related to general care. Usual care did not include education provided by a Pharm D or diabetes educator with a group of other diabetes patients at the time as the usual care visit.
2.5. Measures
2.5.1. Patient Characteristics
Patient characteristics collected were: age, gender, ethnicity, marital status, duration of diabetes, education level, distance in miles from residence to clinic, depression score, and co-morbidities. Age was collected from the chart from date of birth. Age was recorded as a continuous variable as a continuous variable at the age of the first visit within the time frame for the study. Gender was collected from the chart, and recorded as a dichotomous variable, either male or female. Ethnicity, recorded upon establishment of care at the clinic, was collected from the chart. Ethnicity was recorded in the following categories: White, African-American, Asian, Hispanic, Native American, and other. Marital status was collected from the chart. Marital status is asked on the initial visit and was reassessed every year. The most recently recorded marital status was collected in the following categories: single, married, divorced, separated, widowed, significant other. Duration of diabetes was collected by chart review using patient self-report data. Subjects are asked to report the number of years that they have had diabetes during clinic visits. The duration of diabetes was recorded from the beginning of the study period, as a continuous variable. Education was recorded from the beginning of the study period in the following categories: less than high school, graduated high school, some college, college graduate, master’s degree, doctorate, GED. Distance in miles from residence to clinic was calculated with Yahoo Map Quest using the clinic address and the patient address. Home address was not kept in any study data file. Miles from residence to clinic was analyzed as a continuous variable. Depression score was collected upon initial visit, using The Center for Epidemiologic Studies Depression Scale (CES-D) [31,32]. The CES-D is a commonly used screening test for determining depression quotient. While the tool is not diagnostic of clinical depression, it has been used in the past as an indicator of depression. The CES-D was filled out by the patient and can be completed in less than five minutes at the first visit prior to receiving care at the free clinic. While the CES-D was to be filled out yearly, it is not commonly updated at the free clinic. Hence, it was not measured as an outcome of care but rather as a patient characteristic.
2.5.2. Health Outcomes
The outcomes measured in this study were: body weight, body mass index (BMI), glycosylatedhemoglobin (A1C), fasting blood glucose (FBG), serum creatinine, serum lipids, urine microalbumin, and blood pressure. Body Weight was measured and recorded as a continuous variable in pounds (lbs) using an upright mechanical medical scale with capacity to weigh patients up to 350 lbs. Body mass index was calculated and recorded as a continuous variable with the following formula:
 .
.
Height was collected to calculate BMI via patient report and recorded in the chart upon initial visit. A1C levels were recorded and analyzed as a continuous variable as percentage of glycosylated hemoglobin. Fasting blood glucose was self-reported by the patient and recorded in the clinic visit note in milligrams per deciliter. All patients measure fasting blood glucose with a glucometer provided for home use by the free clinic. These data were recorded and analyzed as a continuous variable. Serum Creatinine levels were recorded and analyzed as a continuous variable in milligrams per deciliter. Serum Lipid levels were recorded and analyzed as four separate continuous variables, total cholesterol, high density lipoproteins (HDL), low density lipoproteins (LDL), and triglycerides (TG), in milligrams per deciliter. Urine Microalbumin was collected and reported as a continuous variable in milligrams per deciliter. Blood Pressure was measured and recorded as systolic over diastolic millimeters of mercury. The clinic used an automated blood pressure cuff. These data were recorded and analyzed as two separate continuous variables.
2.6. Data Analysis
Analysis used was dependent on variable type. Chisquare tests were used to look for differences in the categorical variables of gender, ethnicity, marital status, education, and type of co-morbidities between patients who attended DGMVs and patients who received usual care. Education level had only one participant that graduated from college and no participants graduated or attended graduate school. Hence, the categories were collapsed. The participant who graduated from college was included in the “some college” category and the “master’s degree” and “doctoral degree” categories were removed. There were only five participants who reported being anything other than white. Hence, the categories were collapsed into white and non-white. The expected count was still less than 5 observations in ethnicity. Therefore, the characteristic of race/ethnicity was not analyzed. Marital status had an expected count of less than 5 observations in several categories. The marital status category was compressed into the categories married and not married. Any participant who was listed as single, divorced, separated, widowed was placed in the non-married category. Participants who were listed as married were placed in the married category. Independent t-tests were used to compare means for the continuous characteristics of age, miles from clinic, and number of co-morbidities between patients who attended DGMVs and patients who received usual care. Q-Q plots were used to assess distribution of age, miles from clinic, and number of co-morbidities for patients who attended DGMVs and for patients who received usual care separately. To analyze the differences in biophysical outcomes in persons with diabetes who attend DGMVs versus those who receive usual care in a free clinic after one year, independent t-tests were used to compare means for body weight, BMI, A1C, fasting blood glucose, serum creatinine, serum lipids, urine microalbumin, systolic blood pressure, and diastolic blood pressure. If after preliminary data analysis was performed, violation of assumptions was recognized, Mann-Whitney U test was used. If no assumptions were violated, an independentsamples t-test was used. A value of p = 0.05 was used to determine significance of the findings.
3. RESULTS
3.1. Sample Descriptors
The majority of patients were female (73.9%), white (95.5%), severely obese (mean = 40.25, SD 28.28), age 50 or younger (53.2%), not college educated (95.4%), averaging 5 co-morbid conditions other than diabetes (mean = 5.5, SD 2.1), and driving long distances to receive care (mean miles= 21, SD 20.4) (See Table 1). Sixty-five percent of the patients were obese. The major-
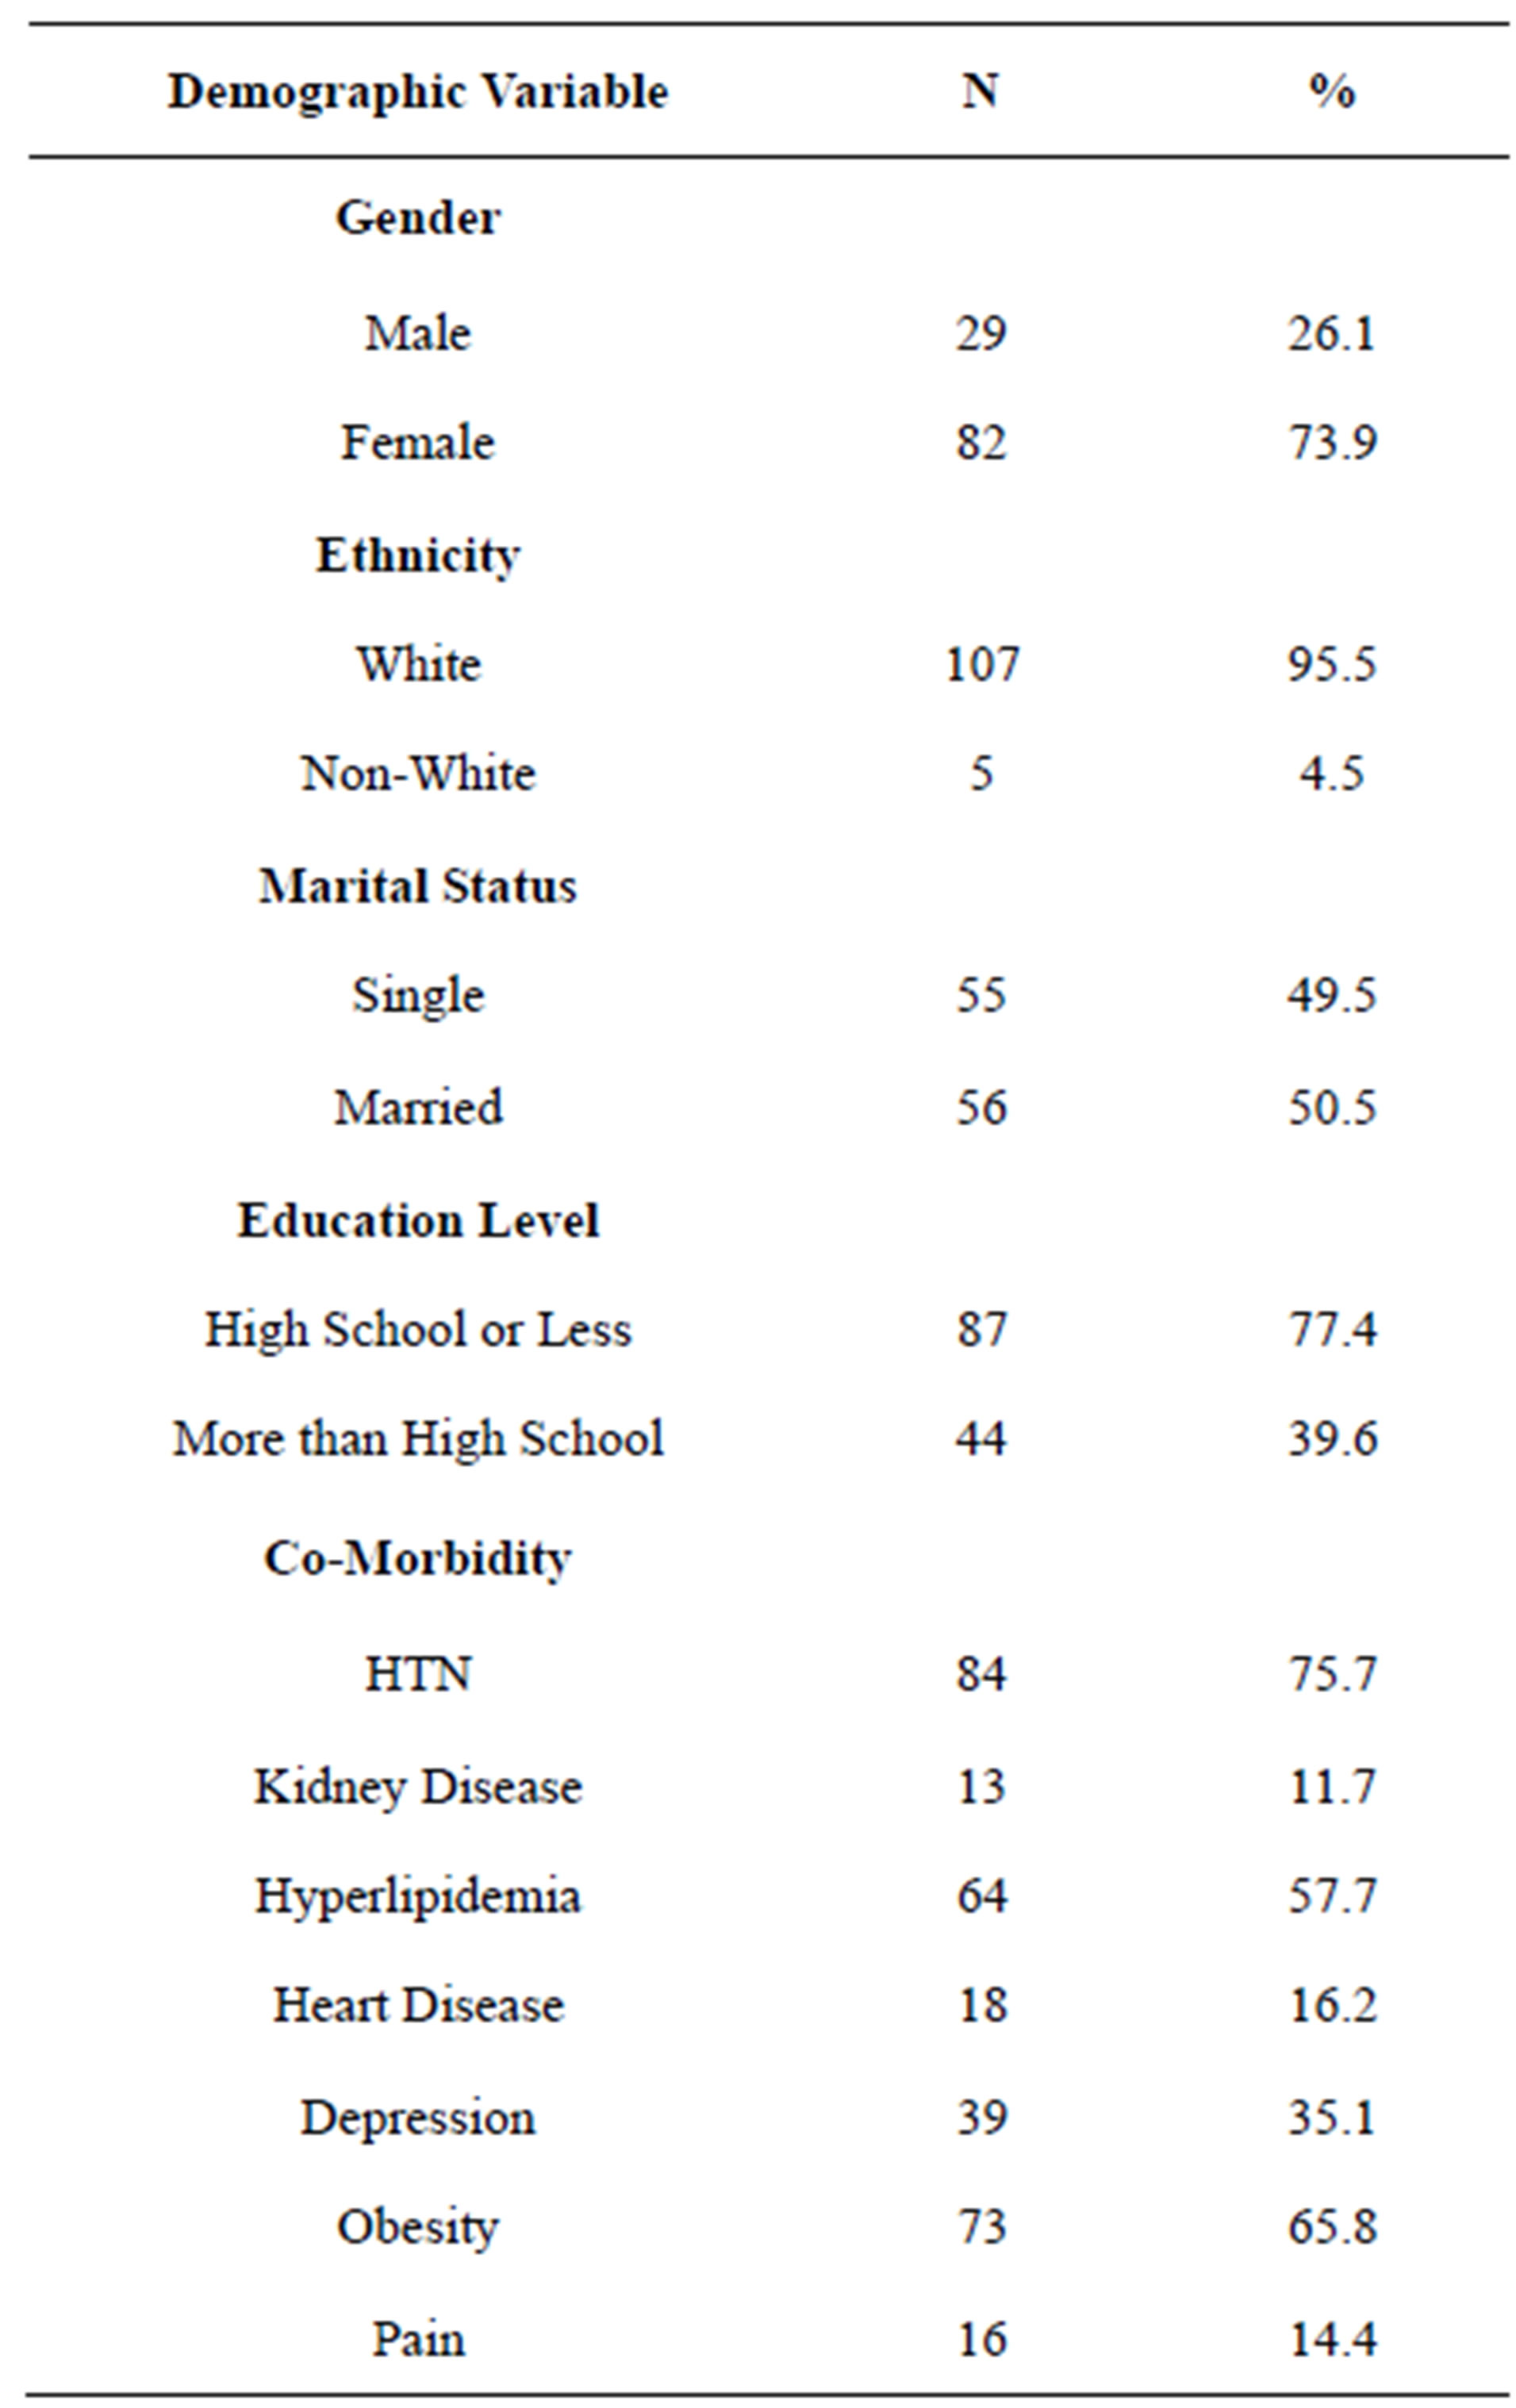
Table 1. Sample characteristics.
ity of the patients had hypertension (84%) and hyperlipidemia (64%). The mean A1C in this population was elevated (mean = 8%, SD 1.94). While creatinine levels were normal in this sample (mean = 0.93 mmol/l, SD 0.45), urine microalbumin was elevated (mean = 52.9 mg, SD 157.96). The lipid levels of this sample indicated dyslipidemia (LDL mean = 104.6 mg/ml, SD 40.44, HDL mean = 40.4 mg/dl, SD 10.63, TG mean = 198.6, SD 169.17).
3.2. Group Comparisons
There were differences in characteristics of uninsured persons with diabetes who were attendees of DGMVs versus those who receive usual care. At baseline, the patients who attended DGMVs had a higher A1C (p = 0.003). Additionally, patients who participated in DGMVs differed from the usual care group prior to the intervention having significantly higher rates of depression (DGMV = 45.3%, Usual Care = 25.9%, X2 = 4.583, P=0.03), obesity (DGMV = 77.4%, Usual Care = 55.2%, X2 = 6.055, p = 0.01) and pain (DGMV = 22.6%, Usual Care = 6.9%, X2 = 5.565, p = 0.01). Independent t-tests showed no difference between the means for the continuous characteristics of age, miles from clinic, and number of co-morbidities between patients who attended DGMVs and patients who received usual care.
Within the DGMV group, there was a statistically significant decrease in systolic blood pressure from time one (M = 132.32, SD = 18.31) to time two (M = 126.83, SD = 18.31), t(52) = 2.18, (p = 0.03). The mean decrease in systolic blood pressure from time one to time two was 5.49 mm/Hg with a 95% confidence interval ranging from 0.443 to 10.539, a range of values for the estimated population parameter. The eta squared statistic (0.08) indicated a moderate effect size. No other significant impact on biophysical outcomes of care in persons with diabetes before attending DGMVs and again after attending DGMVs was noted. In addition, there were no differences in biophysical outcomes of care in uninsured persons with diabetes who received usual care in a free clinic after one year (See Table 2). The patients who attended DGMVs continued to have a higher A1C after one year (p = 0.001). There were no other significant differences in biophysical outcomes of care noted between the DGMV group and the usual care group at one year.
4. DISCUSSION
4.1. Previous Studies
The biophysical outcomes reported in other literature related to DGMVs showed that participants started nearer to treatment goals prior to intervention than the sample of patients in this study. Most studies reviewed related to DGMVs reported A1C levels from 6.9% - 7.6%. Nearly 70% of the sample of patients who attended DGMVs had A1C levels above treatment goals at time one. Additionally, greater than 62% of the sample of patients who attended DGMVs had A1C levels above what has been previously seen in the literature. However, while A1c values are reported in most of the DGMV literature, other biophysical outcomes of care are inconsistently studied, making comparisons difficult. Suboptimal biophysical outcomes and complex patient characteristics of this sample make implementing interventions complex and perhaps less effective than in other populations.
4.2. Obesity
Obesity was prevalent in this population. The mean BMI of this population was high (mean = 40.25, SD 28.28) indicating morbid obesity. Appalachian culture places a large value on the needs of the family and eating. Traditionally, Appalachian food is high in fats and carbohydrates and the vegetables and fruits that Appalachian’s eat are either fried or high in sodium [33]. Obviously, if
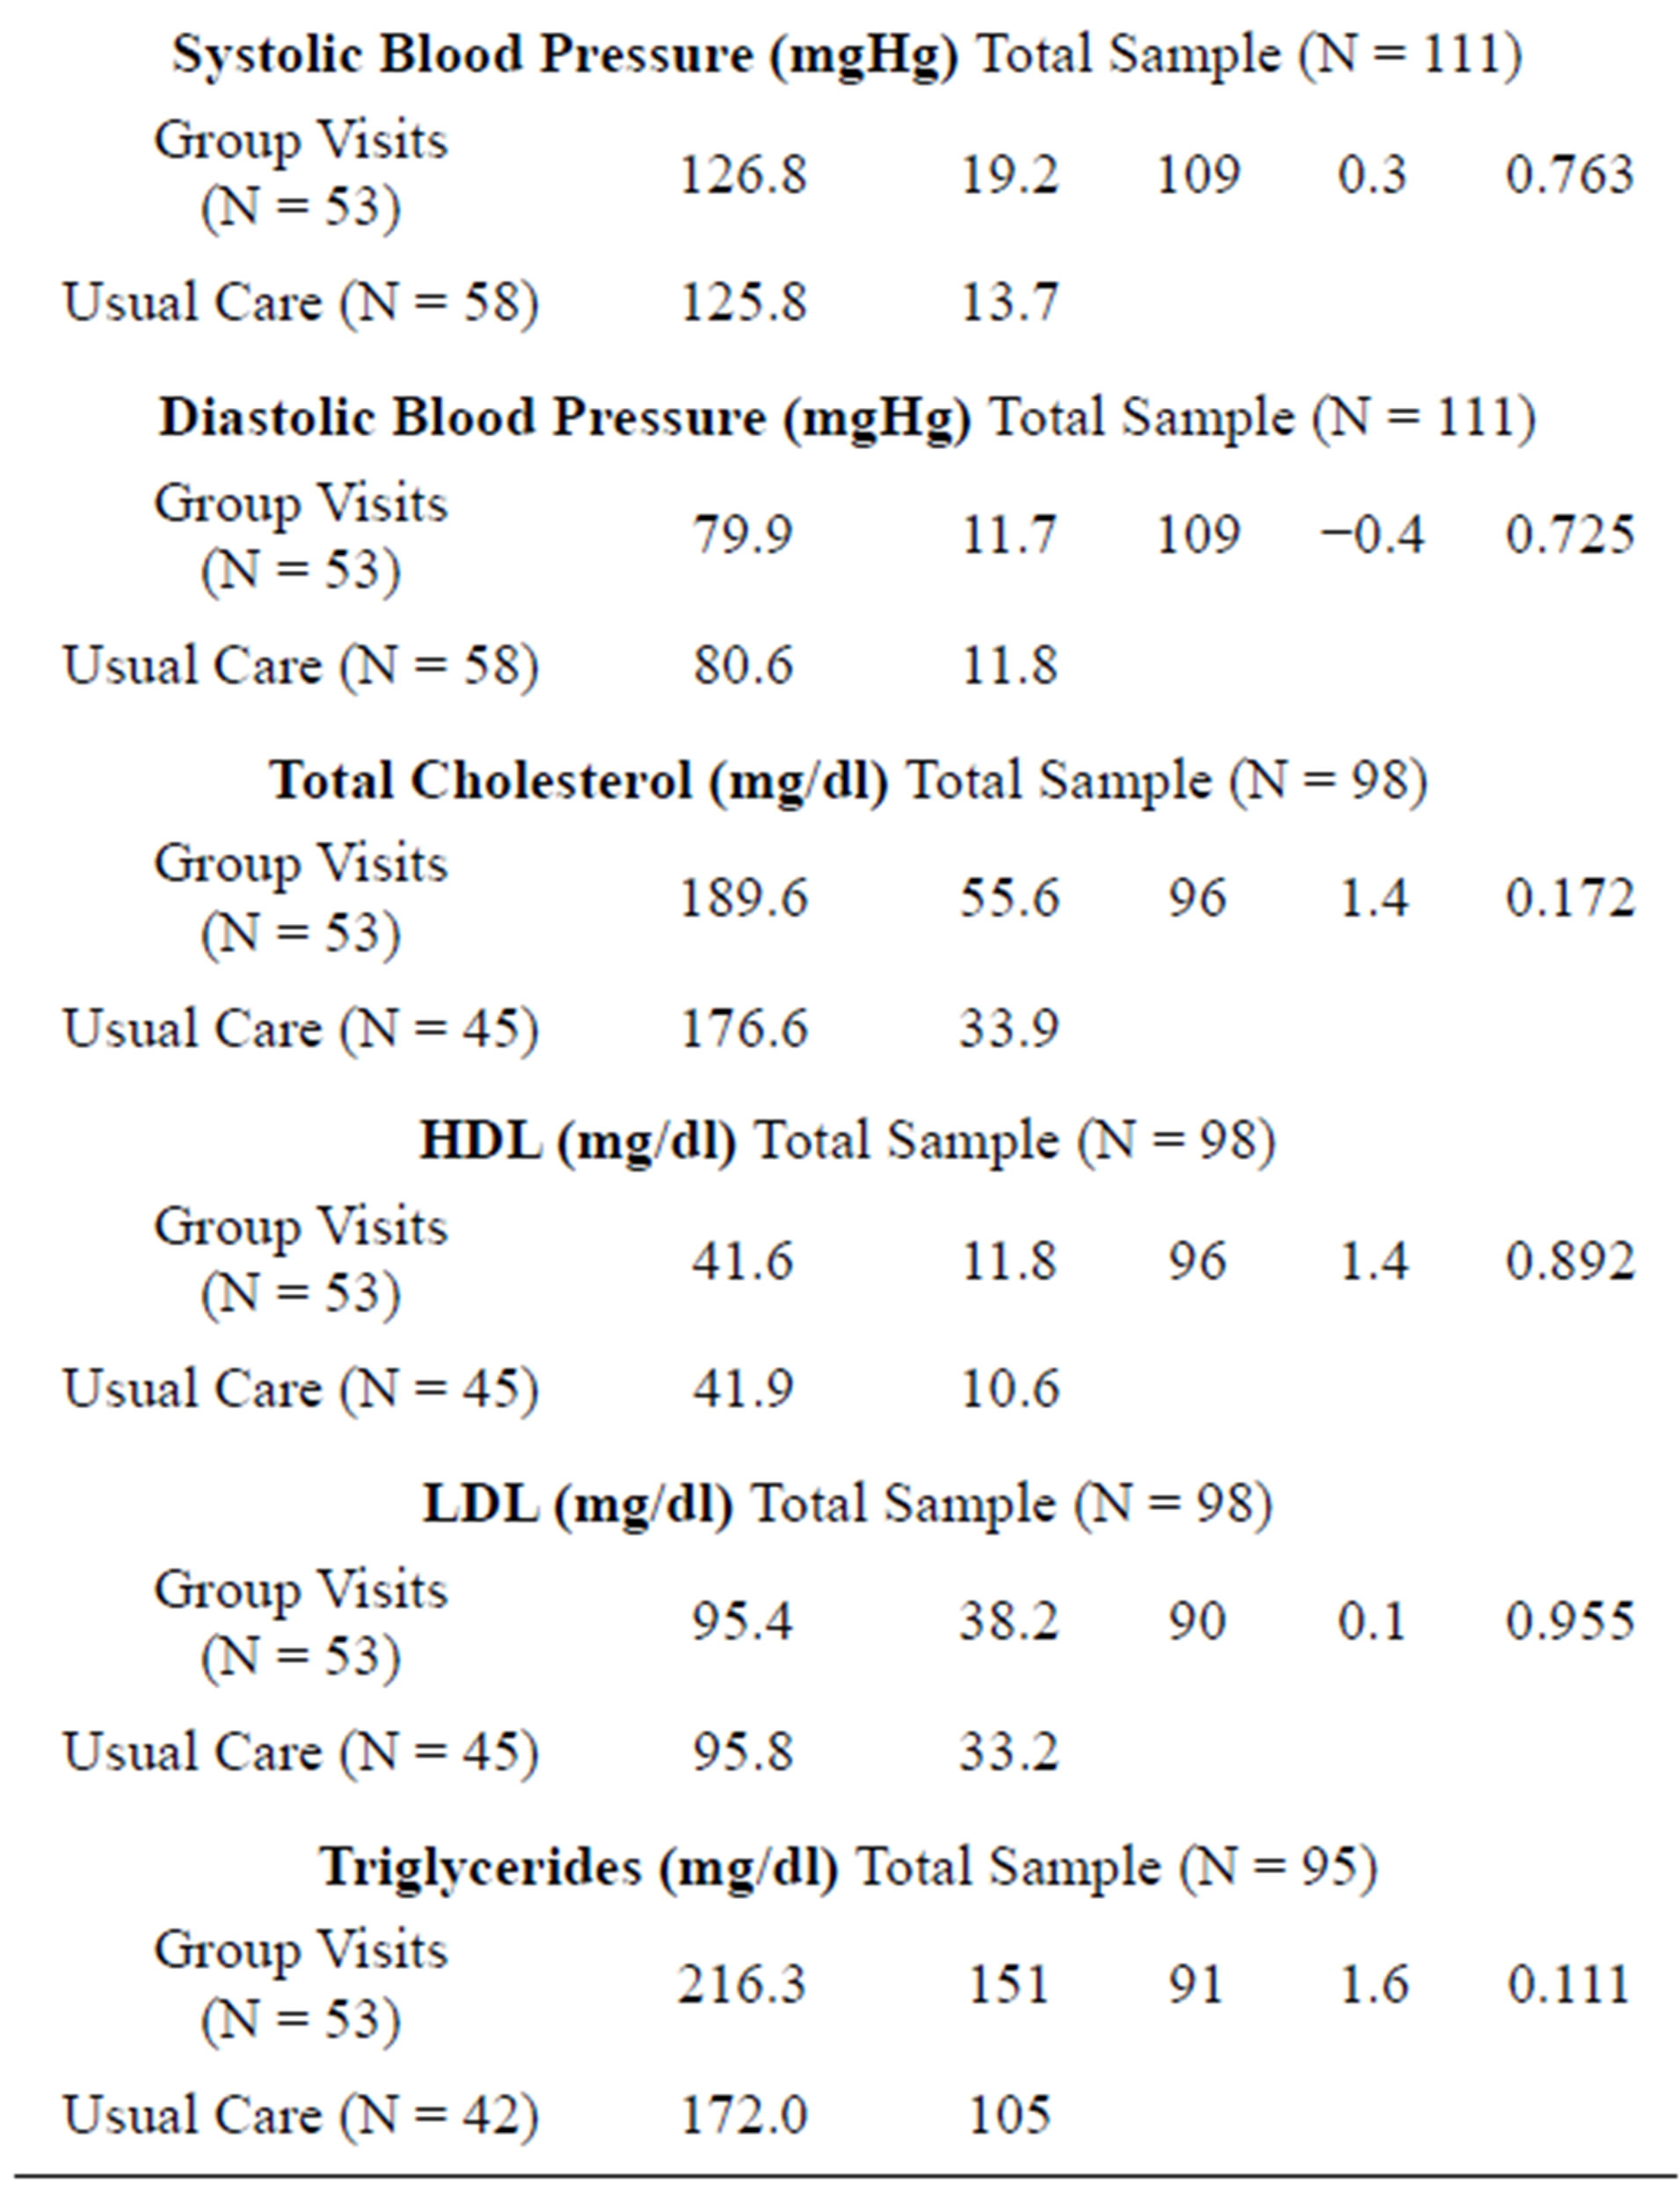
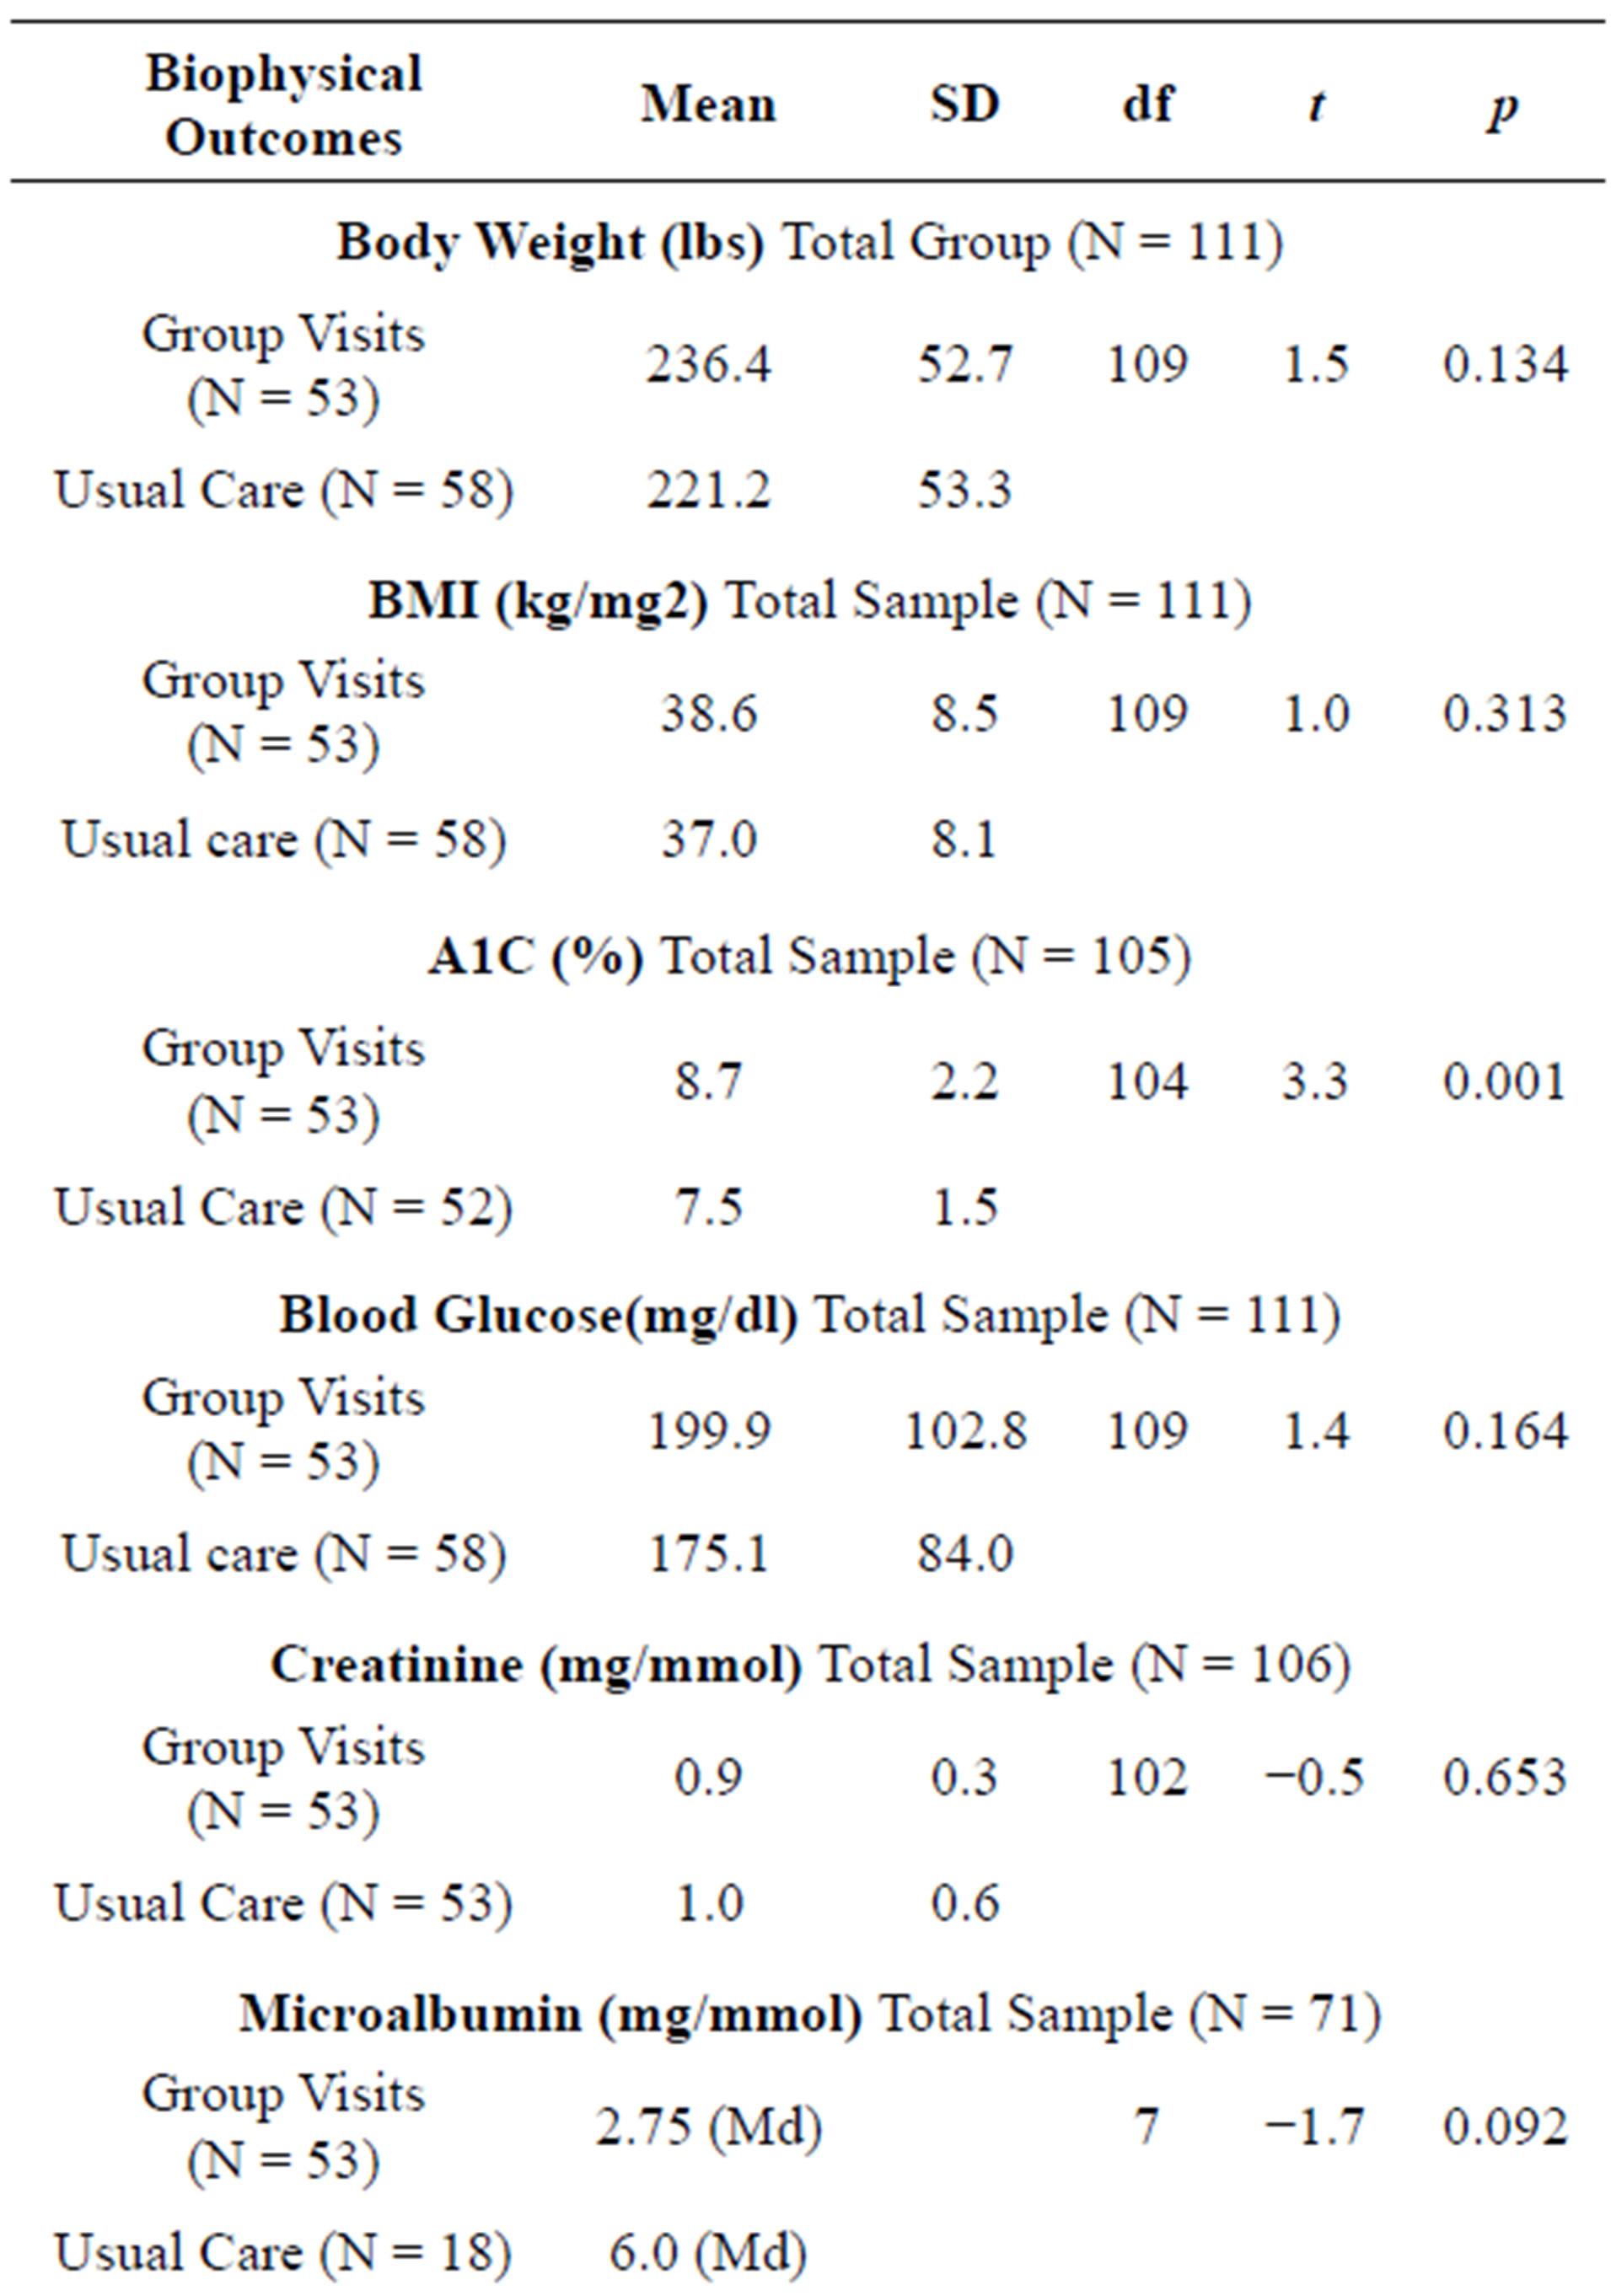
Table 2. Mean comparisons of biophysical outcomes in those who attend DGMVs versus usual care at one year.
your culture values eating and providing these types of food for your family, it will be difficult to follow dietary guidelines given by healthcare providers [33]. There is a known connection between obesity and the incidence of insulin resistance, hypertension, dyslipidemia, and cardiovascular disease [34]. According to the Standards of Medical Care released by the American Diabetes Association, weight loss has been shown to reduce insulin resistance. Mean A1C levels in this population were elevated (mean = 8.09, SD SD 1.94). Meaning the daily average blood glucose of this group is above 200. The American Diabetes Association suggests lowering A1C to below or around 7% in order to reduce microvascular and neuropathic complications of diabetes.
4.3. Complex Chronic Illness
Persons with diabetes being cared for in this free clinic have a mean of 5 co-morbid conditions other than diabetes. Patients with a greater overall number of co-morbidities place lower priority on diabetes and have worse diabetes self-management ability scores [35]. Depression and pain can also affect outcomes of care. Patients with depression are more likely to experience complications of diabetes, have worse glycemic control, and be less adherent to self-care behaviors than patients who are not depressed [36]. Pain has been found to limit a person’s ability to perform self-management behaviors [37]. Additionally, 77.4 percent of this population has a high school education or less. Educational level has been shown to be significant in disease control of diabetes patients. On the National Health and Nutrition Examination Survey from 1999 to 2006 those persons with diabetes who are more educated have consistently shown an improved A1C, blood pressure and total cholesterol level than those who are less educated [38]. Education level and health literacy also appear to have an effect on participation in medical decision making and thus may impact outcomes of care [8].
4.4. Barriers to Care
The population has a mean of 21 miles to drive to the clinic. Longer driving distances from home to the site of primary care have been associated with poorer glycemic control in rural subjects [39]. Living far away from primary health care centers, particularly in West Virginia presents multiple barriers to care. These barriers include inability to quickly access care due to distance, lack of an interstate transportation system, lack of public transportation systems, and cost of transportation [25]. These barriers affect a person’s ability and willingness to obtain needed care [26]. Knowing that DGMVs improved outcomes in older and insured populations more than in this population,leads us to new questions as to what interventions would work best in this population.
In order to receive care at this free clinic, patients must have resided in West Virginia. West Virginia is in the only state that is entirely in Appalachia [18]. Although this study did not collect data on culture, all of the participants of this study live in West Virginia. According to the 2000 United States Census, 74.2 percent of people residing in West Virginia are native to West Virginia [40]. Hence, it is the assumption of the researcher that the patients of this study are members of Appalachian culture, and therefore subscribe to some of the social norms of the culture. These norms and beliefs affect the patients’ desire to interact with a care delivery system [41]. People from Appalachian culture possess core values such as individualism, self-reliance, and fatalism [7]. These core values may affect a patient’s willingness to share personal information with outsiders. An outsider can be any person that is not familiar to the patient such as other patients and health care providers participating in group visits. In order for DGMVs to affect outcomes of care, each patient must share similar experiences and be willing to participate in a group [42]. While the racial make-up of this population is different than populations previously studied related to DGMVs, the population is similar to other populations who live rurally and in poverty.
Age may have been a factor that influenced attendance at clinic visits. The age of all patients in this study is less than 65 and the majority of the patients were age 50 and younger. Evidence suggests that younger adult patients, less than 60 years old, are significantly less likely to attend education programs and multiple healthcare visits than older adult patients [43]. Additionally, the largest reductions in A1C have been documented in patients who attend more healthcare visits [23]. Consequently, lack of attendance to multiple healthcare visits and education programs may contribute to decreased effectiveness of interventions.
The intervention studied here employed a collaborative approach to deliver care. This approach resulted in urine microalbumin being measured and charted more frequently in the patients who attended DGMVs. Having the entire picture of the patients health status by reviewing previously charted biophysical outcomes of care allows the healthcare team to make more informed decisions regarding the future care of the patient [30]. Thus, this finding suggests that a collaborative approach may improve the process of providing care even if biophysical outcomes of care remained essentially unchanged for both participants of DGMVs and usual care patients.
5. CONCLUSION
DGMVs have been shown in the literature to improve biophysical outcomes. Appalachian culture and lack of health care insurance may have contributed to the lack of improvement in biophysical outcomes of care in this population. However, DGMV as an intervention is not enough to improve biophysical outcomes in this population. Future interventions targeted to the unique characteristics of this population are needed to prevent devastating complications. Such interventions should not only cluster care, but also include improved access to care and access to an interprofessional team. The addition of services from other disciplines such as social work or behavioral health and the use of innovative technologies or home care services may contribute to improved outcomes. Future studies that personalize interventions towards individual patients and their families, assess for readiness to change, address financial burden, and barriers are needed. Longitudinal studies that include broader outcomes such as improved quality of life, patientprovider communication, and knowledge of disease processes could enhance our knowledge so that patientcentered and culturally appropriate interventions can be evaluated.
6. LIMITATIONS
The study design was based on a convince sample of persons with diabetes who attended at a free clinic in West Virginia from May 2007 to August 18, 2009. The generalizability of results is limited to the specific population of the study, given that the sample consisted of predominantly white, middle-aged females. Furthermore, due to the retrospective nature of the study, only the variables present in the chart could be collected.
This study did not take into consideration the barriers to attending DGMVs for this population. Out of the possible 326 patients who received care for diabetes at the clinic during the study timeframe, only 111 patients had 2 visits within the one year timeframe and hence, one year comparisons could not be made. Attendance at clinic appointments was unpredictable, with the cancellation rate being high for many patients. Other factors have been implicated in affecting outcomes, such as readiness for change, lack of transportation, culture, and knowledge and these factors are not included in this study.
7. ACKNOWLEDGEMENTS
Dr. Jennifer Mallow would like to thank the West Virginia Clinical and Translational Science Institute (WVCTSI). The time to write this article was supported by the WVCTSI through the National Institute of Health, National Institute of General Medical (NIH/NIGMS) Award Number U54GM104942.
REFERENCES
- DeNavas-Walt, C., Proctor, B.D. and Smith, J.C. (2010) Income, poverty, and health insurance coverage in the United States. In: Office USGP, Ed., Current Population Reports, US Census Bureau, Washington DC, 60-239.
- Garrett, A.B., Loan, L., Headen, I. and Holahan, J. (2010) The cost of failure to enact health reform: Implications for states. Robert Wood Johnosn Foundation, Princeton.
- Barker, L.E., Kirtland, K.A., Gregg, E.W., et al. (2011) Geographic distribution of diagnosed diabetes in the U.S.: A diabetes belt. American Journal of Preventive Medicine, 40, 434-439. doi:10.1016/j.amepre.2010.12.019
- Utz, S.W. (2008) Diabetes care among rural Americans. Annual Review of Nursing Research, 26, 3-39.
- Riley, S.B. and Marshall, E. (2010) Group visits in diabetes care: A systematic review. Diabetes Educator, 36, 936-944. doi:10.1177/0145721710385013
- Noffsinger, E.B. and Scott, J.C. (2000) Understanding today’s group visit models. Group Practice Journal, 49, 46-48,50,52-54,56-58.
- Clancy, D.E., Brown, S.B., Magruder, K.M. et al. (2003) Group visits in medically and economically disadvantaged patients with type 2 diabetes and their relationships to clinical outcomes. Health Information Management, 24, 8-14.
- Clancy, D.E., Yeager, D.E., Huang, P., et al. (2007) Further evaluating the acceptability of group visits in an uninsured or inadequately insured patient population with uncontrolled type 2 diabetes. Diabetes Educator, 33, 309-314.
- Culhane-Pera, K., Peterson, K.A., Crain, A.L., et al. (2005) Group visits for Hmong adults with type 2 diabetes mellitus: A pre-post analysis. Journal of Health Care for the Poor and Underserved, 16, 315-327.
- Trento, M., Passera, P., Bajardi, M., et al. (2002) Lifestyle intervention by group care prevents deterioration of Type II diabetes: A 4-year randomized controlled clinical trial. Diabetologia, 45, 1231-1239. doi:10.1007/s00125-002-0904-8
- Trento, M., Passera, P., Tomalino, M., et al. (2001) Group visits improve metabolic control in type 2 diabetes: A 2-year follow-up. Diabetes Care, 24, 995-1000. doi:10.2337/diacare.24.6.995
- Wagner, E.H., Grothaus, L.C., Sandhu, N., et al. (2001) Chronic care clinics for diabetes in primary care: A system-wide randomized trial. Diabetes Care, 24, 695-700. doi:10.2337/diacare.24.4.695
- Guzek, J., Guzek, S., Murphy, K., et al. (2009) Improving diabetes care using a multitiered quality improvement model. American Journal of Medical Quality, 24, 505- 511.
- Chiu, Y.W., Chang, J.M., Lin, Li., et al. (2009) Adherence to a diabetic care plan provides better glycemic control in ambulatory patients with type 2 diabetes. The Kaohsiung Journal of Medical Sciences, 25, 184-192. doi:10.1016/S1607-551X(09)70059-2
- Burke, R.E. and O’Grady, E.T. (2012) Group visits hold great potential for improving diabetes care and outcomes, but best practices must be developed. Health Affairs, 31, 103-109.
- Cohen, L.B., Taveira, T.H., Khatana, S.A., et al. (2011) Pharmacist-led shared medical appointments for multiple cardiovascular risk reduction in patients with type 2 diabetes. Diabetes Educators, 37, 801-812.
- Dickman, K., Pintz, C., Gold, K., et al. (2011) Behavior changes in patients with diabetes and hypertension after experiencing shared medical appointments. Journal of the American Academy of Nurse Practitioners, 24, 43-51. doi:10.1111/j.1745-7599.2011.00660.x
- Dontje, K. and Forrest, K. (2011) Implementing group visits: Are they effective to improve diabetes self-management outcomes? The Journal for Nurse Practitioners, 7, 671-677.
- Edelman, D., Fredrickson, S.K., Melnyk, S.D., et al. (2010) Medical clinics versus usual care for patients with both diabetes and hypertension: A randomized trial. Annals of Internal Medicine, 152, 689-696.
- Ghorob, A., Vivas, M.M., De Vore, D., et al. (2011) The effectiveness of peer health coaching in improving glycemic control among low-income patients with diabetes: protocol for a randomized controlled trial. BMC Public Health, 11, 208.
- Gutierrez, N., Gimple, N.E., Dallo, F.J., et al. (2011) Shared medical appointments in a residency clinic: An exploratory study among Hispanics with diabetes. The American Journal of Managed Care, 17, e212-e214.
- Heisler, M., Vijan, S., Makki, F., et al. (2010) Diabetes control with reciprocal peer support versus nurse care management: A randomized trial. Annals of Internal Medicine, 153, 507-515.
- Sanchez, I. (2011) Implementation of a diabetes self-management education program in primary care for adults using shared medical appointments. Diabetes Educators, 37, 381-391.
- Simmons, C. and Kapustin, J.F. (2011) Diabetes group visitis: An alternative to managing chronic disease outcomes. The Journal for Nurse Practitioners, 7, 671-679. doi:10.1016/j.nurpra.2010.12.002
- Taveira, T.H., Friedmann, P.D., Cohen, L.B., et al. (2010) Pharmacist-led group medical appointment model in type 2 diabetes. Diabetes Educators, 36, 109-117.
- Tsang, C.J., Lee, D.F., Reddy, R., et al. (2010) Resident-driven group medical visits for diabetes mellitus in an ethnically diverse clinic population. Hawaii Medical Journal, 69, 27-30.
- Mitchell, P.H., Ferketich, S. and Jennings, B.M. (1998) Quality health outcomes model. American Academy of Nursing Expert Panel on Quality Health Care. Journal of Nursing Scholarship, 30, 43-46. doi:10.1111/j.1547-5069.1998.tb01234.x
- Mitchell, P.H., Heinrich, J., Moritz, P. and Hinshaw, A.S. (1997) Outcome measures and care delivery systems. Introduction and purposes of conference. Medical Care, 35, NS1-NS5. doi:10.1097/00005650-199711001-00001
- Jaber, R., Braksmajer, A. and Trilling, J. Group visits for chronic illness care: models, benefits and challenges. Family Practice Management, 13, 37-40.
- American Diabetes Association (2007) Executive summary: Standards of medical care in diabetes. Diabetes Care, 33, S4-S10. doi:10.2337/dc10-S004
- Boisvert, J.A., McCreary, D.R., Wright, K.D., et al. (2003) Factorial validity of the center for epidemiologic studies-depression (CES-D) scale in military peacekeepers. Depress Anxiety, 17, 19-25. doi:10.1002/da.10080
- Deeb-Sossa, N., Perreira, K., Harris, K. and Bollen, K.A. (2009) What are we measuring? An evaluation of the CES-D across race/ethnicity and immigrant generation. The Annual Meeting of the American Sociological Association, Atlanta. http://www.allacademic.com/meta/p107171_index.html
- Coyne, C.A., Demian-Popescu, C. and Friend, D. (2006) Social and cultural factors influencing health in southern West Virginia: A qualitative study. Prevention of Chronic Diseases, 3.
- DeFronzo, R.A. and Ferrannini, E. (1991) Insulin resistance. A multifaceted syndrome responsible for NIDDM, obesity, hypertension, dyslipidemia, and atherosclerotic cardiovascular disease. Diabetes Care, 14, 173-194. doi:10.2337/diacare.14.3.173
- Kerr, E.A., Heisler, M., Krein, S.L., et al. (2007) Beyond comorbidity counts: How do comorbidity type and severity influence diabetes patients’ treatment priorities and self-management? Journal of General Internal Medicine, 22, 1635-1640. doi:10.1007/s11606-007-0313-2
- Clancy, D.E., Dismuke, C.E., Magruder, K.M., et al. (2008) Do diabetes group visits lead to lower medical care charges? American Journal of Managed Care, 14, 39-44.
- Krein, S.L., Heisler, M., Piette, J.D., et al. (2005) The effect of chronic pain on diabetes patients’ self-management. Diabetes Care, 28, 65-70.
- Colella, T.J. and King, K.M. (2004) Peer support. An under-recognized resource in cardiac recovery. European Journal of Cardiovascular Nursing, 3, 211-217. doi:10.1016/j.ejcnurse.2004.04.001
- Clancy, D.E., Cope, D.W., Magruder, K.M., et al. (2003) Evaluating concordance to American diabetes association standards of care for type 2 diabetes through group visits in an uninsured or inadequately insured patient population. Diabetes Care, 26, 2032-2036. doi:10.2337/diacare.26.7.2032
- Finder, A.F. (2000) DP-2 Profile of West Virginia Social Characteristics.
- Berg, G.D. and Wadhwa, S. (2002) Diabetes disease management in a community-based setting. Managed Care, 11, 45-50.
- Barud, S., Marcy, T., Armor, B., et al. (2006) Development and implementation of group medical visits at a family medicine center. American Journal of Health-System Pharmacy, 63, 1448-1452.
- Hughes, R.G. and Blegen, M.A. (2008) Medication Administration Safety.
NOTES
*Corresponding author.