Open Journal of Ecology
Vol.09 No.07(2019), Article ID:94024,34 pages
10.4236/oje.2019.97019
Eastern Oyster (Crassostrea virginica) Filtration Efficiency of Chlorophyll-a under Dynamic Conditions in the Hudson-Raritan Estuary at Pier 40, New York City
Jane E. Perrino, Dennis R. Ruez Jr.*
Department Environmental Studies, University of Illinois Springfield, Springfield, IL, USA

Copyright © 2019 by author(s) and Scientific Research Publishing Inc.
This work is licensed under the Creative Commons Attribution International License (CC BY 4.0).
http://creativecommons.org/licenses/by/4.0/


Received: May 29, 2019; Accepted: July 27, 2019; Published: July 30, 2019
ABSTRACT
Eastern oyster (Crassostrea virginica) abundance has declined severely over the past century along the Atlantic and Gulf coasts of the United States. For varied reasons, overfishing among the foremost, bivalves no longer make up considerable reefs as was common. While discourse continues on oyster restoration and augmentation, gaps in knowledge of C. virginica and regional environmental interactions remain. Our primary aim was to examine the C. virginica filter feeding of phytoplankton in the Hudson River Estuary, New York City. Secondarily, this study examined the filtration of these oysters in relation to environmental attributes. Chlorophyll-a, the predominant photosynthesizing pigment in red and green algae, is an indicator of phytoplankton productivity in aquatic settings. Crassostrea virginica consumes first-tier plankton from the water column’s seston; thus analysis of chlorophyll-a content allows estimating phytoplankton concentrations, from which oyster filtration efficiency (FE) was quantified. Water conditions (temperature, dissolved oxygen, pH, salinity, turbidity, tide and flow rate) also were recorded. Spectrophotometric determination of chlorophyll-a concentration methodology was derived from the Standard Methods text favored by the US EPA. This project compared real-time Hudson River Estuary (HRE) water samples prior to passing through a contained oyster reef and samples of water post-filtration. This sampling scenario was unique as the contained reef used was fed by HRE water. Most studies on oyster filtration have been laboratory-based, and few assessed oysters in the field. This study took place at Pier 40, the River Project Wetlab, lower Hudson River along Manhattan. The FE of this reef was calculated for two months during various environmental states which can be the basis of future investigations. Statistically significant differences were found between pre- and post-filtration water samples (Z = 4.620, p < 0.001). This study provides a glimpse at how the oysters fare in the HRE environment and expands upon known oyster ecological services and environmental interactions.
Keywords:
Chlorophyll-a, Crassostrea virginica, Filtration Efficiency, Hudson River

1. Introduction
It is fairly well known within the scientific and commercial fisheries communities by now that oyster reefs have been depleted on a global scale over the past two centuries. In fact, oyster reefs are amongst the most threatened of oceanic habitats [1] . Historically, the eastern oyster (Crassostrea virginica) was a bountiful fisheries landing in the Greater New York region of the Atlantic coastline. Presently, the eastern oyster reefs of the Hudson-Raritan Estuary are near impossible to spot and have been deemed “functionally extinct” by researchers [2] . Though recovery efforts have been amplified especially in the past two decades, the oyster reefs of North America continue to languish [3] .
In an effort to secure the economic future of oyster harvesting in the USA, replacement measures and certain harvest constraints have been enacted by fisheries at the behest of scientists and policymakers. However, the eastern US C. virginica populations remain low for a number of related factors. The dredging involved in oyster harvest often removes the necessary recovery habitat simultaneously [2] . In removal of live oysters and shells, the essential substrate for following generations to adhere to is absent, challenging breeding populations’ establishment vertically. A second significant cluster of factors can sweep in post-harvest: disease, parasites, heavy sedimentation, stress from anoxia, and competition by non-native species. As fisheries aim to keep the oyster harvest afloat, solutions land on over-simplified efforts and the erroneous addition of non-native oyster species to US waters in order to meet market expectations. This can increase the occurrence not only of new disease and parasite prevalence in the native oysters, but also has proven to overshadow struggling native populations of oysters [2] .
While most research attention in the past regarding C. virginica has centered on its commercial value, more recently the focus has broadened to include the ecological services of oysters and therefore their inherent value [1] [4] . Ecological services, also referred to as ecosystem services, of C. virginica include the creation of three-dimensional reef habitats, stabilization of shoreline, improved water clarity due to filtration and control of phytoplankton blooms by enhancing the benthic-pelagic coupling [5] [6] . Nuances of each service have only just begun to surface through research. Beyond the obvious consumptive properties, C. virginica provides multiple important non-consumptive paybacks to their native estuarine waters ranging from Nova Scotia to Brazil.
As a filter feeder, C. virginica has historically played a significant role in the coastline ecoregion surrounding New York City. One of the most notable functions is its ability to transfer suspended materials from the water column to the benthic zone (or estuary floor in this case) as it feeds [7] . Seston, the suspended living and nonliving particulate matter of the water column [8] , is drawn down through powerful muscular contractions of oyster gills and passed through the oyster digestive tract. There’s no other native bivalve that can match the functions of the eastern oyster; simply put, it is a foundational species in the HRE. However, eastern oyster filtration capacity decreased across sampled estuaries by a median of 85% between the 1960’s and 2010 [1] . New York state’s oyster beds of old have been deemed “functionally extinct” by experts. This indicates that over 99% of the historically known oyster reefs have disappeared from this region [3] .
These stout bivalves comprised a major portion of the Hudson-Raritan Estuary system, thriving northward into the Lower Hudson River. The loss of the eastern oyster abundance is felt sorely in the Hudson River considering the reality of increased sedimentation from agriculture upstate and increased industry, as well as from greater occurrences of storm surges. The substantial ecological services of eastern oysters are all but vanished. This estuary system, the most densely populated in all of the US, demands particular attention for restoration [9] .
The majority of previous studies on C. virginica ecosystem services have taken place south of New York and focused mainly upon Virginia and South Carolina regional estuaries [6] [10] . Others have emphasized studies for eastern oysters in intertidal areas, where the reefs are exposed and more readily accessed at ebb tide. Also aerial reef extent research has been limited to clear waters. The Hudson-Raritan Estuary (HRE) does not conform to either of these location parameters, nor does it have high visibility or intertidal reefs along Manhattan’s piers. Study of the oysters subsisting in the Hudson River Estuary segment of the HRE (lower Manhattan) would be novel to the bivalve research thus far completed. Understandably, the majority of all oyster studies have relied heavily upon lab-based data as field examination of eastern oysters is challenging and expensive. Therefore, a study of C. virginica that closely observes the organism in relation to the natural environment would behoove scientists looking to rehabilitate this estuary.
Aspirations have recently been voiced by both governmental and non-governmental organizations for a complete restoration effort in the Hudson-Raritan Estuary network, set forth in a formal restoration plan drawn up in 2009 [11] . With the help of certain independent parties, the eastern oysters are slowly being introduced to the Hudson River estuary in downtown Manhattan. One such long term project has been headed by the Harbor Foundation of NY and will endeavor to introduce a billion oysters to the Hudson over the course of 20 years [12] . Thus we have all the more reason to research oyster properties in this estuary in order to properly manage population recovery.
These foundational organisms once played a vital role in ecosystem structure, and certainly in improving overall water quality in the HRE. A specific study on the interaction of C. virginica and conditions in the Hudson River, especially its filtration efficiency would aid in environmental reconstruction and implementation of mass oyster introductions. This area is unusual in silt-clay sediment consistency, and the estuary has a tidal and traffic interrupted flow which makes the case of Hudson River Estuary oysters special. The opportunity to study eastern oysters in a somewhat realistic field reef setting is worth pursuit. The River Project of lower Manhattan, a non-profit sector environmental education and research group, hosted me since January 2014 and allowed me to conceive of a method to study the oyster filtration here. The reef system contained in their Wetlab fills with real-time estuary water which continually flows across the oyster reef 24 hours a day. This semi-contained setting strove to quantify the filtration efficiency of a particular eastern oyster population, which, based on available scientific literature, has yet to be done in this environment or region.
2. Background
2.1. Eastern Oyster Anatomy & Function
Crassostrea virginica, the eastern oyster, is also commonly referred to as the American oyster. This organism inhabits estuarine regions and behind barrier reef islands. The range of C. virginica spans from the gulf of the St. Lawrence River in Canada, southward along the eastern coast of the United States. Eastern oysters can be found along the gulf coast past the Yucatan Peninsula to Venezuela at the southernmost reach. In the late 80’s these oysters were especially plentiful in numbers at Chesapeake Bay, Long Island Sound and the Gulf of Mexico [13] . Prior historical logs however indicate the most abundant oyster populations in New York’s bays.
Oysters are bivalves of the Ostreidae family, comprising of two shells known as the left and right valves [14] . The left valve in oysters is more deeply cupped, heavier and thicker than the right valve. In fact, it is the left valve that cements to substrate for the duration of the oyster’s life. There are no pronounced hinge teeth as are present in most other bivalves. However, the right and left oyster valves fit together at a deep depression referred to as the isodont hinge teeth on the anterior end. Oysters are well known for their highly variable shell shape. On silt-bottomed estuaries the shell beaks, also called umbones (broader segment of shell on either side of the hinge), are straight. Meanwhile in hard-bottomed estuaries, eastern oyster shells tend to curve towards the posterior end according to some [15] and towards the anterior side according to others [14] . In mud-bottomed environments such as the Hudson River Estuary, the oysters are apt to develop rapidly in order to keep their gills end above siltation. This leads to long, thin shells [16] . Oyster shells from soft substrate and reef environments tend to be slender and less ornamented than shells from hard substrate environments. These tend to be more rounded, and radially ridged with foliated progressions, as well as hardier than soft substrate shells. Shell growth occurs along an ever-changing dorsal-ventral axis. This lends a somewhat zig-zag pattern to the outside of oyster shells [13] .
The two characteristic hard shells of the eastern oyster serve to protect its extremely soft and vulnerable internal organs. A fragile membrane keeps the organs attached to the inner shell. This membrane layer known as the mantle is all that keeps the essential gills of the oyster in place at the anterior edge of the shells as they develop [14] . The right and left mantle lobes are joined at the posterior end of the oyster at the cloacal chamber and also are joined at the oral hood at the anterior end which covers the labial palps and mouth. The rest of the mantle follows the curvature of the valves but is not attached aside from the two points described [1] . This makes oysters susceptible to damage and loss of fluids when the mantle is harmed by violent environmental conditions, predators, human impact or penetration by parasites [16] .
Oriented in the posterior region of the oyster body (left side of the shell midline), is a prominent structure known as the adductor muscle. The presence of a singular adductor muscle differentiates oysters from most other bivalves (excluding scallops) as these have two adductor muscles to position valves. Its function is to close the shell, or in relaxation to permit the valves to gape open. The consistent tension of the hinge joint against the adductor activity is what results in opened and closed oyster positions [14] . In proximity to the essential adductor muscle, the kidney sits at its anterior ventral portion, the rectum passes over its dorsal surface, and the posterior aorta supplies muscles at the midpoint of the adductor. The three-chambered heart of an oyster is also contained by a thin connective tissue, damage of which almost always leads to rapid oyster death [16] .
A key attribute of C. virginica is its subsistence via filter feeding on phytoplankton. Vital in this process are the gills of the eastern oyster. Four demibranchs, or folds of tissue, hang from the visceral mass and comprise the gill system. Two marginally-attached lamellae create each demibranch, while two connected demibranchs (designated the inner and the outer demibranchs) create each gill. Each gill is attached to the oyster shell at the gill base and projects into the cavity of the mantle [17] . The two gills themselves fill the majority of the ventro-anterior and ventral portion of the mantle cavity making them the largest organ in the oyster [18] . Gills, along with the mantle, are the central players of the oyster’s respiratory system. Creation of water currents, gathering of food particles, gas exchange, separation of eggs at spawning time and transport of food particles to the labial palps for sorting are all accomplished by the gills. The activity of each individual oyster creates the remarkable “draw-down” of seston into the oyster reef [1] .
At the top of each demibranch margin, the edge where descending and ascending lamellae join, is the ciliated trench-shaped marginal food groove. Gill surfaces contain cilia of varied sizes and form, and cells of the epithelia itself possess both adhering and blocking junctions. The first sorting station for particles entering an oyster is the gill, where some particles are rejected and others are moved on to the labial palps for a second phase of sorting [19] . Clearly the surface of each gill is highly specialized [17] . The gill of the eastern oyster is given some rigidity and form by interlamellar tissue connections between principle filaments and the descending and ascending folds of the demibranchs. The epibranchial chambers are separate from the four demibranchs at the anterior region of the gill. These serve to collect most of the water pumped through the ostia openings and water tubes in the gills. Unique to Crassostrea is the feature of water removal from the right gill by the promyal chamber [17] . The primary motor of water through the gill system is a band of lateral cilia on all filaments beating synchronously to create a metachronal wave [20] .
One in situ fluorometric examination of (South Carolina) eastern oyster filtration determined the percentage of phytoplankton removal to be 37.4% for particular physical and chemical conditions [19] . The particle trap and sorting process which takes place in the oysters’ gills is almost continuous, with desirable phytoplankton entering the stomach for digestion and inedible solids excreted to the estuary floor in the form of pseudofeces (undigested matter). The uptake of particles by an oyster also depends on the size of the given particle and the size of the oyster itself [21] . Crassostrea virginica does not have a constant clearance rate of water through its gill filtration system. Rather, the clearance rate is constantly in flux depending on both endogenous and exogenous aspects such as water temperature, salinity and particle density. Optimal temperatures for filtration processes of C. virginica have been modeled and also observed to range between 25˚C and 30˚C [7] [13] [18] .
2.2. Eastern Oyster Lifecycle
Oyster maturation takes from 12 to 18 months, and 1 to 2 years to reach the “market size” of 3 inches. Upon maturation, the gonads of an individual begin to differentiate. Crassostrea virginica is protandric, and therefore alternates between egg and sperm production in reproduction. Though the environment an oyster develops in certainly plays a role, eastern oysters generally act as males the first spawning [14] . Eastern oysters spawn in the ecoregion of New York and Long Island in the early autumn season.
The life cycle of C. virginica is varied with several distinct shell stages. The first stage lasts up to 30 hours after external fertilization and is referred to as the pre-shelled to prodissoconch I stage during which it is planktonic by nature. During this time, the fertilized egg proceeds to blastula, gastrula, trochophore, veliger and finally D-shape phases of the shell. A prodissoconch I period endures from the first arrival of shell material in the oyster larvae until a specific striation appears on the shell, and then the larva is deemed to enter the prodissoconch II stage. This begins roughly around 14 days after fertilization. During this stage, the larva continues to transform its umbones and develops into a pediveliger. The pediveliger is both a free swimming and crawling life-stage of the eastern oyster, at which point it has a foot-like appendage besides its external cilia. The final major stage of development is referred to as the dissoconch stage, and lasts the duration of the oyster’s life. This stage begins when the planktonic existence ends due attachment of the pediveliger to substrate. This is aptly named the settling of an oyster, and the small anchored oyster becomes a spat which continues to grow [14] . In the final life-stage, C. virginica can only orient its shell to be open or closed. It is not possible to relocate itself from its chosen substrate as the foot-like appendage dissipates upon settling [14] .
2.3. Chlorophyll-a and Its Determination
Chlorophyll is a green pigment essential in oxygenated photosynthesis, which allows plants to absorb energy from sunlight. Chloroplasts within phytoplankton hold a concentrated amount of chlorophyll. It is within the chloroplasts that the chlorophyll pigments undergo a charge separation by which the chlorophyll donate an electron to the electron transport chain—critical to successful reduction of CO2 into useable sugars for subsistence. The blue portion of the electromagnetic spectrum is what chlorophyll pigment most easily absorbs, with the red portion a close second. In marine biology specifically, chlorophyll is found in chloroplasts of algae and in cyanobacteria [22] .
Chlorophyll-a is one of several types of chlorophyll pigments. For the purposes of this study, chlorophyll-a will be the sole pigment type assessed as it is most prominently found of the chlorophylls in estuarine algae and cyanobacteria that the oysters may be feeding upon. It is the crux chlorophyll pigment for oxygenated photosynthesis, while the other pigments (chlorophyll-b and chlorophyll-c) are understood to be accessory pigments. The structure of chlorophyll-a can be described as a chlorine ring of four nitrogen atoms surrounding one magnesium atom with several methyl side chains and a prominent hydrocarbon tail [22] .
Fluorometry and spectroscopy are the two most common used modes for chlorophyll-a concentration determination. Fluorometry utilizes a fluorometer to determine the parameters of fluorescence by contents of a sample after light is passed through. Spectroscopy on the other hand assesses the amount of light absorbance of a sample, and as different chemicals absorb light at different wavelengths the contents of that sample can be quantified. In a 90% acetone aqueous solution such as that used in this study, chlorophyll-a exhibits peak absorption of light at wavelengths of 430 nm and 664 nm in the red spectrum [23] . The mode of chlorophyll-a determination in my study was by a Spectronic 20™ spectrophotometer, common in most university labs in the 60s, because of all the available machinery at The River Project it has proven reliable and accurate in its zeroing (compared to a similarly aged fluorometer).
As chlorophyll-a present in estuary water is dominantly within phytoplankton and cyanobacteria, some disruption and concentration will be necessary to perceive the pigment with spectrophotometry. The chlorophyll-a is locked within the chloroplasts and therefore by collecting the chloroplasts and breaking them through physical (filtration and grinding) and chemical (90% aqueous acetone submersion) we can make the pigment more accessible for analysis [24] . Since degradation byproducts of the chlorophylls (pheophytins) will likely be present in the estuary samples as well, the initial spectroscopic reading will include pheophytins in the total concentration. To remove pheophytins from confounding the results, one must acidify the samples and take a second reading to deduce the “actual” chlorophyll-a content of a water sample [25] .
2.4. Hudson-Raritan Estuary
The Hudson-Raritan Estuary (HRE) system of New York and New Jersey is located in one of the most urbanized corners of the US. In the 17th century, these waters were exceedingly productive; however, in the past several centuries the ecological integrity has been significantly lowered. Only in the past several decades have organizations been creeping toward rehabilitation of this water body. In 1988, the National Estuary Program (NEP) initiated by Congress acknowledged the New York-New Jersey harbor as a nationally important estuary. The Harbor Estuary Program of 1996 delineated the Comprehensive Conservation and Management Plan for this region. Soon thereafter, in 1999, the Port Authority of New York and New Jersey began to initiate ecosystem restoration partnered by the US Army Corps of Engineers (USACE). The year 2005 marked the commencement of workshops to develop restoration strategies, hosted by The Hudson River Foundation and Cornell University. The culmination of this ecoregion’s federal and non-federal organizations efforts to restore the estuary functions can be read in the Hudson-Raritan Estuary Comprehensive Restoration Plan of 2009 [11] .
The HRE is comprised of over 1600 square miles [11] . This estuary is a remarkably diverse system due to complex glacial and geological histories that give rise to different habitats. The HRE is located at the merging of 3 physiographic provinces: the Atlantic Coastal Plain (sand, gravel and clay sediment); the New York-New Jersey Highlands (metamorphic rock); and the Piedmont Province (igneous intrusions, shale and sandstone formations). Varied ecosystems emerged from this conglomeration of geographic components. The HRE ecosystems house nearly 400 species of special emphasis animals, plants and fish according to the US Fish and Wildlife Service [26] . Also notable, this estuary is positioned along the Atlantic Flyway for migratory birds in North America [11] .
Unfortunately, only 20% of the HRE historic tidal wetlands remain today. Industry and commercial boat traffic have been significant factors in diminishing these, as have shoreline loss and heavy sedimentation. Increased run off from farming and roadways, dredging, and poor land management have led to higher sedimentation rates in the estuary. Through both suffocation and the covering of essential larval habitat substrate, sedimentation killed off some of the previously abundant oyster reefs in the Hudson River Estuary [27] [28] . The parasitic diseases, dermo (Perkinsus marinus) and MSX (Haplosporidium nelsoni), caused much damage to oyster populations along the eastern Atlantic coast starting in the 1950’s [21] . To further compound the strain on oyster populations, intense harvesting ensued and water quality steadily decreased. Even with the arrival of the Clean Water Act in the 1970’s, the estuary system surface waters struggle to naturally flush because of shoreline alterations and reduced freshwater flow from numerous upstream impoundments. New York City and its boroughs have more than 9 million residents, and the sewage system is combined—meaning the sewage and rainwaters combine through the sewers. In storm conditions when the treatment facilities are overburdened, untreated sewage is diverted directly into waterways via combined sewage outfalls [29] .
In the National Status and Trends Program, the Hudson-Raritan Estuary system sediment and mussels were assessed to have the highest levels nationally of polychlorinated biphenyls (PCBs), polyaromatic hydrocarbons (PAHs), pesticide and dioxins [26] . This is a testament to the long-term effects of discharge and accidental industrial spills. Due to levels of contaminants, the New York-New Jersey harbor is poor for fishery usage. In search of increasing economic viability of these ports, the focus of activity has been placed upon shipping and barge industry which further degrades the environment via dredging, turbulence and traffic among other factors [11] . Ultimately it is a challenging water system to study, as there is constant traffic upon the surface and continuously changing prevailing current flows from tidal and precipitation fluctuations.
3. Materials and Methods
In order to quantify the filtration efficiency of the eastern oysters within a particular segment of the Hudson-Raritan Estuary, one needs to know the amount of phytoplankton consumed by a given oyster population. There are several methods currently practiced in research of phytoplankton presence in water bodies based primarily on the chlorophyll pigments used in photosynthesis. Researchers are able to sample and detect concentrations of chlorophyll pigments by both fluorometric and spectrophotometric methods. In this study, a measure of chlorophyll-a change in concentration was used to determine the efficiency of a contained oyster reef’s filtration. Because of equipment availability and reliability, the spectrophotometric method of chlorophyll-a determination as listed in the Standard Methods for the Examination of Water and Wastewater: 20th Edition [25] was used. The spectrophotometer used for this study was a 115 volt Spectronic 20TM model by Milton Roy Company, USA. The focus is on this particular pigment because chlorophyll-a is the most prevalent photosynthetic pigment in this estuary’s algae.
The setting of this study was in the Lower Hudson River stretch of the Hudson-Raritan Estuary system, on Pier 40 of Manhattan [30] . The River Project (TRP, the study site is awarehouse-like Wetlab in which TRP has designed and maintained an elaborate estuarium system fed by real-time HRE water (Figure 1). An electrical pump through their floor continuously feeds half a dozen large 100+ gallon tanks and periodically is used to fill numerous 10 to 50 gallon tanks depending on fish and invertebrate procurement. The most recent addition to the estuarium was the living oyster reef in 2013. This three tank system housed-several hundred eastern oysters of various maturities, manually placed in imitation of a natural three-dimensionally shaped reef which is important to its role in ecological service [3] . Old shells and minimal wiring with strategic placement of live C. virginica have produced a reef approximately 2 feet in height, 1.5 feet in width and 4.5 feet in length.
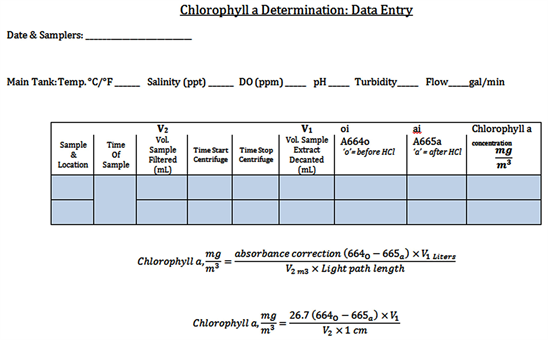
Each sampling consisted of two water samples in order to calculate the percentage of chlorophyll-a filtered. The first step with each sampling was to note the water attributes as shown in Appendix 1. Properties such as the tide, flow rate, turbidity, salinity, pH, dissolved oxygen (DO) and temperature may hold clues regarding filtration efficiency in data analysis [19] . Titration kits (Lamotte) were available for both DO and pH, while a hydrometer and floating immersed thermometer read salinity and temperature respectively. DO was also measured with a Hanna HI9146 meter, and pH with an Oakton EcoTester pH 2 meter.
Each sample set has one 250 mL container of Tank A water (prior to oyster filtration), and 20 minutes later, as dictated by the residence time, one 250 mL container of Tank B water (post oyster filtration). These samples were stored in darkness of an opaque black bag and removed to the lab for immediate processing. It was important to keep the samples dark so that UV light didn’t impact the levels of photosynthetic activity in each sample. This study followed the Standard Methods protocol [25] for spectrophotometric determination of chlorophyll-a with minor adjustments to accommodate the specific lab atmosphere and brackish water (Appendix 2). The general flow of sampling took between two and three hours per data point and included: sample collection, sample concentration through hand-held vacuum filtration, filter media grinding with mortar and pestle which released the chlorophyll-a from the phytoplankton chloroplasts, acetone extraction of chlorophyll-a in vials, clarification of chlorophyll-a samples through use of centrifuge, and lastly the determination of chlorophyll-a concentration per Sample A and Sample B via the Standard Methods spectrophotometric protocol (Appendix 1, Appendix 3). Data was run through the equation set forth by Standard Methods for chlorophyll-a determination by spectroscopy, which has been specified in the Analysis section. (In future study, use of a control cuvette of 100% chlorophyll-a could be useful for checking the state of the spectrophotometer, though there was not one available for this study).
Analysis consisted of correlation study between filtration efficiency (percentage of chlorophyll-a removed from the reef tank) and the sampling conditions. For example, filtration efficiency against was plotted water temperature, created

Figure 1. The River Project living oyster reef. Tank A receives the initial flow of HRE water, which spills into the Main Tank and returns to the Hudson River by Tank B (Photograph by J. Perrino).
a regression trend line, calculated the correlation coefficient and tested the coefficient for statistical significance. It also was assessed whether the pre-filtration water was statistically significant different from post-filtration water. An overall scatter plot of the FE and each HRE water parameter through the study was of interest also for observation of potential trends. All graphics and data analysis were completed through Microsoft Excel 10 and add-on analysis packages. The Wilcoxon Matched Ranks Test was used to determine whether there was a significantly lower chlorophyll-a concentrations post-filtration, and a Pearson’s Product Moment (two tailed) correlation matrix displayed potential interactions between all variables.
4. Considerations and Limitations
In the process of reviewing literature on Crassostrea virginica, gaps in present knowledge of the species became apparent, specifically in the area of realistic quantification of oyster attributes in the field. While this study was not conducted in the raw elements, the TRP contained oyster reef provided an accessible and quantifiable environment. Real-time water from the HRE below maintains the nutrient content integrity for the oysters; this is virtually the same water flowing over wild oysters in the decaying piling fields around Pier 40. (Dissolved oxygen was expected to be different as the process of pumping and tank out-fall will aerate the TRP oyster reef water). Though not entirely realistic, the contained reef had the benefits of a known resident count (exactly how many small native fish and crabs) from the reef ecosystem, the approximate oyster size, oyster count, direction of flow, and confounding variables such as wind and re-deposition of stirred sediment were not as much of an issue as in other studies [7] . Some studies [7] used flume tunnels of mesh in order to isolate their desired reefs of study, and similarly the tank system achieved this—though with greater temperature variance potential due to surrounding air temperature and its position close to the Wetlab main entrance.
The impact of other filter feeders was addressed by a thorough cleaning of the estuarium PVC pipe system to remove sea squirts and invertebrates before the study commenced. However, the combination of oysters and their neighboring native species and reef inhabitants best depicts an oyster reef’s filtration power [24] . There have been a minority of mud dog whelk snails and sand shrimp in the oyster reef tank as well as several lined sea horses, northern pipefish and oyster toadfish which are not filter feeders. Their presence added a facet of ecological realism to this study.
Fluctuations of water flow into Tank A were detected using a standard FlowRite™ meter in summer of 2014 (Perrino, personal observation); however, this is not entirely problematic as flow variation is part of the natural environment [31] . Flow rate before sampling was recorded in order to include this variable in the final analysis. The purpose of this study is to quantify the consumption of phytoplankton by a known number of C. virginica in a known volume of water; therefore, water flow is of related importance. The time of sampling was recorded for analytical consideration of tide, and determination of whether ebb or flood tides impact these subtidal oysters’ feeding. The sampling times were kept to four regular times per sampling day; however, sampling day intervals were varied. In general, sampling was two days a week (from 8AM to 6PM). This study was ultimately a short-term research project. Yet, it served to establish a working methodology by which TRP can conduct future long-term analysis of oyster populations.
5. Results
After completion of data collection, the chlorophyll-a concentrations for each data set were determined using an adaptation of the Standard Methods [25] equation for determination of chlorophyll-a, with 26.7 as the absorbance correction value.
The calculated chlorophyll-a levels were entered into a master data table (Table 1) alongside the recorded environmental conditions (Appendix 4) of main tank water temperature (˚C), dissolved oxygen (ppm), pH, salinity (ppt), turbidity (secchi cm), flow rate into Tank A (gal/min), and tide (meters relative to sea level). The filtration efficiency (FE) was then calculated as the percentage of chlorophyll-a removed from circulation in the artificial reef’s water.
A comment is required at this point regarding the data and decisions on how to handle incongruous results. On the first date of sampling (18 September 2014) one of us (Perrino) learned that the Spectronic 20 lacked a spring to aid in stopping the cuvette at a consistent depth. Perrino created an alignment marking to press each cuvette into the sample chamber. From 23 September 2014 onward the readings were standardized to this mark. The first four data points from 18 September 2014 as they were not standardized and do not properly portray the oyster filtration efficiency (FE).

Table 1. Study variables, excluding data points with negative FE.
For analysis purposes the data points with negative FE’s were put aside. From both daily observation notes and comparison of graphs, these are all anomalous values related to either dramatic mechanical changes such as aquarium pump malfunction or significant chemical change of the Hudson River. There is no intention of hiding the difficulties of this study. The Discussion section contains due mention of the unexpected events surrounding some of the sampling, which may illuminate the outlier values. Excluded outlier values can be seen in red in Appendix 4.
6. Analysis
The chlorophyll-a concentrations in Tanks A and B (Appendix 5) and the filtration efficiency (FE) values do not visibly appear to be normally distributed (e.g., Figure 2). However, the kurtosis value for FE (1.18) suggests a normal distribution. Chlorophyll-a concentrations in Tanks A and B have kurtosis values (13.50 and 14.31 respectively) that suggest against a normal distribution. A more objective approach was used with the Shapiro-Wilk test. Filtration efficiency was found to be normally distributed (SW = 0.940, df = 28, p = 0.098); neither chlorophyll-a concentrations in Tank A (SW = 0.470, df = 28, p < 0.001) or B (SW = 0.440, df = 28, p < 0.001) are normally distributed.
Because Tanks A and B have non-normal distributions, a log transformation was attempted, but not successful in normalizing the data for statistical analysis. A square-root transformation was only successful for Tank A; the calculated p-value for Tank B still rejected the null hypothesis for normal distribution.

Figure 2. Histogram of filtration efficiency values.
Because the goal was to compare two matched (because Tank A water ultimately flowed into Tank B the sample A, and sample B data cannot be treated as independent) interval data sets with non-normal distributions, a non-parametric statistical test that did not require large sample size or normally distributed data was. The Wilcoxon Matched Ranks Test determined whether there was a significantly lower chlorophyll-a concentrations post-filtration (Z = 4.620, p < 0.001).
A Pearson’s Product Moment (two tailed) correlation matrix (Table 2) displayed potential interactions between all variables. Filtration efficiency had a significant positive correlation with DO (r = 0.437, p < 0.05) and salinity (r = 0.540, p < 0.01). Dissolved oxygen also had a significant positive correlation with both salinity (r = 0.431, p < 0.05) and pH (r = 0.520, p < 0.01). Temperature of the main tank water had a significant positive correlation with secchi depth turbidity (r = 0.54, p < 0.01) and flow rate (r = 0.786, p < 0.01; the highest of all significant correlation coefficients in this study). Turbidity also had a significant positive correlation with flow rate (r = 0.472, p < 0.05).
7. Discussion of Results
This study set out to contribute to a larger body of information on Crassostrea virginica functioning along the east coast of the United States. Specifically, a fraction of the filtration efficiency of these bivalves was observed and quantified. The overall objective of creating this additional data concerning C. virginica in the setting of Pier 40 New York City was to increase comprehension of how these organisms fare in similar parts of the Hudson Raritan Estuary (HRE). The more information gathered on this species, the better for well-informed actions yet to come related to local oyster reintegration projects. While this study did accomplish this goal, it left only a slight dent in the figurative unexamined-topics pile, because the sample size was smaller than hoped. The research goal of observation of eastern oyster FE as winter dormancy approached was not fully realized because study had to conclude before the reef FE could be affected by dropping temperatures; the oysters were returned to the HRE at the behest of TRP. Lastly, the intent to ascertain which environmental factors most impacted this oyster reef FE, was only partially successful.
Table 2. Correlations between variables, with significant values italicized. Pearson’s r(27) > 0.374 significant at p < 0.05 (*); r(27) > 0.479 significant at p < 0.01 (**); r(27) > 0.588 significant at p < 0.001 (***).
Over the two-month span of the study in early fall of 2014, water temperature gradually decreased as expected. The abundance of suspended matter in the water column (indicated by increasing turbidity) towards the end of the study was anticipated as algal growth tends to briefly boom in the HRE in autumn. Generally, environmental limiting factors of this study interacted predictably. The results of this study on oyster filtration efficiency are in line with the expected filtration behaviors previously documented [14] [21] [28] , and also give insight into how C. virginica filters water in this unique geospatial scenario.
7.1. Filtration Efficiency and Chlorophyll-a Concentration
This measure of the eastern oyster reef filtration efficiency (FE) serves as a baseline for future endeavors with oysters in the HRE. Though the sample size was small, there are several observations that can be made of the oyster reef’s FE over the course of this study. Firstly, the given period of time from mid-September to mid-November did not show a significant overall shift in average FE (R2 < 0.001, p < 0.001; Appendix 6). The conditions of the HRE through this time of autumn only seem to have marginally impacted the filtration functioning of the reef. This generally steady FE was not unusual given that this research did not enter the month of December, during which environmental conditions below 8˚C typically trigger oyster dormancy [7] , nor was there equal sampling for all time periods (8AM, 10AM, 12PM and 2PM). The variation of FE per sampling day alone can be appreciated and future research ought to equally collect data for all timeframes. A more dramatic shift would likely be observed if research were to span more of the seasonal change (such as March through November). As with any study, the more data collected, the better for accurately producing well-founded connections.
The chlorophyll-a concentrations in both Tank A and B declined over the course of the study. Initially the drop in concentration was acute from high concentrations, but values plateaued through the month of November. It is possible that a surge from the pump pulsed some of the pipe system plankton into the reef display at the times sampled. While the Hudson River increased in turbidity from September to November, which includes both suspended organic plankton and inorganic sediment matter, the general chlorophyll-a levels decreased in the oyster reef display at The River Project. Because a late autumn algal bloom is typical in the HRE it is unexpected that the tanks’ chlorophyll-a content would diminish. One possibility for this decline is the presence of and potentially increased filter feeding of sessile organisms (barnacles, anemones, sea squirts, clams, blue and ribbed mussels) in the PVC piping that leads towards the oyster reef display—the oyster reef display is the final segment of pipe in the estuarium. At two points during the functional season of the estuarium the pipes were completely cleaned. Due to the complicated nature of full pipe removal to clean, it was not possible to constantly ensure the oysters received the HRE water completely unfiltered. Also, in order to clean the pipes, water flow must be halted and this is stressful for all resident estuarium organisms. Therefore, it is necessary to emphasize once more that this research is proximal and not exactly in situ in terms of field conditions for the oysters.
The method used for FE calculation assumes that the oysters are filtering chlorophyll-a and no new chlorophyll-a is being produced by the estuarium. Overall the mean chlorophyll-a concentration was statistically higher in the pre-filtration Tank A (0.056 mg/m3) than in post-filtration Tank B (0.036 mg/m3). If Tank B’s mean was greater than Tank A, it would appear that chlorophyll-a was added in the Main Tank (either by organismal activity or resident epiphyton). For instance, there had been a small shoal of banded kili fish in the oyster reef, and if they had all been startled at the same moment near the bottom sediment their movement towards safety amongst the oysters may simultaneously re-suspended matter in the water column and triggered the oysters to close for a period. Because this was an ecosystem display which included other species, there was bound to be a certain amount of unexplained variability. Also, given the nature of a habitat-accurate tank, there were areas unable to be kept free of epiphytic algae at all times. As already noted, there were individual events that led to measurements of higher concentrations of chlorophyll-a in Tank B; these were associated with external disturbances.
7.2. Environmental Factors
While it was anticipated that the dissolved oxygen content of the main tank water would increase as temperature decreased, there was an additional interaction with dissolved oxygen content that became apparent. Specifically, the data concerning pH and DO implicate a natural event here in the HRE. When autumn nears the month of December, microbiologists who have studied the HRE observe an annual algal bloom surge. As algae phytoplankton grow, carbon dioxide is removed through the process of photosynthesis. The result is a higher pH as levels of hydroxide increase (M. Levandowsky, personal communication, 13 May 2015). During photosynthesis algae blooms may lead to super saturation of DO and conversely in respiration blooms remove DO from the water column. During the day algae typically undergo the process of photosynthesis, and overnight in the absence of light algae undergo respiration. Thus a flux is created in areas of high algal concentration. It is likely that the HRE was in the beginning stages of the annual event when this study drew to a close, as preferred water temperatures for such to occur range from 16˚C to 27˚C. DO content and pH increased towards the end of the study in mid-November (Appendix 4). Also indicative of higher levels of suspended materials in the water, Tank A showed greater turbidity at the end of the study than when it commenced in September (Appendix 6).
Completely in situ field conditions for eastern oysters typically experience cross-directional water flow as tides, rain and waves pulse the aquatic environment. However, in this particular study the flow of new water moved roughly in a singular direction down and through the large main tank to an outflow pipe. While the estuary water is “real time” HRE water, it must be delivered to the tank through a series of PVC pipes by a pump. Dependence upon machinery always comes at a price. As The River Project estuarium pump from the previous season met with difficulties part-way through this study, the flow rate into the main tank of the oyster reef fluctuated. After several weeks of mechanical malfunction, The River Project replaced the pump altogether. The impact upon subsequent data was a decrease in flow rate over the oyster reef. Originally the flow rate averaged 5 gal/min, but by the end of the study the mean flow rate was 3.5 gal/min. According to literature and prior research, the rate of water flow over oyster beds impacts filtration gaping by increasing it as flow increases [14] .
7.3. Variable Correlation
Correlation coefficients were calculated between all water quality parameters and the filtration efficiency, as well as with each other. The purpose of this stage in analysis was to discern which of the environmental attributes had relationship to the FE, and also to look into the potential joint environmental factors that could contribute together to the FE variations. The greatest correlation in this study was between temperature and flow rate. Yet, while the data supports a significant relationship, the actual flow rate changes are mostly a result of a mechanical pump.
The highest significant correlation coefficient with FE and an environmental condition was between FE and salinity. Meanwhile temperature and FE rendered a small, insignificant correlation coefficient. This countered previous documentations that temperature strongly correlated to oyster FE [19] [32] . Literature indicates the import of salinity, temperature, and dissolved oxygen among other conditions on the eastern oyster’s behavior [14] [19] . However, the data only showed relationships of FE with the DO and salinity levels of the HRE.
There were several unexpected events through the course of research that may have impacted filtration efficiency values. As mentioned in the Results section, confounding values of filtration efficiency were produced on 18 September 2014 when the spectrophotometer chamber depth was not yet standardized. In pressing the cuvette to varied depths the light passed through different parts of each chlorophyll-a sample and reflected to the measuring phototube, impacting the meter readout. The first day of sampling, irrational FE percentages were calculated (such as −32.33, −3000 and −59,900). As a prudent decision to only analyze data on a continuum of sound lab practice, the first day’s numbers have been set aside. Upon realization of the impact this mechanical nuance had on accurate FE values, the Spectronic 20 machine sample chamber was marked in order that all samples would be processed identically.
On several occasions The River Project water pump failed. More than once, the pump struggled with bringing up water from the Hudson, and large air bubbles could be heard traveling along the length of the pipes, sputtering out at one of the eight tank inputs. The pump pulsed terribly like this on 10 October 2014; every Tank A and B sample filtration produced very dark filter media and the tank water appeared more turbid than usual. There was such a high load of matter in the water column that none of the oysters were gaping in feeding behavior, and the resulting FE percentages were unusual: −88.99, −57.71 and −204.35. Such FE values indicated that chlorophyll-a was being added to the water rather than removed. These are classified as outliers; however, the 2PM sample set was kept. By that point, the pump had levelled and turbidity improved by 50 cm. The sample filter media appeared more normal in color and amount of trapped matter as well. Unfortunately, the issues with the estuarium pump only worsened and The River Project was forced to replace the unit used during the season to that point. For purposes of continuity in the study data there was nothing to do but carry on sampling. From 11AM-1PM on 14 October 2014 the pump was completely off and the resulting FE from the 12PM sample set was classified as “outlier”. While the new pump installed was the same make and power as the previous, the flow rate was notably lower and air bubbles could often be heard in the pipes near the oyster reef display.
An interesting moment in the course of this research occurred on 23 September 2014. Each time a set of samples had been successfully gathered, the oyster reef was observed to get a general summary of how far open the oysters gaped, which reef ecosystem organisms were mobile, and how the water looked in the main tank and the HRE. At 12PM a cursory glance showed that all oysters were firmly shut. This was strange as they typically filtered at this point in the afternoon and because the front door was open for a River Project field trip underway, there was sunshine streaming into the main tank, usually a trigger for the oysters to gape. A vivid oil slick had covered the river the entire length of Pier 40. Later confirmed by staff members at TRP, this was one of the largest spills seen on the HRE in several years, likely from directly upriver where many tour and cruise boats dock. It is remarkable to see oysters’ sensitivity to environmental chemical stressors. The oysters in the reef remained closed for approximately two hours until the slick moved downstream out to sea.
7.4. Implications
This study lends to both economic and practical implications. While it is known that eastern oyster reefs provide valuable ecosystem services [28] , little data quantify how efficiently these organisms filter the waters of the HRE. The relative composition of The River Project oyster reef is known from the close of the study and this study’s data can make a rough statement of how efficient a reef of 322 oysters of an average 2.91 cm size are at filtering the water of this estuary. Due to the long-term plans TRP has for these particular oysters, a dry weight was not possible to obtain. Investments in oyster restoration projects rely on the ability to predict potential benefits, as well as the impacts prevailing background conditions may have on the oysters’ success. Especially in waters where nutrient pollution and erosion combine in tandem degradation of water quality and lead to phytoplankton blooms, ecosystem managers are interested in data that incorporates oyster filtration performance. By providing data on eastern oyster filtration in their native HRE environment, perhaps their value to this region will be successfully articulated [21] .
This study can supplement necessary risk assessment that ensues before coastal engineering projects typically launch, for it is important to accurately portray how reefs filter under varied conditions—anthropogenic and naturally-driven alike. Not only do reintroduction projects hinge on such information, but construction permits and dredging projects could either be allowable or denied based on the sediment and water quality impact on key oyster reefs. Perhaps in order to offset the consequences of certain shoreline projects, analysis of potential eastern oyster filtration could be mandatory.
Other practical implications of this study relate to future research. As remote sensing methods of researching the HRE are utilized more, knowledge of how various sized reefs function in filtration will be helpful in appreciation of visible phytoplankton events in the estuary system. If and when reefs are established throughout, it would be beneficial to understand the potential chlorophyll-a clearance these organisms can execute. Though filtration rate models often fall short of making realistic predications that are accurate in the ever-changing estuary systems [21] , having information on filtration efficiency in the HRE may contribute eventually to bioenergetics models for C. virginica in the future.
An oyster reef’s composition is always in flux as some individuals have optimal positioning for filtration and security while some are more vulnerable or disadvantaged by encroaching oysters. Given the fact that TRP commonly does not lift the reef from May to November, sediment and silt collected in and around the oysters and may have ultimately smothered a number of individuals. Suffocation is a possibility for oysters in an estuary such as the HRE, given the fine nature of the generally sediment-heavy water most of the drastic decline in oyster reef display population size from spring to fall is due to TRP-advised removal of almost 200 oysters in order to avoid overcrowding which can kill disadvantageously positioned oysters.
7.5. Future Study: Strengths and Weaknesses
Research of eastern oysters in the lower reach of the Hudson River, of the Hudson-Raritan Estuary system, is sparse. This study served as a baseline for knowledge of how efficiently C. virginica filter feed in these waters. Calling upon the methodology for spectrophotometric determination of chlorophyll-a written in “Standard Methods”, this study was based upon a rational and proven foundation. As mentioned through this study’s design, a benefit of sampling at the River Project on Pier 40 was that the eastern oyster reef received real-time, minute-by-minute HRE water through an unfiltered pipe network. This contained reef display allows observation of the sessile organisms relatively close to what their actual estuary habitat would be like. Another asset to this study was the use of oysters raised in this particular body of water. Previous researchers have had to procure spat and adult oysters from Long Island Sound oyster cultivators. However, the River Project has kept suspended oyster cages in the HRE now for multiple years and from this population the reef population is selected annually. This removed from the possible variable of regional adaptation within the species.
Despite the usefulness the reef display set-up lent to this research, there were also shortcomings that create disparity with true field conditions. Firstly, one must acknowledge the pulsing of water throughout the estuary can only somewhat be recreated in the pipe-fed display these oysters inhabited during the study. Water moved mainly unidirectionally through the main tank and lacked the turbulence that waves and wind would generate. Also, as the oyster reef studied served as habitat for other native organisms, the study could not entirely control tank conditions. Certain movements of oyster shells may have been in response to feeling vibrations of sea horses or pipefish feeding nearby. This reef display in its entirely was used as a public educational tool at TRP, as an example of what the oyster beds that once were plentiful in these waters would have looked like—rich in biodiversity and ecological services. In order for field trips and public to see 360˚ around the reef it was placed in the very front of the Wetlab. This unfortunately put the reef proximal to broad daylight if the TRP main door is raised, or near a heat-conducting garage door if TRP has closed the Wetlab. Such positioning has led the oyster tank to be influenced from the surrounding air temperature, and there has been mention of possible acquisition of a chilling system for the front-most display.
It was not possible to completely control for the presence of epiphytic plankton development in the main tank, which in a few instances may have contributed towards the Tank B chlorophyll-a concentration. The tank walls were scraped free of plankton each time sampling was completed for the day; however, that does not account for the bottom of the tank where sediment and organic matter can collect. Future study could include a third set of Main Tank chlorophyll-a concentration samples for better observing the possibility of epiphytic growth. The study would have benefitted from a longer sampling period, but seasonal constraints for the oysters remaining in the reef display limited time available.
8. Conclusions
With freshwater inputs from four tributary rivers modifying the wind and tidal currents, study on the Hudson-Raritan Estuary is challenging. Monitoring the HRE often cannot be achieved through traditional methods [8] . Therefore, there is tremendous advantage in unconventional modes for observing this dynamic estuary. The River Project estuarium on Pier 40 in New York City provided one such ecosystem observation opportunity. For over five years this non-profit has maintained a small population of Crassostrea virginica, nurtured with real-time HRE water, on their premises.
The eastern oyster population along the East Coast has been shattered over the past century. While reefs of this species are functionally extinct in the HRE (over 99% decline) [3] , those that remain in the wild continue to carry out important ecosystem services. These filter feeders aid in storm surge protection, water clarity improvement, trophic complexity, enhance species diversity as they provide refuge—important to many in the world—a harvestable oyster population. Of particular interest is the function of eastern oyster reefs in water filtration. Oysters are sessile organisms reliant upon suspended phytoplankton in the passing water column to remain alive; in daily filtration processes the oysters remove both organic and inorganic suspended particles and redeposit as either pseudo or real feces [21] . These autogenic engineers help reduce hypoxia in estuary ecosystems by reducing phytoplankton quantity. While many bioenergetics models attempt to create filtration rate equations, they often prove insufficient and cannot be applied to estuaries indiscriminately [21] . Typically, these models estimate rates or efficiency at an ideal pace and do not factor in the dynamic estuary setting that is hardly continuous.
If oysters are to be reintroduced to stretches of the HRE, comprehension of the organismal adaptations on a local scale would be worthwhile. Despite general concern in the environmental community for the population health of eastern oysters, there are few effects data for the oysters that are relevant to the field conditions of the Lower HRE. Ecosystem management is rife with intricacy, and often the majority of groups involved also lack money and commitment to conduct long-term planning [4] . Thus it is essential to grapple with more realistically quantifying species attributes in order to warrant that current management goals are not misguided [1] . R. E. Grizzle and colleagues concluded their 2008 article [7] with this same sentiment: “More research on the feeding behavior of oysters in nature including a wide range of size classes and under various environmental conditions is badly needed” (p. 1218). Likely this is a significant source of resistance in the indecision surrounding their reintroduction.
Though eastern oysters display fairly high tolerance levels to elevated sediment content in their aquatic environment [28] , as well as shifts in other water quality parameters, the population remains declined in the Hudson-Raritan Estuary. With the capability to provide environmental services of infrastructure for the estuary organisms to inhabit, water quality improvement, and even wave energy attenuation, this species is an asset to any region it populates [28] . It is our hope to see the study replicated at the same location in coming years followed by comparative analysis. Although it is much work to do, there is hope in the possibility of reestablishing the ecosystem service of water filtration to levels that will benefit estuary ecology [5] . The tristate ecosystem managers will only reach informed decisions concerning oyster resource development with continued investigations in local waters.
Acknowledgements
We want to extend deep appreciation to Dr. Tih-Fen Ting and Dr. Michael Lemke at the University of Illinois Springfield and the staff and board members of The River Project NYC (in particular, Ms. Cathy Drew and Michael Levandowsky, and Ms. Nina Zain).
Conflicts of Interest
The authors declare no conflicts of interest regarding the publication of this paper.
Cite this paper
Perrino, J.E. and Ruez Jr., D.R. (2019) Eastern Oyster (Crassostrea virginica) Filtration Efficiency of Chlorophyll-a under Dynamic Conditions in the Hudson-Raritan Estuary at Pier 40, New York City. Open Journal of Ecology, 9, 238-271. https://doi.org/10.4236/oje.2019.97019
References
- 1. Zu Ermgassen, P.S.E., Spalding, M.D., Grizzle, R.E. and Brumbaugh, R.D. (2013) Quantifying the Loss of a Marine Ecosystem Service: Filtration by the Eastern Oyster in US Estuaries. Estuaries and Coasts, 36, 36-43. https://doi.org/10.1007/s12237-012-9559-y
- 2. Brumbaugh, R.D., Beck, M.W., Coen, L.D., Craig, L. and Hicks, P. (2006) A Practitioner’s Guide to the Design and Monitoring of Shellfish Restoration Projects: An Ecosystem Services Approach. The Nature Conservancy, Arlington.
- 3. Beck, M.W., Brumbaugh, R.D., Airoldi, L., Carranza, A., Coen, L.D., Crawford, C., Defeo, O., Edgar, G.J., Hancock, B., Kay, M., Lenihan, H., Luckenbach, M.W., Toropova, C.L. and Zhang, G. (2011) Oyster Reefs at Risk and Recommendations for Conservation, Restoration, and Management. Biological Science, 61, 107-116. https://doi.org/10.1525/bio.2011.61.2.5
- 4. Coen, L.D., Knott, D.M., Wenner, E.L., Hadley, N.H., Ringwood, A.H. and Bobo, M.Y. (1999) Intertidal Oyster Reef Studies in South Carolina: Design, Sampling, and Experimental Focus for Evaluating Habitat Value and Function. In: Coen, L.D., Knott, D.M., Wenner, E.L., Hadley, N.H., Ringwood, A.H. and Bobo, M.Y., Eds., Oyster Reef Habitat Restoration: A Synopsis and Synthesis of Approaches, Virginia Institute of Marine Science Press, Gloucester Point, 133-158.
- 5. Newell, R.I.E. and Koch, E.W. (2004) Modeling Seagrass Density and Distribution in Response to Changes in Turbidity Stemming from Bivalve Filtration and Seagrass Sediment Stabilization. Estuaries, 27, 793-806. https://doi.org/10.1007/BF02912041
- 6. Rothschild, B.J., Ault, J.S., Goulletquer, P. and Heral, M. (1994) Decline of the Chesapeake Bay Oyster Population: A Century of Habitat Destruction and Overfishing. Marine Ecology Progress Series, 111, 29-39. https://doi.org/10.3354/meps111029
- 7. Hadley, N.H., Hodges, M., Wilber, D.H. and Coen, L.D. (2010) Evaluating Intertidal Oyster Reef Development in South Carolina Using Associated Faunal Indicators. Restoration Ecology, 18, 691-701. https://doi.org/10.1111/j.1526-100X.2008.00502.x
- 8. Grizzle, R.E., Greene, J.K. and Coen, L.D. (2008) Seston Removal by Natural and Constructed Intertidal Eastern Oyster (Crassostrea virginica) Reefs: A Comparison with Previous Laboratory Studies, and the Value of in Situ Methods. Estuaries and Coasts, 31, 1208-1220. https://doi.org/10.1007/s12237-008-9098-8
- 9. USACE, HDR Inc., URS Corp., The Port Authority of NY-NJ, NY-NJ Harbor Estuary Program, and Hudson River Foundation (2009) Hudson-Raritan Estuary Comprehensive Restoration Plan: Draft. https://www.nan.usace.army.mil/Portals/37/docs/harbor/Harbor%20Program%20Images/CRP%20vol1.pdf
- 10. Grizzle, R.E., Greene, J.K., Luckenbach, M.W. and Coen, L.D. (2006) A New in Situ Method for Measuring Seston Uptake by Suspension-Feeding Bivalve Molluscs. Journal of Shellfish Research, 25, 643-649. https://doi.org/10.2983/0730-8000(2006)25[643:ANISMF]2.0.CO;2
- 11. Bagheri, S., Rijkeboer, M. and Gons, H.J. (2002) Inherent and Apparent Optical Measurements in the Hudson-Raritan Estuary. Aquatic Ecology, 36, 559-562. https://doi.org/10.1023/A:1021114112617
- 12. The Harbor School of New York (2013) Billion Oyster Project. https://www.billionoysterproject.org/about
- 13. Stanley, J.G. and Sellers, M.A. (1986) Species Profiles: Life Histories and Environmental Requirements of Coastal Fishes and Invertebrates (Gulf of Mexico): American Oyster. Army Corps of Engineers, Coastal Ecology Group, Waterways Experiment Station, Biological Report, United States Fish and Wildlife Service, Vicksburg, 82.
- 14. Kennedy, V.S., Newell, R.I.E. and Eble, A.F. (2009) The Eastern Oyster: Crassostrea virginica. Maryland Sea Grant College, College Park.
- 15. Galstoff, P.S. (1964) The American Oyster Crassostrea virginica Gmelin. Fisheries Bulletin, 64, 1-480.
- 16. Wheaton, F. (2007) Review of the Properties of Eastern Oysters, Crassostrea virginica: Part I. Physical Properties. Aquacultural Engineering, 37, 3-13. https://doi.org/10.1016/j.aquaeng.2006.07.004
- 17. Eble, A.F. and Scro, R. (2009) Chapter 1. General Anatomy. In: Kennedy, V.S., Newell, R.I.E. and Eble, A.F., Eds., The Eastern Oyster: Crassostrea virginica, Maryland Sea Grant College, College Park, 19-71.
- 18. Newell, R.I.E. and Langdon, C.J. (2009) Mechanisms and Physiology of Larval and Adult Feeding. In: Kennedy, V.S., Newell, R.I.E. and Eble, A.F., Eds., The Eastern Oyster: Crassostrea virginica, Maryland Sea Grant College, College Park, 185-223.
- 19. Fulford, R.S., Beitburg, D.L., Newell, R.I.E., Kemp, W.M. and Luckenbach, M. (2007) Effects of Oyster Population Restoration Strategies on Phytoplankton Biomass in Chesapeake Bay: A Flexible Modeling Approach. Marine Ecology Progress Series, 336, 43-61. https://doi.org/10.3354/meps336043
- 20. Nelson, T.C. (1960) The Feeding Mechanism of the Oyster. II. On the Gills and Palps of Ostrea edulis, Crassostrea virginica, and Crassostrea angulate. Journal of Morphology, 107, 163-191. https://doi.org/10.1002/jmor.1051070205
- 21. Ehrich, M.K. and Harris, L.A. (2015) A Review of Existing Eastern Oyster Filtration Rate Models. Ecological Modelling, 297, 201-212. https://doi.org/10.1016/j.ecolmodel.2014.11.023
- 22. Lide, D.R. (2009) CRC Handbook of Chemistry and Physics. 90th Edition, CRC Press, Boca Raton.
- 23. Larkum, A.W.D., Douglas, S.E. and Raven, J.A. (2003) Photosynthesis in Algae. Kluwer Academic Publishers, London. https://doi.org/10.1007/978-94-007-1038-2
- 24. Wetzel, R.G. and Likens, G.E. (1991) Limnological Analyses. 2nd Edition, Springer-Verlag, New York. https://doi.org/10.1007/978-1-4757-4098-1
- 25. American Public Health Association [APHA], American Water Works Association [AWWA], and Water Environment Federation [WEF] (1998) Spectrophotometric Determination of Chlorophyll-a. In: APHA, AWWA, and WEF, Eds., Standard Methods for the Examination of Water and Wastewater, 20th Edition, United Book Press, Inc., Baltimore, 10/19-10/20.
- 26. USFWS (1997) Significant Habitats and Habitat Complexes of the New York Bight Watershed. Coastal Ecosystem Program, Charlestown.
- 27. Levinton, J.S. and Waldman, J.R. (2006) The Hudson River Estuary. Cambridge University Press, Cambridge. https://doi.org/10.1017/CBO9780511550539
- 28. Suedel, B., Clarke, J., Wilkens, J., Lutz, C. and Clarke, D. (2015) The Effects of a Simulated Suspended Sediment Plume on Eastern Oyster (Crassostrea virginica) Survival, Growth, and Condition. Estuaries and Coasts, 38, 578-589. https://doi.org/10.1007/s12237-014-9835-0
- 29. NYC Department of Environmental Protection [NYCDEP] (2003) New York Harbor Water Quality Regional Summary. NYCDEP, New York.
- 30. The River Project (TRP) (n.d.) The River Project. http://www.riverprojectnyc.org
- 31. Porter, E.T., Cornwell, J.C. and Sanford, L.P. (2004) Effect of Oysters Crassostrea virginica and Bottom Shear Velocity on Benthic-Pelagic Coupling and Estuarine Water Quality. Marine Ecology Progress Series, 27, 61-75. https://doi.org/10.3354/meps271061
- 32. Cerco, C.F. and Noel, M.R. (2005) Evaluating Ecosystem Effects of Oyster Restoration in Chesapeake Bay: A Report to the Maryland Department of Natural Resources. US Army Engineer Research and Development Center, Vicksburg.
Appendix 1. Data Collection Sheet
Appendix 2. Protocol: Spectrophotometric Determination of Chlorophyll-a
• Sampling: carried out at oyster reef
• NOTE—Needs to be quick in order to not impact the photosensitive chlorophyll
o Check Supply List 1, ensure that all required materials are on hand.
o Have the 4 clean sample beakers (at least 250 mL); 2 samples of water before entering the reef, and 2 samples of water after exiting the reef.
o Take 2 (“1a” and “1b”) sample beakers, record time and conditions, fill “1a” at the initial Inflow (first tank nearest the door)—wait 20 minutes to allow water passage through tank, and fill one at the final Outtake (third tank nearest the Boathouse). Fill both to very top of jar & cap.
□ The first set collected includes “1a” and “1b”—Close Lids—Place in black bag on tray and close bag.
o Fill next set of 2 sample beakers; make note of time.
□ Label these “2a” and “2b”—Close Lids—Place in black bag on tray and close bag.
□ Record water temperature (˚C/˚F) at end of sampling.
**This gives two data points, when methods are completed—repeat in order to get 4 samples in a given day**
o Quickly move these samples to the back room away from UV light.
• Pigment Extraction: carried out in Back Room
o Check Supply List 2, ensure that all necessary solutions and materials are present.
o Concentrate Sample
□ Loosen Nalgene vacuum container white locking ring to separate the upper and lower chambers.
□ Place a GFF microfiber filter media on the white membrane support plate.
□ Place top of container back on and re-tighten white locking ring, double-check snugness.
□ Secure the clear tubing to the lower Nalgene chamber and secure the other end to gray hand vacuum pump.
□ Open very TOP of upper Nalgene chamber; invert first sample jar 3x and steadily pour 250 mL in “1a” ought to be first sample processed, continue in order that samples were drawn. Record volume poured into upper chamber (as close to 250 mL as possible!).
□ Utilize gray hand vacuum to draw entire sample through the chamber barrier. This takes 5 minutes on average for one sample. CAREFULLY watch the pressure gauge: As the needle reaches a point of resistance and cannot move any further, allow ~30 seconds of no pumping. The sample will continue to filter through the microfiber media … occasional pausing to equilibrate will keep the draw steady.
□ When filtration of a sample is complete, lift from filtration plate and place on clean aluminum foil piece and fold it INWARD in half upon itself to keep chlorophyll-a trapped. Each sample gets its own filtration process and needs to be wrapped in foil and set aside for grinding.
□ Rinse Nalgene upper chamber with hose fresh water in between filtrations.
o Grind Filter Media
□ Check Supply List 3, ensure that all needed items are on-hand.
□ Remove the microfiber filter media and place in mortar for grinding.
□ Put 3 mL 90% aqueous acetone solution over the filter.
□ Use pestle to grind the media to pulp for 2 minutes using a combination of circular and tapping motions so fibers do not remain on the sides but are pulverized until a slurry results.
□ Transfer slurry to a centrifuge tube and keep as much of the slurry of the centrifuge sides as possible.
□ Rinse mortar with 3 mL of aqueous acetone and pour into centrifuge tube without touching sides if possible.
□ Adjust total volume to 10 mL with a final 3.9 mL of aqueous acetone (0.1 mL is displaced by GFF filter itself). Repeat for all samples. Rinse mortar and pestle in between sample with 1 mL acetone each pour into waste jar.
□ Allow samples to steep for at least 2 hours.
o Clarify Sample
□ Centrifuge the 4 paraffin-closed tubes (be sure these are carefully labeled) at 500 g for 20 min. Place tubes opposite one another in metal holders so that machine is balanced. Record time started.
□ When time is up Record time machine is stopped. Take each tube and gently flick a few times to get fibers off of side walls. Centrifuge an additional 2 min.
*TURN ON Spectrophotometer by plugging in extension cord and turning on L knob*
□ Slowly decant each clarified extract into clean graduated cylinder-measure and record total volume of extract obtained.
• Determination of Chlorophyll-a In the Presence of Pheophytin:
o Check Supply List 4, ensure all necessary materials are on-hand.
o BE ACCURATE with volumes and timing, for consistent results.
□ “Zero” The Spectronic: Make sure Spectrophotometer has been on for at least 2 hours. Set the wavelength via top right knob to first desired reading wavelength for part “A” below (664 nm is first).
• Turn left lower knob until dial points to “0”àFill a new round cuvette with aqueous acetone and place into sample holder until it won’t go further, close black coveràTurn right lower knob until transmittance reads “100%”. Do this process before EACH reading (2 absorbance measures are recorded each day, therefore 2 “zeroes” will be necessary).
o A—Transfer 3 mL of a centrifuged sample into a new cuvette. Press down into the chamber until top of cuvette reaches the black line on sticker exactly. Read Optical Density (OD) at 664 nm. Enter value into data sheet.
o B—Acidify sample in cuvette: (start stopwatch) add 0.1 mL of 0.1N HCl. Gently agitate with tapping, press into the chamber to the line marker. At 60 seconds after acidification, read the OD at 665 nm. Enter value into data sheet.
□ OD 664 before acidification should be between 0.1 and 1.0—to give you an idea.
o Repeat “A” and “B” for the second set of sample extracts (“2a” and “2b”). Record data.
□ Clean Up and Replace All Supplies [Appendix 3].
Run through the supplies lists and make sure items are ready for next sampling.
Appendix 3. Supplies List
Solutions:
Saturated Magnesium Carbonate = 5.0 g fineMgCO3 powder + 500 mL Distilled Water.
Shake well and let excess water settle overnight.
Aqueous Acetate Solution = 1 part sat. MgCO3: 9 parts 100% Acetone.
A Main Use container will be mixed for study use; it must be used within 14 days of mixing.
Hydrochloric Acid = 0.1N HCl.
Ordered pre-made.
*All liquid solutions kept in opaque well-marked containers on the study case.
Appendix 4. Filtration Efficiency and Environmental Conditions
Appendix 5. Spectrophotometer Optical Density Readings
Appendix 6. Time Series Representation of Data
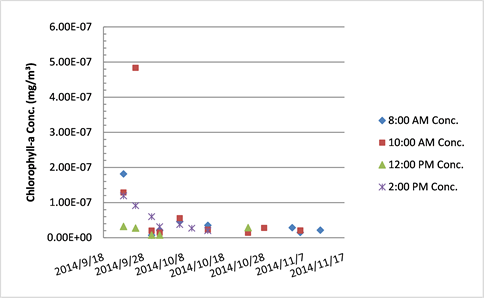
Chlorophyll-a concentration in Tank A.
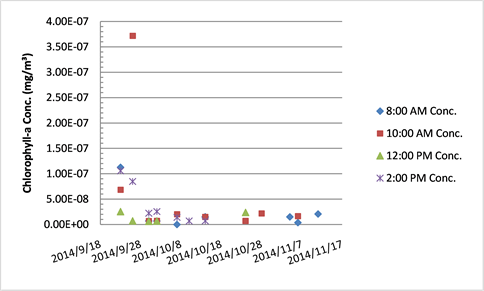
Chlorophyll-a concentration in Tank B.

Oyster reef filtration efficiency (percent of chlorophyll-a removed).

Water temperature (˚C) of Main Tank.

Dissolved oxygen (ppm) levels of Main Tank.

The pH levels of the Main Tank.

Salinity (ppt) of water in Main Tank.

Secchi depth (cm) of the Hudson River Estuary at Pier 40.

Flow rate (gal/min) of water into Tank A (New pump was installed 10/22/2014).