Open Journal of Inorganic Chemistry
Vol.06 No.01(2016), Article ID:62787,43 pages
10.4236/ojic.2016.61003
New Square-Pyramidal Oxovanadium (IV) Complexes Derived from Polydentate Ligand (L1)
Azza A. Hassoon1, Najlaa S. Al-Radadi2, Nagwa Nawar1, Mohsen M. Mostafa1*
1Chemistry Department, Faculty of Science, Mansoura University, Egypt
2Chemistry Department, Faculty of Science, Taibah University, Al-Madinah, Saudia Arabia

Copyright © 2016 by authors and Scientific Research Publishing Inc.
This work is licensed under the Creative Commons Attribution International License (CC BY).
http://creativecommons.org/licenses/by/4.0/


Received 5 October 2015; accepted 12 January 2016; published 15 January 2016
ABSTRACT
New series of oxovanadium (IV) complexes isolated from 2,4,6-tris-(2-pyridyl)-1,3,5-triazine (L1) are incorporated and portrayed using spectroscopic (IR, UV-Vis, ESR, mass spectrometric), magnetic moment, thermal and cyclic voltammetry measurements. The results demonstrate that L1 acts in various styles of chelation with [V3O3(L1)(SO4)3(EtOH)1/2(H2O)3/2] 1), [VO(L1)(2,4-penta- dionate)]・Cl・4HCl 2), [V2O2(L1)(SO4)2(EtOH)5/2] 3), [V2O2(L1)(SO4)2(EtOH)3/2(H2O)1/2] 4), [VO(L1)SO4 (H2O)3/2]・2.5H2O 5) and [V2O2(L1)(SO4)2(H2O)]・H2O 6). The values of magnetic moments and spectral studies suggest a square-pyramidal geometry around the V (IV) ion for all complexes. The molar conductance values suggest that the complexes are non-electrolyte, except the [VO(L1) (2,4- pentadionate)] Cl・4HCl. Molecular modeling calculates the bond length, bond angle, chemical reactivity, energy components (Kcal/mol) and binding energy (Kcal/mol) for the isolated complexes. The in vitro antibacterial studies of these complexes screened against pathogenic bacteria prove them as growth inhibiting agents. Antitumor activity is carried out in vitro on human mammary gland (breast) MCF-7 and cervical cancer cell-HeLa has shown that [VO(L1)SO4(H2O)3/2]・2.5 H2O and [VO(L1)(2,4-pentadionate)] Cl・4HCl complexes display the highest powerful activity between all of the investigated complexes.
Keywords:
Oxovanadium (IV) Complexes, Antimicrobial Activity, Cytotoxic Activity, Breast Cancer

1. Introduction
Vanadium complexes have various biological activities, for example, an insulin-like activity [1] - [2] and the decrease of hyperlipidemia and hypertension. Vanadium has a decent therapeutic potential, moreover, dietary organization restrains synthetically actuated mammary carcinogenesis [3] . Likewise, it is found that concentrations of vanadium, evaluated by X-ray energy fluorescence are observed to be fundamentally higher in malignant bosom tissue contrasted with typical bosom tissue [4] . The complexes of L1 are utilized in various applications like luminescent materials [5] , electrocatalytical [6] , photocatalytic reactions, biocatalytic activity as antitumor agents [7] and as a catalyst [8] [9] . Additionally, they have been utilized for the formation of coordination polymers and networks [9] . Metal complexes have risen as viable alternatives to organic molecules as therapeutic agents in the course of recent decades [10] - [13] . Our goal in this paper is to synthesize and characterize six V4+ complexes by (IR, UV-vis, mass and ESR), magnetic and thermal measurements. The outcomes propose that L1 coordinates in different ways in all complexes through one nitrogen of triazine and nitrogen atoms of pyridine. The DFT outcomes are discussed and the biological studies of the V4+ complexes show promising affect against breast and ovarian cancer.
2. Experimental
2.1. Materials and Methods
All materials and solvents were purchased from BDH and Aldrich quality and used without purification. VOSO4・3H2O was of Aldrich quality and used without purification. Carbon, hydrogen, nitrogen, sulphate and chloride were determined by the standard methods [14] .
2.2. Instruments
IR spectra (400 - 4000 cm−1) using KBr discs and/or Nujolmull were recorded with a Mattson 5000 FTIR spectrophotometer. Electronic spectra were recorded using Unicam UV-visible UV2 and V-100 spectrophotometers. The magnetic measurements were carried out at room temperature (25˚C) using a Sherwood magnetic balance. Diamagnetic corrections were calculated using Pascal’s constants [15] . The mass spectra of the complexes were recorded using a direct inlet unit (DI-50) of a Shimadzu GC/MS-QP5050A mass spectrometer at the Regional Center for Mycology and Biotechnology at Al-Azhar University. Thermogravimetric analysis (TGA) was carried out in the range 20˚C - 1000˚C with a Shimadzu TGA-50 analyser at a heating rate of 15˚C min−1 and nitrogen flow rate of 20 mL・min−1. A powder ESR spectrum was obtained in a 2 mm quartz capillary at room temperature with a Bruker EMX spectrometer working in the X-band (9.43 GHz) with 100 KHz modulation frequency. The results were analyzed after compensating the residual current at the corresponding condition. The electrochemical cell used as conventional three electrode type saturated calomel electrode (SCE) as a reference electrode and Pt wire and glass carbon as auxiliary and working electrode. 0.1 M tetrabutylammonium perchlorate (TBAP) as electrolyte. A scan rate of 50 mV・s−1 was employed.
2.3. Synthesis of Metal Complexes
2.3.1. Synthesis of [V3O3(L1)(SO4)3(EtOH)1/2(H2O)3/2] (1)
The complex was prepared by adding 1 mmol, 0.31 g of 2,4,6-tri-(2-pyridyl)-1,3,5-triazine (L1); dissolved in a mixture of dist. H2O and hot EtOH (9:1) to VOSO4・3H2O (2 mmol, 0.44 g) dissolved in 100 ml H2O. The reaction mixture was refluxed on a hot plate for 2 hrs. The complex was isolated in the pH range 5 - 6. The complex was filtered off, washed successfully with EtOH and diethyl ether, respectively and finally dried in a desiccator over CaCl2. The isolated product is in color. The chemical formula of the green V (IV) complex, [V3O3(L1) (SO4)3(EtOH)1/2(H2O)3/2], is Anal. Found: C, 29.6; H, 2.9; N, 10.2%. Calcd: for C19H18N6S3O17V3: C, 26.8; H, 2.1; N, 9.9%; m.p.; >300˚C; Yield: 60%. The powder IR (KBr, cm−1): 3222 - 3447(OH), 3081 (CH) aromatic, 1486 - 1228 (C-N+C-C), 1550, 1575, 1604, 1651 (C=C+C=N) coordinated, 1685 (C=N+C=N) uncoordinated, 768 (C-H) deformation, 424 (V-N) py, 452 (V-N) triaz, 515 (V-O). MS (70 eV) m/z (%): 852 (M, 1.12), 312 (5), 234 (16), 180 (64), 104 (68), 91 (16), 77 (45), 67 (41), 51(100).
2.3.2. Synthesis of [VO(L1)(2,4-Pentadionate)]・Cl・4HCl (2)
The complex was prepared by adding anEtOH solution of L1; 1 mmol, 0.31 g), and V (IV) oxide bis (2,4-pen- tanedionate) (1 mmol, 0.27 g) dissolved in hot EtOH. The reaction mixtures were refluxed on a hot plate for 2 hrs. The pH of the solution was 5 - 6. On adding few drops of conc. HCl the complex was precipitated in the pH range 2 - 3. The isolated product is brick red in color. Yield 80%; m.p. >300˚C. IR (KBr, cm−1): 3433 - 3478 (OH), 3077 (CH) aromatic, 1485-1223 (C-N+C-C), 1555, 1576 (C=C+C=N) coordinated, 1671 (C=N+C=N) uncoordinated, 787 (C-H) deformation, 424 (V-N)py, 442 (V-N)triaz, 550 (V-O). MS (70 eV) m/z (%): 659 (M, 1.2), 517 (68), 447 (18), 432 (19), 392 (70), 312 (100), 104 (45), 78 (26), (64) (25), (52) (26). Anal. Calcd for C23H23N6O3Cl5V (659.7): C: 41.9; H: 3.5; Cl: 26.9%. Found: C: 42.6; H: 2.9; Cl: 26.4%.
2.3.3. Synthesis of [V2O2(L1)(SO4)2(EtOH)5/2] (3) and [V2O2(L1)(SO4)2(EtOH)3/2(H2O)1/2] (4)
The complex was synthesized by adding 1 mmol, (0.31 g) of L1 dissolved in dist. water and hot EtOH with ratio (1:9) to VOSO4 solution (2 mmol, 0.44 g) dissolved in 100 ml redistilled water H2O. The reaction mixture was refluxed on a hot plate for 2 h. The complex was isolated in the pH range 5 - 6. Yield 50%; green powder; m.p. >300˚C. IR (KBr, cm−1): 3403 - 3445 (OH), 3078 (CH) aromatic, 1478 - 1262 (C-N+C-C), 1603, 1575, 1562, 1542 (C=C+C=N) coordinated, 1686, 1653 (C=N+C=N) uncoordinated, 767 (C-H) deformation, 425, 445 (V-N) pyr, 474, 489 (V-N) triaz, 547, 577 (V-O). MS (70 eV) m/z (%): 753.6 (M, 8.6), 682 (13), 604 (11), 417 (10), 363 (8), 315 (6), 234 (20), 185 (14), 155 (13), 104 (14), 91 (9), 78 (35), 64 (17), 53 (100). Anal. Calcd for C23H27N6O25/2S2V2 (753.5): C: 36.7; H: 3.6; N: 11.1%. Found: C: 37.7; H: 2.6; N: 10.2 % and µeff (3.01 BM). [V2O2(L1)(SO4)2(EtOH)3/2(H2O)1/2] (4) was obtained from the filtrate after cooling. Yield 50%; green powder; m.p. >300˚C. IR (KBr, cm−1): 3269 - 3449 (OH), 3042 (CH) aromatic, 1401 - 1249 (C-N+C-C), 1653, 1588 (C=C+C=N) coordinated, 1683 (C=N+C=N) uncoordinated, 767 (C-H) deformation, 427 (V-N) pyr, 453 (V-N) triaz, 514 (V-O). MS (70 eV) m/z (%): 714 (M-2H, 7.9), 622 (13), 311 (6), 232 (8), 183 (29), 155 (18), 104 (71), 91 (93), 77 (81), 51 (100). Anal. Calcd for C21H22N6O12S2V2(716.44): C: 35.2; H: 3.1; N: 11.7 %. Found: C: 34.8; H: 3; N: 11.2% and µeff (2.66 BM).
2.3.4. Synthesis of [VO(L1)SO4(H2O)3/2]・2.5H2O (5) and [V2O2(L1)(SO4)2(H2O)]・H2O (6)
[VO(L1)SO4(H2O)3/2]・2.5H2O (5) and [V2O2(L1)(SO4)2(H2O)]・H2O(6) were synthesized with different molar ratios 1:1 and 2:1 (M:L), respectively. A hot EtOH solution of L1 (0.312 g; 1.0 mmol) was added to VOSO4・3H2O dissolved in hot EtOH (0.22 g, 0.44 g; 1.0 mmol and 2.0 mmol for 1:1 and 2:1, respectively). The reaction mixtures were refluxed on a hot plate for 2 h. All complexes were filtered off, washed several times with hot EtOH, dried in an oven at 120˚C for 0.5 h and finally kept in a desiccator over CaCl2. [VO(L1)SO4(H2O)3/2]・2.5H2O (5): yield 58%; color brown powder; m.p. >300˚C. IR (KBr, cm−1): 3387(OH), 3069 (CH) aromatic, 1489 - 1215 (C-N+C-C), 1642 (C=C+C=N) coordinated, 1548 (C=N+C=N) uncoordinated, 775 (C-H) deformation, 434 (V-N)pyr, 486 (V-N)triaz, 528 (V-O). MS (70 eV) m/z (%): 547.6 (M, 4.6), 461 (1.83), 360 (5.7), 312 (62), 156 (7), 104 (73), 78 (53), 52 (100). Anal. Calcd for C18H20N6SO9V (547.39): C: 39.5; H: 3.7; N: 15.35; SO4: 17.6 %. Found: C: 39.1; H: 3.1; N: 15.02; SO4: 17.8 % and µeff (2.7 BM). [V2O2(L1)(SO4)2(H2O)]・H2O (6): yield 51%; color brown powder; m.p. >300˚C. IR (KBr, cm−1): 3384(OH), 3071 (CH) aromatic, 1489 - 1216 (C-N+C-C), 1642 (C=N+C=N) coordinated, 1548 (C=N+C=N) uncoordinated, 777 (C-H) deformation, 441 (V-N)pyr, 485 (V-N)triaz, 606 (V-O). MS (70 eV) m/z (%): 672.35 (-2M, 3), 651 (4), 414 (5), 360 (4), 312 (97), 156 (5), 130 (6), 105 (100), 78 (32), 52 (28). Anal. Calcd. for C18H16N6S2O12V2 (674.36): C: 32.1; H: 2.4; N: 12.5; SO4: 28.5%. Found: C: 32.5; H: 2.8; N: 12.4; SO4: 29.3% and µeff (2.8 BM).
2.4. Biological Activity
2.4.1. In Vitro Anticancer Activity
The antitumor assays were performed utilizing the accompanying two cell lines: MCF-7 (Michigan Cancer Foundation-7) and Epitheliod carcinoma cervix cancer (Hela). The cell line of MCF-7 was acquired from the American Type Culture Collection (ATCC, Rockville, MD). The cells were developed onRPMI-1640 medium supplemented with 10% inactivated fetal calf serum and 50 mg/ml gentamycin. The cells were kept up at 37˚C in humidified atmosphere with 5% CO2 and were sub-refined a few times each week.
The antitumor activity was assessed on carcinoma cell lines at the Regional center for Mycology and Biotechnology at Al-Azhar University, Egypt. Quickly, the cell lines were developed as monolayers in growth medium supplemented with 10% inactivated fetal calf serum and 50 mg/ml gentamycin. The monolayers of 10.000 cells followed at the bottom of the wells in a 96-well microtiter plate (Falcon. NJ. USA) brooded for 24 h at 37˚C in a humidified incubator with 5% CO2. The monolayers were then washed with sterile phosphate buffered saline (0.01 M pH 7.2) and at the same time the cells were treated with 100 mL from various dilutions of tested compound in fresh maintenance medium and brooded at 37˚C. A control of untreated cells was made without the tried compound. Three wells were utilized for every concentration of the test sample. The observation under the inverted microscope was made each 24 h. The staining so as to survive quantity cells was controlled the cells with precious stone violet took after by cell lysing utilizing 33% glacial acetic acid and read the absorbance at 590 nm utilizing ELISA reader after well mixing. The absorbance values from untreated cells were considered as 100% expansion and the rate of feasibility was ascertained as [1-(ODt/ODc)] × 100% where ODt is the mean optical density of wells treated with the tried compounds and ODc is the mean optical density of untreated cells [16] - [18] .
The cell line of Epitheliod carcinoma cervix cancer (Hela) was gotten from ATCC via Holding company for biological products and vaccines (VACSERA), Cairo, Egypt. 5-fluorouracil was utilized as a standard anticancer drug for comparison. The cell line was utilized to focus the inhibitory impacts of compounds on cell development utilizing the MTT assay. The colorimetric assay is basically depending on the transformation of the yellow tetrazolium bromide (MTT) to a purple form azan derivative by mitochondrial succinate dehydrogenase in various cells. Hela cells were cultured in RPMI-1640 medium with 10% fetal bovine serum. Antibiotics added were 100 units/ml penicillin and 100 µg/ml streptomycin at 37˚C in a 5% CO2 incubator. The cell line was seeds in a 96-well plate at a density of 1.0 × 10⁴ cells/well at 37˚C for 48 h under 5% CO2. After brooding the cells were tested with different concentration of compounds and incubated for 24 h. After 24 h of drug treatment, 20 µl of MTT solution at 5 mg/ml was added and incubated for 4 h. DMSO in volume of 100 µL is added into each well to dissolve the purple formazan formed. The colorimetric assay is measured and recorded at absorbance of 570 nm utilizing a plate reader (EXL 800). The relative cell viability in percentage was computed as (A570 of treated samples/A570 of untreated sample) X 100 [16] [19] - [20] .
2.4.2. Antibacterial Activities
The in vitro assessment of antibacterial activity was researched against three bacterial strains, Gram-positive (Staphylococcus aureus), Gram-negative (Escherichia coli) bacterial and Candida Albicans. The bacterial species were developed in nutrient broth at 37˚C for 24 hrs [21] .
Chemical compounds were individually tried against a panel of Gram-positive (Staphylococcus aureus), Gram-negative (Escherichia coli) bacteria and Candida albicans. Every of the compounds was dissolved in DMSO and solution of the concentration 1 mg/ml were prepared separately paper discs of whatman filter paper were prepared with standard size (5 cm) were cut and sterilized in an autoclave. The paper discs soaked in the desired concentration of the complex solution were places aseptically in the Petri dishes containing nutrient agar media (peptone 5 g + agar 20 g + beef extract 3 g) seeded with Staphylococcus aureus, E. coli and Candida albicans. The Petri dishes were incubated at 36˚C and the inhibition zones were recorded after 24 hrs of incubation. Every treatment was replicated three times. The antibacterial activity of a common standard Antifungal Colitrimazole and antibiotic ampicillin was also recorded utilizing the same procedure as above at the same solvents and concentration.
2.5. Solution Studies
Stock solutions (1 × 10⁻² M) of L1 and VOSO4・3H2O were prepared by dissolving the calculated accurate weights of L1 and VOSO4・3H2O in absolute EtOH and dist. H2O, respectively then completed to the mark (50 ml). In continuous variation (CV) study, a series of 10 ml solutions was prepared by mixing solutions of V4+ and L1 solutions in different ratios keeping the total molar concentration constant as 6 × 10⁻³ M and the absorbance at 604 nm was recorded. For molar ratio method (MR), series of 10 ml solutions was prepared in which the V4+ ion concentration was kept constant at 2.5 × 10⁻³ M while that of L1 was regularly varied. The absorption spectra were recorded and the absorbance at 604 nm.
3. Results and Discussion
3.1. Physical Properties and Elemental Analyses
L1 coordinates to the V4+ ions in different styles like mononuclear (1:1), binuclear (2:1) and tri-nuclear (3:1) (M:L) in bidentate and tridentate manner. The metal complexes are non-hygroscopic (stable at room temperature) and are in the form of amorphous solids, except [VO(L1)SO4(H2O)3/2]・2.5H2O and [V2O2(L1)(SO4)2(H2O)]・H2O, but unfortunately crystals suitable for X-ray measurements were not available. Complex (2) is soluble in water and common organic solvents as DMF, DMSO and water. The structures of the complexes are established by elemental analyses and confirmed by weight loss determination. The values of molar conductivity of all complexes indicate that [V3O3(L1)(SO4)3(EtOH)1/2(H2O)3/2], [V2O2(L1)(SO4)2(EtOH)5/2], [V2O2(L1)(SO4)2(EtOH)3/2 (H2O)1/2], [VO(L1)SO4(H2O)3/2]・2.5H2O and [V2O2(L1)(SO4)2(H2O)]・H2O are non-electrolytic nature, while [VO (L1)(2,4-pentadionate)] Cl・4HCl has electrolytic nature [22] .
3.2. Infrared Spectra
The comparative IR spectra of the ligand and oxovanadium (IV) complexes indicate about the binding behavior of the ligand with metal ion. So, in comparing the IR of the L1 (Figure S1) with its complexes (Figure S2-S6), we find that the IR spectrum of the [V3O3(L1)(SO4)3(EtOH)1/2(H2O)3/2](Figure 1) shows four bands at 1550, 1575, 1601 and 1651 cm−1 which are shifted to lower wave numbers and are attributed to the coordinated ѵ(C=N + C=C) [23] [24] , which indicate that L1 coordinates as bidentate via all the active group in pyridine and triazine rings with three vanadium atoms. The square pyramidal geometry around V4+ is completed by water, EtOH and sulphate which have characteristics bands appeared in the spectrum. The spectrum also shows broad bands in the 3222 - 3447 cm−1 region together with a band at 1604 cm−1 region assigned to ѵ(OH) and ∂(OH) vibrations of H2O molecule, respectively. Existence of strong band at 976 cm−1 is strong evidence for the coordination of vanadium ion with L1 as it is characterized for V=O vibration in VO2+ [25] . In addition, new bands are observed at 424 and 452 cm−1 which are assigned to V-N bonds of pyridine and triazine, respectively, and at 515 and 592 cm−1 which are assigned to V-O bond [26] . Also, new bands at 424, 625, 978, 1033 cm−1 are assigned to coordinated  group and the position of these bands indicates the participation of the
  in a unidentatemanner as a result, the complex is nonelectrolyte.
The IR spectrum of the [VO(L1)(2,4-pentadionate)] Cl・4HCl (Figure S2) estimates bands, which are shifted to lower wave numbers and are observed at 1634 and 1576 cm−1 and are referred to the bands of the coordinated ѵ(C=N +C=C) for triazine and pyridine, respectively indicating the involvement of C=N in coordination to the metal ion [23] [24] as well as new bands at 424 and 442 cm−1 which are assigned to V-N bonds of pyridine and triazine, respectively, and a band at 550 cm−1 which is assigned to V-O vibration [26] .
IR spectrum of [V2O2(L1)(SO4)2(EtOH)5/2] (Figure S3) shows bands at 1603, 1575, 1562 and 1542 cm−1 are referred to the bands of the coordinated ѵ(C=N + C=C) [23] [24] , in addition, a broad band in the 3403 - 3445 cm−1 region together with a band at 1603 cm−1 region assigns to ѵ(OH) and ∂(OH) vibrations of coordinated EtOH molecules, respectively and coincides with the results of the thermal analyses which suggest that EtOH molecules reside inside the coordination sphere. Moreover, the band in the 3031 - 3078 cm−1 region is assigned to the aromatic ѵ(C-H) vibration of L1 in the complex. The bands observed in the 1478 - 1262 cm−1 region are assigned to (C-N+C-C) while the band at 767 cm−1 is assigned to the aromatic C-H deformation vibration. A vanadyl complex shows a band at 978 cm−1 which may be attributed to the ѵ(V=O) vibration of VO2+ [25] . New bands are

Figure 1. IR spectrum of the [V3O3(L1)(SO4)3(EtOH)1/2 (H2O)3/2] complex.
observed at 425, 445 (V-N)pyr, 474, 489 (V-N) triaz, 547, 577 (V-O) cm−1 [26] . Also, new bands are observed at 425, 629, 956 and 1032 cm−1 which are assigned to coordinated  group and the position of bands are assigned to that
  group bonded as unidentate ligand which is in agreement with the conductivity measurements.
IR spectrum of the [V2O2(L1)(SO4)2(EtOH)3/2(H2O)1/2] (Figure S4) shows bands at 1653 and 1588 cm−1 arecharacterized to coordinated ѵ(C=N+C=C) [23] [24] . Presence of H2O and EtOH is proved by existence ofa broad band in the 3305 - 3449 cm−1 region together with a band at 1610 cm−1 region assigned to ѵ(OH) and ∂(OH) vibrations of H2O molecule, respectively. Peaks revealing the presence of L1 in the complex centered at 3042 cm−1 (aromatic C-H stretching vibration). New bands are observed at 427 (V-N)py, 453 (V-N)triaz, 514 (V-O) cm−1 [26] . Additionally, thevanadyl complex shows a strong band at 984 cm−1 which may be attributed to the ѵ(V=O)vibration of VO2+ [25] . Also, the bands at 427, 653, 978, 1033 cm−1 are assigned to coordinated  group and the position of bands assigned to that
  group bonded as unidentate ligand.
The IR spectrum of [VO(L1)SO4(H2O)3/2]・2.5H2O (Figure S5) shows bands at 1642 and 1548 cm−1 are referred to the bands of the coordinated ѵ(C=N+C=C) and the uncoordinated (C=N+C=C) band, respectively [23] [24] . Appearance of a broad band in the 3387 cm−1 region together with a band at 1621 cm−1 region assigned to ѵ(OH) and ∂(OH) vibrations of H2O molecule, respectively, which suggest existence of H2O molecules inside and outside the coordination sphere. The H2O molecules inside the sphere is bonded with nitrogen atom by hydrogen bond so it proves the high shift of the band at 3387 cm−1 and the remain molecules are solvation outside the sphere. The results of thermal analyses confirmed this observation. New bands are observed at 434 and 486 cm−1 assigned to V-N bonds of pyridine and triazine, respectively. The band at 528 cm−1 assigned to V-O vibration [26] . The oxovanadium complex shows a strong band at 971 cm−1 attributed to the high π-band order of vanadium to oxygen link of VO2+ [25] . The bands are observed at 434, 613, 971, 1032 cm−1 are assigned to the coordinated  group and the position of bands assigned to that
  group bonded inunidentatemanner. The conductivity measurements supported this observation where the complex is nonelectrolyte.
The IR spectrum of [V2O2(L1)(SO4)2(H2O)]・H2O (Figure S6) shows two bands at 1642 and 1548 cm−1 assigned to the coordinated (C=N+C=C) [23] [24] . Also, it shows a broad band at 3384 cm−1 together with a band at 1619 cm−1 assigned to ѵ(OH) and ∂(OH) vibrations of H2O molecule, respectively which present inside and outside the coordination sphere. Moreover, the band at 3071 cm−1 is assigned to the aromatic ѵ(C-H) vibrations of L1. The bands observed in the 1489 - 1216 cm−1 region are assigned to (C-N+C-C) while the band at 777 cm−1 region is attributed to the aromatic C-H deformation vibrations. New bands are observed at 441 and 485 cm−1 which, are assigned to V-N bonds of pyridine and triazine, respectively, and at 606 cm−1 which, is assigned to V-O bond [26] . Appearance of strong band at 976 cm−1 is characterized for V=O vibration in VO2+ [25] . New bands appear at 441, 606, 971, 1033 cm−1 are assigned to coordinated  group and the position of bands assigned to that
  group bonded as unidentate ligand and it matches with the conductivity measurement as the complex is nonelectrolyte.
3.3. Mass Spectra
Mass spectra of the complexes have molecular ion peaks that are in agreement with their formulae. As we observed in all the complexes, there are two pathways. Depending on the thermodynamic basics, the pathway must be till the thermodynamically butadiene radical [27] .
The mass spectrum of [V3O3(L1)(SO4)3(EtOH)1/2(H2O)3/2], shows a fragmentation pattern corresponding to the successive degradation of the complex, shows the molecular ion peak [m/z] at 852.3 with abundance 1.47% and coincides with the theoretical value (851.4) as shown in Figure 2. This suggests that the proposed structure for the complex is correct and has the chemical formula; C19H18N6S3O17V3. The fragmentation pattern of the V4+ complex (1:3) is shown in Scheme 1. The mass spectrum of [VO(L1)(2,4-pentadionate)] Cl・4HCl, shows the molecular ion peak [m/z] at 659.2 with abundance 1.16% and coincides with the theoretical value (659.7) as shown in (Figure S7). The fragmentation pattern of the complex is shown in (Figure S8). This suggests that the proposed structure for the complex is correct and has the chemical formula, C23H22N6O3Cl5V. The mass spectrum of [V2O2(L1)(SO4)2(EtOH)5/2], shows the molecular ion peak [m/z] at 753.6 with abundance 8.6% and coincides with the theoretical value (753.501) as shown in (Figure S9). The fragmentation pattern of the complex is shown in (Figure S10). This suggests that the proposed structure for the complex is correct and has the chemical formula, C23H27N6O25/2S2V2. The mass spectrum of [V2O2(L1)(SO4)2(EtOH)3/2(H2O)1/2], shows the molecular ion peak [m/z] at 714 with abundance 7.9% and coincides with the theoretical value (716.44) as
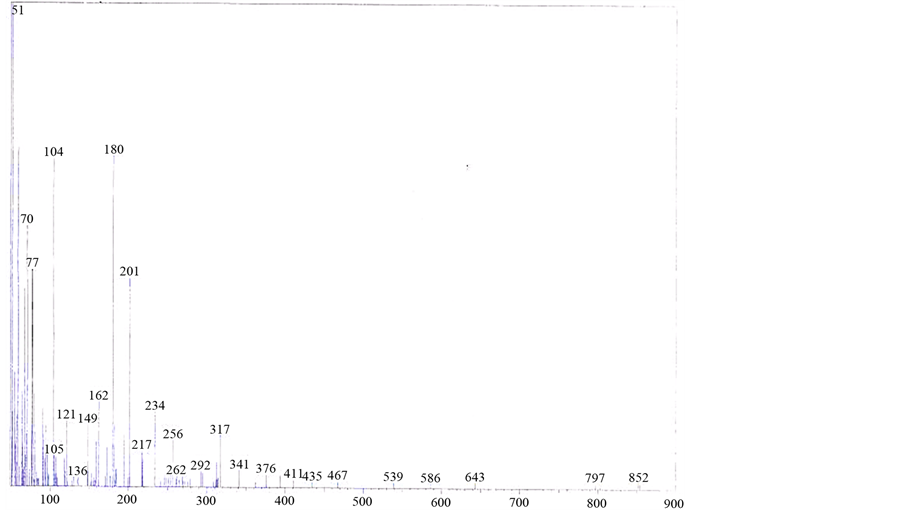
Figure 2. Mass spectrum of [V3O3(L1)(SO4)3(EtOH)1/2(H2O)3/2] complex.

Scheme 1. Fragmentation pattern of [V3O3(L1)(SO4)3(EtOH)1/2(H2O)3/2] complex.
shown in (Figure S11). The fragmentation pattern of the complex is shown in (Figure S12). This suggests that the proposed structure for the complex is correct and has the chemical formula, C21H22N6O12S2V2. The mass spectrum of the V4+ complex (1:1), [VO(L1)SO4(H2O)3/2]・2.5H2O, at 120˚C shows the molecular ion peak [m/z] at 547.6 and coincides with the theoretical value (547.39) as shown in (Figure S13). This suggests that the proposed structure for the complex is correct and has the chemical formula; C18H20N6SO9V. The fragmentation pattern of the V4+ complex (1:1) is shown in (Figure S14). The mass spectrum of the V4+ complex (1:2), [V2O2(L1) (SO4)2(H2O)]・H2O, shows the molecular ion peak [m/z] at 672.35 and coincides with the theoretical value (674.36) as shown in (Figure S15). The fragmentation pattern of the V4+ complex (1:2) is shown in (Figure S16). This suggests that the proposed structure for the complex is correct and has the chemical formula, C18H16N6S2O12V2. Also, the results of elemental analyses and thermal analyses are taken as evidences for the proposed structures.
3.4. Thermal Analysis
The steps of decomposition, temperature extent and decomposition products and also the weight loss percentages of V4+ complexes are reported in Table 1. Figure 3 and (Figure S17-S20) show the TGA/DTG curves of the five metal complexes. The experimental weight loss values are in good agreement with the calculated values. In the TGA curve of the [V3O3(L1)(SO4)3(EtOH)1/2(H2O)3/2] (3:1; M:L) (Figure 3) shows four decomposition stages. The first stage was in 27˚C - 263˚C range with a loss corresponding to 1.5 coordinate H2O molecules and 1.5 EtOH molecule and N2 fragment (Found: 9.2%; Calcd.: 9.3%). The second step lies in the range 263˚C - 329˚C corresponds to the loss of NO2 and 2H2 fragment (Found: 5.9%; Calcd.: 6.0%). The third step corresponds to

Table 1. Decomposition steps with the temperature range and weight loss for V4+ complexes.

Figure 3. The TGA curve of the [V3O3(L1)(SO4)3(EtOH)1/2 (H2O)3/2].
2SO4 and C3H3 and CO fragments are (Found: 30.4%; Calcd.: 30.0%) in range 329˚C - 449˚C. The fourth step attributes (Found: 24.7%; Calcd.: (24.7%) refers to SO4 and C9H5 fragment. The residual part (Found: 30.0%; Calcd.: 30.0%) refers to V3N3C5. Secondly, the TGA curve of [VO(L1)(2,4-pentadionate)]Cl・4HCl (Figure S17) shows the first step in 27˚C - 211˚C range with a loss corresponding to 2HCl fragment (Found: 11.1%; Calcd.: 11.4%). The second step lies in the range 211˚C - 398˚C corresponds to the loss of Cl, 2HCl, 2N2, O2 and CO fragments (Found: 34.01%; Calcd.: 33.9%). The mass loss corresponds to the main skeleton of complex C17H9N are (Found: 34.5%; Calcd.: 34.7%) in the 398˚C - 563˚C range. The residual part (Found: 20.5%; Calcd.: 20.0%) refers to C5H10VN fragment. Also, the TGA of [V2O2(L1)(SO4)2(EtOH)5/2] (Figure S18) shows the first step in 28˚C - 207˚C range with a loss corresponding to 1/2 EtOH and carbon fragment (Found: 4.7%; Calcd.: 4.8%). The second step lies in the range 208˚C - 343˚C corresponds to the loss of 2EtOH, O2, N2 and C2H4 fragments (Found: 23.9%; Calcd.: 23.9%). The third step lies in the range 343˚C - 422˚C corresponds to the loss of SO4 and CH4 fragments (Found: 14.9%; Calcd.: 14.8%). The fourth step corresponds to loss of SO4, N2 and 2H2 (Found: 17%; Calcd.: 17.3%) in the 422˚C - 565˚C range. The residual part (Found: 39.6%; Calcd.: 39.2%) refers to C14V2N2 fragment. Additionally The TGA curve of [VO(L1)(SO4)(H2O)3/2]・2.5H2O (1:1; M:L) (Figure S19) shows three stages of decomposition within the temperature range 18˚C - 1000˚C. The first stage in 18˚C - 216˚C range corresponded to the loss of 2.5 lattice water molecules (Found: 8.5%; Calcd.: 8.23%). The second step lies in the range 216˚C - 443˚C corresponds to the loss of 1.5 coordinated water molecules (hydrogen bond), SO4 group and C5H5 fragment (Found: 34.5%; Calcd.: 34.4%). In the third stage, the mass loss attributes to C9H5N5O are (Found: 35.9%; Calcd.: 36.4%) in range 443˚C - 574˚C. The residual part (Found: 20.8%; Calcd.: 21%) refers to VN and C4H2 fragment. Finally, the TGA curve of [V2O2(L1)(SO4)2(H2O)]・H2O (2:1; M:L) (Figure S20) shows four stages of decomposition within the temperature range 25˚C - 1000˚C. The first and second steps in 19˚C - 395˚C range correspond to one lattice H2O molecule, one coordinated H2O molecule and coordinated SO4 group (Found: 20.9%; Calcd.: 19.6%). The third step lies in the range 395˚C - 448˚C corresponds to the loss of other coordinated SO4 group and CH fragment (Found: 15.8%; Calcd.: 16.2%). The mass loss corresponds to the main skeleton of complex C14H5N4O2 are (Found: 38.2%; Calcd.: 38.7%) in the 448˚C - 525˚C range. The residual part (Found: 25.1%; Calcd.: 25.5%) refers to V2N2 and C3H6 fragments.
3.5. Electron Spin Resonance
The ESR spectra of the researched complexes show just an intense and broad signal without hyperfine splitting. The nonappearance of vanadium hyperfine coupling is regular in solid state [28] and is credited to the simultaneous flipping of neighbouring electron spins [29] [30] or because of strong exchange interactions, which average out the collaboration with the nuclei. The solid ESR spectra of V(IV) complexes, [V3O3(L1)(SO4)3(EtOH)1/2 (H2O)3/2], [VO(L1)(2,4-pentadionate)] Cl・4HCl and [VO(L1)SO4(H2O)3/2]・2.5H2O, are shown in Figure 4 and (Figure S21-S22), respectively,. The shape of the spectra is predictable with square-pyramidal environment around V(IV) ion and the lower g value for the investigated complexes, when contrasted with that of free electron
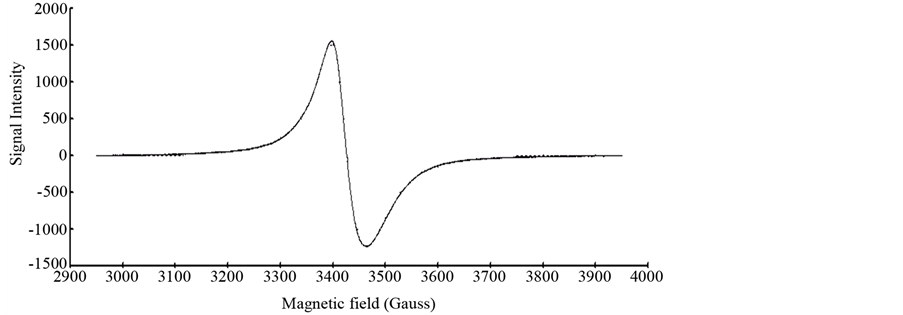
Figure 4. X-band ESR spectrum of [V3O3(L1)(SO4)3(EtOH)1/2(H2O)3/2].
(g = 2.0023) uncovering a considerable covalency of metal ligand bonding with dx2-y2 as the ground-statenormal for square pyramidal stereochemistry as appeared in Table 2. The decrease of the g value than that of the free-electron value (2.0023) is an estimated measure of the ligand field strength; the stronger the ligand field the littler the reduction in the g value and the other way around. The |g|, g┴ and |A| values are measured from the spectra, which are in good agreement for a square-pyramidal structure. The high value of α2 for the [VO(L1)(2,4-pentadionate)] Cl・4HCl (0.621) suggests the ionic nature of this complex. On the other hand the low values of α2 for [V3O3(L1) (SO4)3(EtOH)1/2・(H2O)3/2] (0.2499) and [VO(L1)SO4(H2O)3/2]・2.5H2O (0.2079) indicate the covalent nature of these complexes.
3.6. Stoichiometry of the Metal Complexes
The stoichiometry of V4+-L1 complex was resolved utilizing continuous variation (CV) and molar ratio methods (MR). In continuous variation method the absorbance of the prepared solutions of V4+ and L1 with total molar concentration constant 6 × 10⁻³ M and at 604 nm were recorded. The plot of absorbance as a function of the mole fraction of L1 estimated that the complex has a maximum absorbance at 0.5 mol fraction providing evidence for 1:1 (M:L) complex (Figure 5). In molar ratio method, the absorbance of prepared solutions with constant metal ion concentration was recorded at 604 nm and plotted versus the molar ratio [L]/[M] (Figure 6). The curve consists of two linear portions crossing at 1:1 M:L species. The stability constant of the formed complex was computed from only one method (CV) by evaluating the degree of complex formation was determined by applying the accompanying formula [31] [32] :

where A, Am, n and C are the absorbance of the partially formed complex, the fully formed complex, stoichiometry ratio and concentration of metal utilized, respectively. The Kf, Log β and ∆G˚ values obtained from the continuous variation method are 1492.11, −3.17 and −18105.96, respectively.
3.7. Electronic and Magnetic Measurements
The electronic spectra of the complexes were recorded in Nujol mull and DMSO. The electronic spectrum of [VO(L1)SO4(H2O)3/2]・2.5H2O (Figure 7) shows six bands. The first three bands at 32,679, 25,773 and 22,935 cm−1 are attributed to charge-transfer of the type L → M. The last three bands at 16,611, 19,230 and 20,576 cm−1 are assigned to d-d transition 2B2 (dxy → dxz, dyz) → 2E, 2B2 (dxy → dx2-y2) → 2B1 and 2B2 (dxy → dz2) → 2A1 transitions, respectively [33] . The data of IR spectra gathering with electronic spectra suggest a square-pyramidal geometry around the V4+ ion [34] . But, the value of the magnetic moment of the complex is 2.7 B.M which is higher than the proposed for d1-system; recommending an orbital contribution [35] .
The electronic spectrum of [V2O2(L1)(SO4)2(H2O)]・H2O (Figure S23) estimates three bands at 166,666, 19,157 and 23,809 cm−1 assigned to d-d transition 2B2 (dxy → dxz, dyz) → 2E, 2B2 (dxy → dx2-y2) → 2B1 and 2B2

Figure 5. Continuous variation method of V4+-L1.

Figure 6. Molar ratio method of V4+-L1.

Figure 7. Electronic spectrum of [VO(L1)SO4(H2O)3/2]・2.5H2O.
Table 2. Magnetic measurements of V(IV) complexes.
(dxy → dz2) → 2A1 transitions, respectively [33] , in a square-pyramidal geometry around the V4+ ion [34] . Also, the bands at 34,965, 31,847 and 25,641 cm−1 are attributed to charge-transfer of the type L → M. Moreover, the value of the corrected magnetic moment (µeff = 2.8 BM) is evaluated per each V4+ ion [36] . The electronic spectrum of [V3O3(L1)(SO4)3(EtOH)1/2(H2O)3/2] Figure S24) reveals five bands at 35,971, 33,333, 24,509, 17,361 and 12,987 cm−1. The first two bands are attributed to charge-transfer of the type L → M while the last three bands are assigned to d-d transitions of a square-pyramidal geometry around the V4+ ion [33] . The trinuclear complex shows subnormal magnetic susceptibility value (µeff = 2.8 B.M) at room temperature. It might be ascribed to that the unpaired electron in the dxy orbital of the adjacent vanadium atoms, so this interaction prompts subnormal magnetic moment at room temperature [37] . The electronic spectrum of [VO(L1)(2,4-pentadionate)] Cl・4HCl complex (Figure S25) reveals two bands at 32,258, 29,240 cm−1 are characterized for charge-transfer of the type L → M. Also, three bands at 12,594, 14,535 and 20,747 cm−1 are for 2B2 (dxy → dxz, dyz) → 2E, 2B2 (dxy → dx2-y2) → 2B1 and 2B2 (dxy → dz2) → 2A1 transitions respectively, in a square-pyramidal geometry around the V4+ ion [33] . The electronic spectrum of [V2O2(L1)(SO4)2(EtOH)5/2] complex (Figure S26) shows five bands. The bands at 36,232 and 33,557 cm−1 are attributed to charge-transfer of the type L → M, in addition tothe bands at 12,500, 16,891 and 27,624 cm−1 are assigned to d-d transition 2B2 (dxy → dxz, dyz) → 2E, 2B2 (dxy → dx2-y2) → 2B1 and 2B2 (dxy → dz2) → 2A1 transitions respectively, in a square-pyramidal geometry around the V4+ ion [33] . Moreover, the value of the corrected magnetic moment (µeff = 3.01 BM) per each V4+ ion is taken an evidence for existence of two vanadium atoms [36] .
3.8. Computational Studies
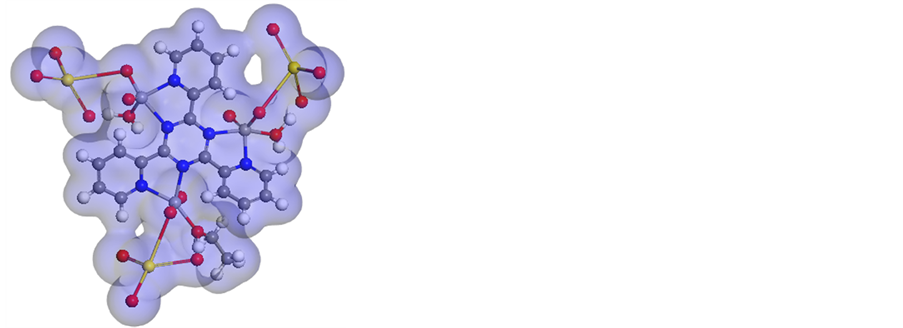
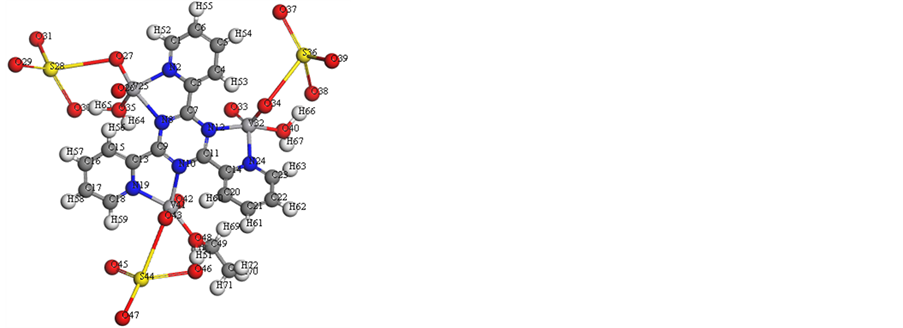
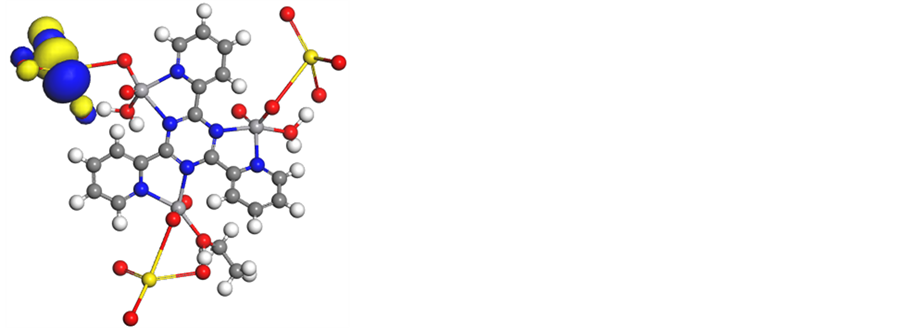
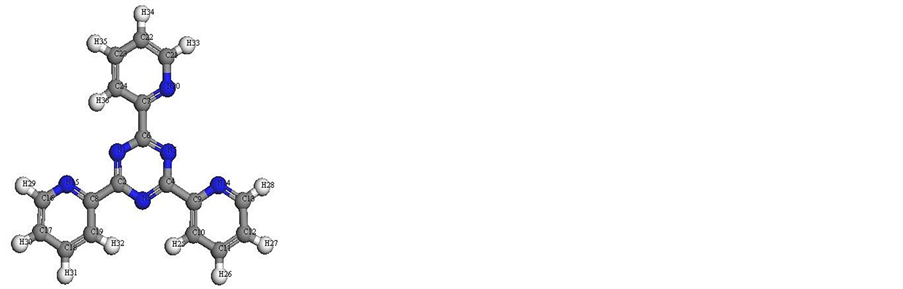
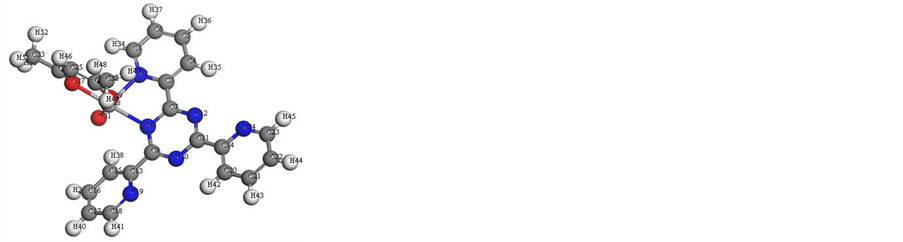
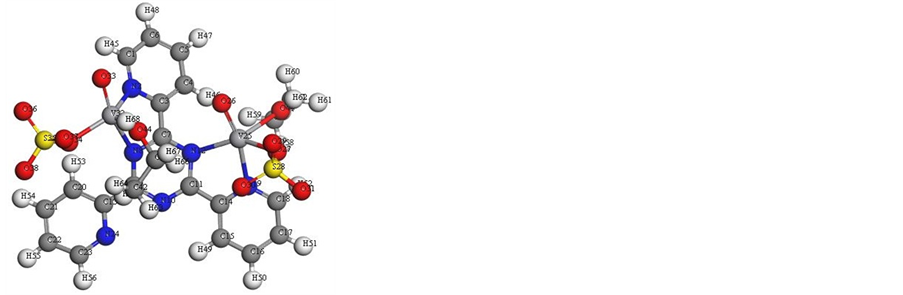
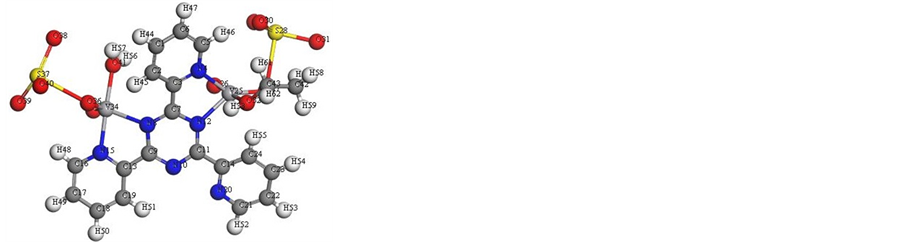
We performed cluster calculations utilizing DMOL3 program [38] in Materials Studio package [39] , which is intended for the realization of vast scale density functional theory (DFT) calculations. DFT semi-core pseudopods (dspp) calculations were performed with the twofold numerical basis in addition to plus polarization functional (DNP). The DNP basis sets are of comparable quality to 6-31G Gaussian basis sets [40] . The molecular structure alongside atom numbering of the ligand metal complexes is appeared in Figure 8 and (Figure S27-S32). Analysis of the data (Tables S1-S12) involving the bond lengths and bond angles proposes the accompanying remarks.
Vanadium complexes have a square-pyramidal structure. All the active groups participating in coordination where have bonds longer than that as of now exist in the ligand (like C=N) because of M-N bond formation which makes the C-N and C=N bond weaker likewise, The bond angles in the complexes are very close to a square-pyramidal geometry. In the event of
1) [V3O3(L1)(SO4)3(EtOH)1/2(H2O)3/2] complex (Figure 8), L1 acts as a bidentate style coordinating via N(8)triaz, N(10)triaz, N(12)triaz, N(12)py, N(19)py, N(24)triaz atoms. The SO4 groups, EtOH and H2O molecules finish the square-pyramidal structure around the three vanadium atoms. There is an expansive variety in C(11)-N(12)triaz, N(10)triaz-C(11), C(9)-N(10)triaz, N(8)triaz-C(9), N(12)triaz-C(7) and C(7)-N(8)triaz, N(2) py-C(3), N(24)py-C(14) and N(19)py-C(13)bond lengths. The bond angles of the L1 moiety are modified upon coordination; the biggest change influences C(23)-N(24)py-C(14), C(18)-N(19)py-C(13), C(11)-N(12)triaz-C(7), N(12)triaz-C(11)-N(10)triaz, C(11)-N(10)triaz-C(9), N(10)triaz-C(9)-N(8)triaz, C(9)-N(8)triaz-C(7), N(12)py- C(7)-N(8)triaz and C(3)-N(2)py-C(1) which are lessened or expanded on complex formation as a result of bonding.
2) In[VO(L1)(2,4-pentadionate)]Cl・4HCl complex (Figure S28), L1 serves in a bidentate manner coordinating by means of N(8)triaz and N(2)py atoms. There is a vast variety in N(8)triaz-C(9), C(7)-N(8)triaz, C(3)-C(7), N(2) py-C(3) and C(1)-N(2)py bond lengths. The bond angles of L1 moiety are modified to some degree upon coordination; the biggest change impacts C(7)-C(3)-N(2)py, C(3)-N(2)py-C(1), N(8)triaz-C(7)-C(3), and C(9)-N(8) triaz-C(7) which are diminished or expanded on complex development as an outcome of bonding.
3) Also, [V2O2(L1)(SO4)2(EtOH)5/2] (Figure S29), L1 is a bi-dentate ligand coordinating via N(8)triaz, N(12)triaz, N(2)py and N(19)py atoms. There is a vast variety in C(18)-N(19)py, N(19)py-C(14), C(11)-C(14), C(11)-N(12)triaz, N(8)triaz-C(9), C(7)-N(8)triaz, C(3)-C(7), N(2)py-C(3), C(1)-N(2)py and N(12)triaz-C(7) bond lengths. The bond angles of the TPTZ moiety are modified to some degree upon coordination; the biggest change influences C(18)-N(19)py-C(14), C(11)-N(12)triaz-C(7), C(14)-C(11)-N(12)triaz, N(12)triaz-C(11)- N(10)triaz, C(9)-N(8)triaz-C(7), C(7)-C(3)-N(2)py, C(3)-N(2)py-C(1) and N(8)triaz-C(7)-C(3)which are lessened or expanded on complex arrangement as a result of holding.
4) L1 in [V2O2(L1)(SO4)2(EtOH)3/2(H2O)1/2] (Figure S30), serves in a bidentate manner coordinating by means of N(8) triaz, N(12)triaz, N(4)py and N(15)py atoms. There is an expansive variety in C(13)-N(15)py, C(9)-C(13), N(8) triaz-C(9), C(7)-N(8)triaz, N(4)py-C(5), C(3)-C(7) and C(3)-N(4)py bond lengths. The bond angles of L1 moiety are modified to some degree upon coordination; the biggest change impacts N(15)py-C(13)-C(9), C(5)- N(4)py-C(3), C(7)-C(3)-N(4)py, C(9)-N(8)triaz-C(7), N(12)triaz-C(7)-C(3) and C(13)-C(9)-N(8)triaz which are lessened or expanded on complex formation as a result of bonding.
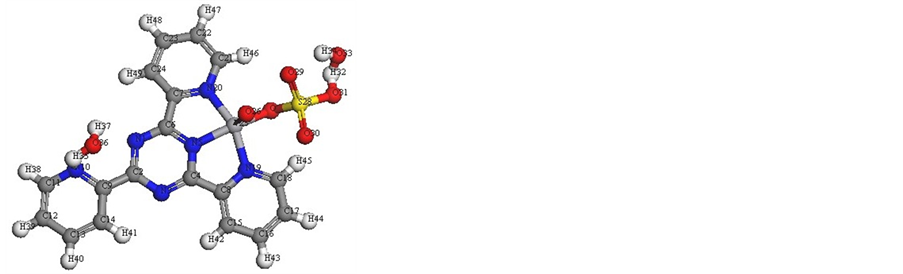
5) L1 in [VO(L1)SO4(H2O)3/2]・2.5H2O (Figure S31), acts as a tridentate style coordinating by mean of N(5)triaz, N(19)py and N(20)py atoms. The ions O(26) in axial positions and O(27) finish the square-pyramidal structure. There is a vast varietyin C(18)-N(19)py, C(21)-C(22), N(20)py-C(21), N(19)py-C(8), C(6)-C(7), N(5)triaz-C(6), C(4)-C(8), C(7)-N(20)py and C(4)-N(5)triaz bond lengths. The bond angles of the L1 moiety are modified to some degree upon coordination; the biggest change influences C(21)-N(20)py-C(7), C(18)-N(19)py-C(8), N(19)py-C(8)-C(4), N(20)py-C(7)-C(6), C(7)-C(6)-N(5)triaz, C(6)-N(5)triaz-C(4) and C(8)-C(4)-N(5)triaz which are lessened or expanded on complex formation as a result of bonding.
6) [V2O2(L1)(SO4)2(H2O)]・H2O (Figure S32) has a square-pyramidal structure. L1 acts as a tridentate manner coordinating via N(5) triaz, N(10)py and N(19)py atoms, also coordinates as a bidentate style coordinating via N(1) triaz and N(20)py atoms. In case of the tridentate fashion the atoms O(31) and O(26) finish the square-py- ramidal structure and dwell, while in case of a bidentate fashion the atoms O(33), O(35) of sulphate group and O(34) of water molecule finish the square-pyramidal structure. There is a vast varietyin N(20)py-C(21), C(18)- N(19)py, N(10)py-C(11), C(9)-N(20)py, N(19)py-C(8), C(7)-N(10)py, C(6)-C(7), N(5)triaz-C(6), C(4)-C(8), C(4)-N(5) triaz, C(2)-C(9), C(6)-N(1)triaz and N(1)triaz-C(2) bond lengths. The bond angles in [V2O2(TPTZ) (SO4)2 (H2O)]・H2O complex are very close tosquare-pyramidal geometry where the bond angles of atoms around the V4+ atoms in the square-pyramidal structure are N(20)py-V(32)-N(1)triaz, N(19)py-V(25)-N(10)py, N(19)py-V(25)-N(5)triaz, N(10)py-V(25)-N(5)triaz, C(21)-N(20)py-C(9), C(18)-N(19)py-C(8), C(11)-N(10) py-C(7), N(20)py-C(9)-C(2), N(19)py-C(8)-C(4), N(10)py-C(7)-C(6), C(7)-C(6)-N(5)triaz, C(6)-N(5)triaz-C(4), C(8)- C(4)-N(5)triaz, C(9)-C(2)-N(1)triaz and C(6)-N(1)triaz-C(2). The bond angles of the TPTZ moiety are modified somewhat upon coordination; the largest change influences C(11)-N(10)py-C(7), C(6)-N(5)triaz-C(4), C(8)-C(4)-N(5)triaz, C(9)-C(2)-N(1)triaz, N(20)py-C(9)-C(2), which are decreased or increased on complex formation as a result of bonding.
3.8.1. Chemical Reactivity
Global Reactivity Descriptors
The determination of energies of the HOMO (π-donor) and LUMO (π-acceptor) are essential parameters in quantum chemical computations. The HOMO is the orbital that fundamentally goes about as an electron donor and the LUMO is the orbital that largely to a great extent go about as the electron acceptor. These molecular orbitals are additionally called the frontier molecular orbitals (FMOs).
i) The EHOMO and ELUMO and their neighboring orbitals are all negative (Table 3), which appear that the investigated molecules are steady [41] .
Table 3. Calculated EHOMO, ELUMO, energy band gap (EH-EL), chemical potential (μ), electronegativity (χ), global hardness (η), global softness (S) and global electrophilicity index (ω) for L1 and its complexes.
H = HOMO, L = LUMO.
ii) The FMOs theory predicts positions of coordination (electrophilic attack) on aromatic compounds. An introductory assumption is that the reaction happens with most extreme overlap between the HOMO on one molecule and the LUMO on the other. The overlap between the HOMO and the LUMO is a governing factor in many reactions. The aim of the calculations is the scanning for the biggest estimations of molecular orbital coefficients. In this way, orbitals of L1 with the biggest estimation of molecular orbital coefficients may be considered as the locales of coordination. This conclusion is affirmed by the data acquired from the calculations which can demonstrate that the nitrogen of the CN group has the largest values of molecular orbital coefficients.
iii) Gutmann’s variation rules, “the bond strength increases as the adjacent bonds become weaker” such as found by Linert et al. [42] . This elucidation concurs well with the resultant as the increment of the EHOMO is joined by a shortcoming (lengthening) of the metal-ligand bonds, which prompts a reinforcing (shortness) of the destinations nearby the metal ligand centers.
iv) The HOMO level is for the most part confined on the Natom (Figure 8 and Figure S27-S31) indicating that this atom is the favored nucleophile positions at the central metal ion. This implies that these moieties, with high coefficients of HOMO density, are oriented toward the metal ions.
v) The energy gap (EHOMO-ELUMO) is a critical stability index serves to investigate the chemical reactivity and kinetic stability of the molecule [43] . The gap (EHOMO-ELUMO) is applied to improve a theoretical model for clarifying the structure and conformation barriers in many molecular systems, which impacts the biological activity of the molecule. A molecule with a little gap is more polarized and is called soft molecule. Soft molecules are more reactive than hard ones due to their easily offer electrons to an acceptor. The energy gap is little in L1 estimating that charge-transfer easily happen in it, which impacts the biological activity of the molecule. Low value of energy gap is additionally referred to the groups that go into conjugation [44] .
 (a) (b)
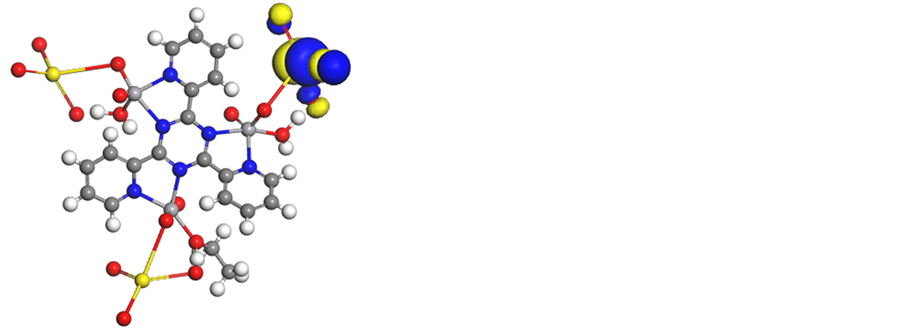
 (c) (d)
Figure 8. Molecular modeling of (a)[V3O3(L1)(SO4)3(EtOH)1/2(H2O)3/2], (b) electron den- sity, (c) HOMO and (d) LUMO.
vi) The lower HOMO energy estimations demonstrate that molecules donating electron ability is the weaker. On opposite, the higher HOMO energy suggests that the molecule is a good electron donor. LUMO energy displays s the ability of a molecule receiving electron [43] .
DFT method concept can suggest the chemical reactivity and position selectivity of the molecular systems. The energies of frontier molecular orbitals (EHOMO + ELUMO), energy band gap (EHOMO-ELUMO) which shows the eventual charge-transfer interaction within the molecule, electronegativity (χ), chemical potential (µ), global hardness (η), global softness (S) and global electrophilicity index (ω) [45] - [46] are appeared in Table 3.
 (1)
(1)
 (2)
(2)
 (3)
(3)
 (4)
(4)
 (5)
(5)
The inverse value of the global hardness is designed as the softness σ as follow:
 (6)
(6)
Electrophilicity index is one of the most vital quantum chemical descriptors in explaining toxicity of different pollutants in terms of their reactivity and position selectivity [47] . Also, the electrophilicity properly quantifies the biological activity of drug receptor collaboration. This novel reactivity index calculates the stabilization in energy when the system acquires an extra electronic charge from the environment. So, the importance of η and σ is to calculate the molecular stability and reactivity. In a complex formation system, L1 serves as a Lewis base while the V4+ acts as a Lewis acid.
3.8.2. Molecular Electrostatic Potential (MEP)
The MEP is a plot of electrostatic potential mapped onto the steady electron density surface. It is additionally exceptionally helpful in exploration of molecular structure with its physiochemical property relationship and also hydrogen bonding interactions [48] - [50] . The electrostatic potential V(r) at a given point r (x, y, z) is the interaction energy between the electrical charge produced from the molecule electrons, nuclei and proton located at r [51] [52] . In the present study, 3D plots of molecular electrostatic potential (MEP) of L1 (Figure 9) have been drew. The maximum negative, region which favored local for electrophilic attack, is shown by a red color, the maximum positive region which favored position for nucleophilic attack indicated as blue color. Potential

Figure 9. MEP plot by using DFT method forL1.
increases in the order red < green < blue, where blue represents the strongest attraction and red reveals the strongest repulsion. Regions having the negative potential are over the electronegative atoms while the regions having the positive potential are over the hydrogen atoms.
3.8.3. Dipole Moment and other Molecular Properties
The calculations of the binding energy uncovered that the increment of the value of the calculated binding energy of V4+ complexes contrasted with L1 indicates that the formed V4+ complexes are more stable than L1. Also, energy components were evaluated by DFT method listed in Table 4.
3.9. Biological Activity
3.9.1. Antibacterial Activity
Depending on data obtained for diameter of inhibition zone (Figure 10 and Table 5), it was found that the complexes were active on both sorts of bacterial strains. A look of data shows that:
i) [V3O3(L1)(SO4)3(EtOH)1/2(H2O)3/2], [VO(L1)(2,4-pentadionate)] Cl・4HCl,[V2O2(L1)(SO4)2(EtOH)3/2(H2O)1/2] and [V2O2(L1)(SO4)2(H2O)]・H2O complexes exhibited aexceptional antibacterial activity against all organisms.
ii) [VO(L1)(2,4-pentadionate)] Cl・4HCl revealed a potent antibacterial activity against Escherichia coli and Candida albicans bacterial strain (Gram-ve) more than [V3O3(L1)(SO4)3(EtOH)1/2(H2O)3/2] then [V2O2(L1) (SO4)2(H2O)]・H2O and [V2O2(L1)(SO4)2(EtOH)3/2(H2O)1/2].
iii) [V3O3(L1)(SO4)3(EtOH)1/2(H2O)3/2] had a potent antibacterial activity against Staphylococcus aureus bacterial strain (Gram + ve) more than [VO(L1)(2,4-pentadionate)] Cl・4HCl and [V2O2(L1)(SO4)2(EtOH)3/2(H2O)1/2] and [V2O2(L1)(SO4)2(H2O)]・H2O have the lower and equal an anti-bacterial activity.
The outcomes can be can be ascribed either to the failure of the complexes to diffuse through the cell wall of
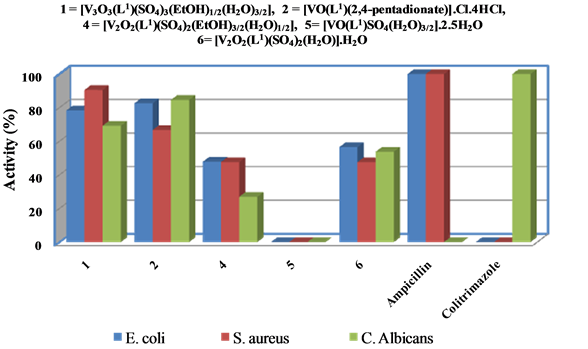
Figure 10. Antimicrobial activity of V4+-complexes.
Table 4. Some of energetic properties of L1 and complexes calculated by DMOL3 using DFT-method.
Table 5. Antimicrobial activities of the isolated complexes.
the bacterium and henceforth not able to meddle with its biological activity or they can diffuse and inactivated by unknown cellular mechanism i.e. bacterial enzymes. The reason for high antimicrobial activity of vanadium complexes can be clarified regarding the impact of vanadium metal ion on the normal cell process. The complexation reaction decreases the polarity of the metal ion by the partial participating of metal ion positive charge with donor groups and electron delocalization over the chelate ring. Hence, the lipophilic character of the central metal atom is improved which brings about a higher capacity to penetrate the microorganisms through the lipid layer of the cell membrane. In addition, all metal complexes under the investigation estimate a large value of binding energy than L1 that enhances the steadiness of these complexes [53] . Additionally, electrophilicity of all complexes is bigger than that of L1 and that could be another target behind some complexes to exhibit the biggest strong antimicrobial activity than the ligand. Likewise, it is observed from these studies that the vast majority of the metal chelates have a higher movement than the free ligand and that can be explained on the premise of chelation hypothesis. The chelation goes about as all the more able and strong fungicidal and bactericidal agents, subsequently murdering more fungi and bacteria than the ligand. In the complex the positive charge of the metal is somewhat imparted to the donor atoms present in the ligands, and there may be π-electron delocalization over the all chelating system [54] . The variety in the activity of different complexes against various microorganisms depend either on cells impermeability of the microbes or contrasts in ribosomes in microbial cells [55] . The negative results can be credited either to the powerlessness of the complexes to diffuse through the cell wall of the bacterium and henceforth not able to interfere with its biological activity or they can diffuse and inactivated by obscure cellular mechanism i.e. bacterial enzymes.
3.9.2. In Vitro Anticancer Activity
In vitro cytotoxicity tests were conducted utilizing all the prepared compounds against human tumor cell lines MCF-7 and Hela normal cell line by means of a colorimetric assay (MTT assay) that is a measurement for mitochondrial dehydrogenase activity as an indication of cell viability. The activities corresponding to viability of cancer cell growth. In parallel, the impact of widely utilized anticancer drug, 5-fluorouracil has been also assayed as standard. The IC50 values were computed from the graph plotted between % cell viability and concentration. The outcomes of IC50 of five complexes for both cell lines covered a large range of activity with ranging from 5.7 to 50.4 µg/ml as appeared in Figure 11, indicating that the five complexes exhibited antitumor activity against the cell lines without damaging the normal cells. [VO(L1)SO4(H2O)3/2]・2.5H2O and [VO(L1)(2,4-penta- dionate)] Cl・4HCl complexes revealed potential activity than [V3O3(L1)(SO4)3(EtOH)1/2(H2O)3/2] complex than [V2O2(L1)(SO4)2(H2O)]・H2O then [V2O2(L1)(SO4)2(EtOH)3/2(H2O)1/2], respectively. It means that the chemical structure of compounds is important to explain the complex biological activity and it can be essential in designing and synthesizing novel anticancer drugs. There is obviously direct correlation between strong interaction of V(IV) complex with DNA and antiproliferative activity of V(IV) complex. These observations suggests that DNA may be the targeting molecules of V(IV) complex’s anti-carcinogenic action, and V(IV) ion coordination and bind significantly enhances the Schiff base drugs anticancer activity. So, It is unmistakably watched that complexation with metal has a synergistic impact on the cytotoxicity.
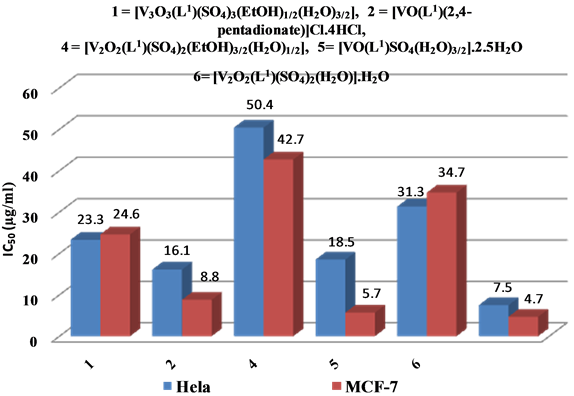
Figure 11. Scavenging capacities (IC50) of V4+ complexes (5-fluorouracil- standardantitumor).

Figure 12. Cyclic voltammogram in DMSO solution with 0.1 M tetrabuty- lammonium perchlorate (TBAP), scan rate 50 mVs−1 for 10−3 M of [VIVO (L1)(2,4-pentadionate)] Cl・4HCl.
3.10. Voltammetric Studies
The voltammogram reveals two reduction peaks for the complex [VIVO(L1)(2,4-pentadionate)]Cl・4HCl, centered at −0.75 V and −0.43 V which correspond to VIV/VII and VIV/VIII, respectively as appeared in (Figure 12) [56] .
Cite this paper
Azza A.Hassoon,NagwaNawar,Mohsen M.Mostafa,Najlaa S.Al-Radadi, (2016) New Square-Pyramidal Oxovanadium (IV) Complexes Derived from Polydentate Ligand (L1). Open Journal of Inorganic Chemistry,06,23-65. doi: 10.4236/ojic.2016.61003
References
- 1. Tsiani, E. and Fantus, I.G. (1997) Vanadium Compounds Biological Actions and Potential as Pharmacological Agents. Trends in Endocrinology & Metabolism, 8, 51-58.
http://dx.doi.org/10.1016/S1043-2760(96)00262-7 - 2. Goldwaser, I., Gefel, D., Gershonov, E., Fridkin, M. and Shechter, Y. (2000) Insulin-Like Efects of Vanadium: Basic and Clinical Implications. Journal of Inorganic Biochemistry, 80, 21-25.
http://dx.doi.org/10.1016/S0162-0134(00)00035-0 - 3. Thompson, H.J., Chasteen, N.D. and Meeker, L.D. (1984) Dietary Vanadyl (IV) Sulfate Inhibits Chemically-Induced Mammary Carcinogenesis. Carcinogenesis, 5, 849-851.
http://dx.doi.org/10.1093/carcin/5.6.849 - 4. Rizk, S.L. and Sky-Peck, H.H. (1984) Comparison between Concentrations of Trace Elements in Normal and Neoplastic Human Breast Tissue. Cancer Research, 44, 5390-5394.
- 5. De Silva, C.R., Wang, R. and Zheng, Z. (2006) Highly Luminescent Eu (III) Complexes with 2,4,6-Tri(2-pyridyl)-1,3,5-triazine Ligand: Synthesis, Structural Characterization, and Photo-Luminescence Studies. Polyhedron, 25, 3449-3455.
http://dx.doi.org/10.1016/j.poly.2006.06.032 - 6. Paul, P. (2002) Ruthenium, Osmium and Rhodium Complexes of Polypyridyl Ligands: Metal-Promoted Activities, Stereochemical Aspects and Electrochemical Properties. Proceedings of the Indian Academy of Sciences, 114, 269-276.
http://dx.doi.org/10.1007/BF02703819 - 7. Pruchnik, F.P., Jakimowicz, P., Ciunik, Z., Czerwinska, J.Z., Opolski, A., Wietrzyk, J. and Wojdat, E. (2002) Rhodium (III) Complexes with Polypyridyls and Pyrazole and Their Antitumor Activity. Inorganica Chimica Acta, 334, 59-66.
http://dx.doi.org/10.1016/S0020-1693(02)00776-4 - 8. Najafpour, M.M., Holynska, M., Amini, M., Kazemi, S.H., Lis, T. and Bagherzadeh, M. (2010) Two New Silver(I) Complexes with 2,4,6-Tris(2-pyridyl)-1,3,5-triazine (Tptz): Preparation, Characterization, Crystal Structure and Alcohol Oxidation Activity in the Presence of Oxone. Polyhedron, 29, 2837-2843.
http://dx.doi.org/10.1016/j.poly.2010.07.005 - 9. Maghami, M., Farzaneh, F., Simpson, J. and Moazeni, A. (2014) Synthesis, Characterization and Crystal Structure of a Cobalt(II) Coordination Polymer with 2,4,6-Tris(2-pyridyl)-1,3,5-triazine and Its Use as an Epoxidation Catalyst. Polyhedron, 73, 22-29.
http://dx.doi.org/10.1016/j.poly.2014.02.012 - 10. Chen, D., Milacic, V., Frezza, M. and Dou, Q.P. (2009) Metal Complexes, Their Cellular Targets and Potential for Cancer Therapy. Current Pharmaceutical Design, 15, 777-791.
http://dx.doi.org/10.2174/138161209787582183 - 11. Hambley, T.W. and Hait, W.N. (2009) Is Anticancer Drug Development Heading in the Right Direction. Cancer Research, 69, 1259-1261.
http://dx.doi.org/10.1158/0008-5472.CAN-08-3786 - 12. Leung, C.H., Zhong, H.J., Chan, D.S.H. and Ma, D.L. (2013) Bioactive Iridium and Rhodium Complexes as Therapeutic Agents. Coordination Chemistry Reviews, 257, 1764-1776.
http://dx.doi.org/10.1016/j.ccr.2013.01.034 - 13. Ma, D.L., He, H.Z., Leung, K.H., Chan, D.S. and Leung, C.H. (2013) Bioactive Luminescent Transition-Metal Complexes for Biomedical Applications. Angewandte Chemie International Edition, 52, 7666-7682.
http://dx.doi.org/10.1002/anie.201208414 - 14. Vogel, A.I. (1994) A Text Book of Quantitative Inorganic Chemistry. Longmans, London.
- 15. Bain, G.A. and Berry, J.F. (2008) Diamagnetic Corrections and Pascal’s Constants. Journal of Chemical Education, 85, 532-536.
http://dx.doi.org/10.1021/ed085p532 - 16. Mosmann, T. (1983) Rapid Colorimetric Assay for Cellular Growth and Survival: Application to Proliferation and Cytotoxicity Assays. Journal of Immunological Methods, 65, 55-63.
http://dx.doi.org/10.1016/0022-1759(83)90303-4 - 17. Gangadevi, V. and Muthumary, J. (2007) Preliminary Studies on Cytotoxic Effect of Fungal Taxol on Cancer Cell Lines. African Journal of Biotechnology, 6, 1382-1386.
- 18. Wilson, A.P. (2000) Cytotoxicity and Viability Assays in Animal Cell Culture: A Practical Approach. 3rd Edition, Oxford University Press, Oxford.
- 19. Denizot, F. (1986) Lang R. Rapid Colorimetric Assay for Cell Growth and Survival Modifications to the Tetrazolium Dye Procedure Giving Improved Sensitivity and Reliability. Journal of Immunological Methods, 89, 271-277.
http://dx.doi.org/10.1016/0022-1759(86)90368-6 - 20. Mauceri, H.J., Hanna, N.N., Beckett, M.A., Gorski, D.H., Staba, M.J., Stellato, K.A., Bigelow, K., Heimann, R., Gately, S., Dhanabal, M., Soff, G.A., Sukhatme, V.P., Kufe, D.W. and Weichselbaum, R.R. (1998) Combined Effects of Angiostatin and Ionizing Radiation in Anti-Tumor Therapy. Nature, 394, 287-291.
http://dx.doi.org/10.1038/28412 - 21. Stylianakis, I., Kolocouris, A., Kolocouris, N., Fytas, G., Foscolos, G.B., Padalko, E., Neyts, J. and Clerq, E.D. (2003) Spiro[pyrrolidine-2,20-adamantanes]: Synthesis, Anti-Influenza Virus Activity and Conformational Properties. Bioorganic & Medicinal Chemistry Letters, 13, 1699-1703.
http://dx.doi.org/10.1016/S0960-894X(03)00231-2 - 22. Geary, W.J. (1971) The Use of Conductivity Measurements in Organic Solvents for the Characterisation of Coordination Compounds. Coordination Chemistry Reviews, 7, 81-122.
http://dx.doi.org/10.1016/S0010-8545(00)80009-0 - 23. Nakamoto, K. (2009) Infrared and Raman Spectra of Inorganic and Coordination Compounds. John Wiley and Sons, Inc., 58B.
- 24. Abu-Hussen, A.A.A. and Emara, A.A.A. (2004) Metal Complexes of Some Thiocarbohydrazone Ligands: Synthesis and Structure. Journal of Coordination Chemistry, 57, 973-987.
http://dx.doi.org/10.1080/00958970412331272412 - 25. Selbin, J. (1964) Metal Oxocations. Journal of Chemical Education, 41, 86.
http://dx.doi.org/10.1021/ed041p86 - 26. Ferraro, J.R. (1966) Low Frequency Vibrations of Inorganic and Coordination Compounds. Plenum Press, New York.
- 27. Beynon, J.H. (1960) Mass Spectrometry and its Applications to Organic Chemistry. Elsevier, Amsterdam.
- 28. Zhanglin, Y., Forissier, M., Vedrine, J.C. and Volta, J.C. (1994) On the Mechanism of n-Butane Oxidation to Maleic Anhydride on VPO Catalysts. II. Study of the Evolution of the VPO Catalysts under n-Butane, Butadiene and Furan Oxidation Conditions. Journal of Catalysis, 145, 267-275.
http://dx.doi.org/10.1006/jcat.1994.1034 - 29. Bencini, A. and Gattechi, D. (1990) EPR of Exchange Coupled System. Springer-Verlach, Berline.
- 30. Abou-Hussen, A.A., El-Metwally, N.M., Saad, E.M. and El-Asmy, A.A. (2005) Spectral, Magnetic, Thermal and Electrochemical Studies on Phthaloyl Bis-(Thiosemicarbazide) Complexes. Journal of Coordination Chemistry, 58, 1735-1749.
http://dx.doi.org/10.1080/00958970500262270 - 31. Job, P. (1928) Formation and Stability of Inorganic Complexes in Solution. Annales de Chimie (France), 9, 113-203.
- 32. Seleem, H.S., El-Inany, G.A., Mousa, M. and Hanafy, F.I. (2009) Spectroscopic Studies on 2-[2-(4-Methylquinolin-2-yl) Hydrazono]-1,2-Diphenylethanone Molecule and Its Metal Complexes. Spectrochimica Acta, 74, 869-874.
http://dx.doi.org/10.1016/j.saa.2009.08.024 - 33. Lever, A.B.P. (1984) Inorganic Electronic Spectroscopy. Elsevier, Amsterdam.
- 34. Khalil, S.M.E. (2003) Synthesis, Spectroscopic and Magnetic Studies on Metal Complexes of 5-Methyl-3-(2-Hydroxyphenyl)Pyrazole. Journal of Coordination Chemistry, 56, 1013-1024.
http://dx.doi.org/10.1080/0095897031000135289 - 35. Khalil, S.M.E. and El-Shafiy, H.F.O. (2000) Vo(IV), Fe(III), Co(II) and Cd(II) Complexes of Asymmetric Schiff Base Ligands (N2O3). Synthesis and Spectroscopic Studies. Synthesis and Reactivity in Inorganic, Metal-Organic, and Nano-Metal Chemistry, 30, 1817-1833.
http://dx.doi.org/10.1080/00945710009351871 - 36. El-Metwally, N.M., El-Shazly, R.M., Gabr, I.M. and El-Asmy, A.A. (2005) Physical and Spectroscopic Studies on Novel Vanadyl Complexes of Some Substituted Thiosemi-Carbazides. Spectrochimica Acta (A), 61, 1113-1119.
http://dx.doi.org/10.1016/j.saa.2004.06.027 - 37. Abou-Hussein, A.A. and Linert, W. (2015) Synthesis, Spectroscopic Studies and Inhibitory Activity against Bactria and Fungi of Acyclic and Macrocyclic Transition Metal Complexes Containing a Triamine Coumarine Schiff-Base Ligand. Spectrochimica Acta, 141, 223-232.
http://dx.doi.org/10.1016/j.saa.2015.01.063 - 38. Delley, B. (2000) From Molecules to Solids with the DMol3Approach. The Journal of Chemical Physics, 113, 7756-7764.
http://dx.doi.org/10.1063/1.1316015
http://dx.doi.org/10.1002/(SICI)1097-461X(1998)68:2<135::AID-QUA6>3.0.CO;2-W - 39. (2009) Materials Studio v 5.0, Accelrys Software Inc.
- 40. Hehre, W.J., Radom, L., Schleyer, P.V.R. and Pople, J.A. (1986) AB Initio Molecular Orbital Theory. John Wiley, New York.
- 41. Yousef, T.A., Abu El-Reash, G.M. and El Morshedy, R.M. (2012) Quantum Chemical Calculations, Experimental Investigations and DNA Studies on (E)-2-((3-Hydroxy-naphthalen-2-yl)methylene)-N-(pyridin-2-yl) Hydrazinecarbothioamide and Its Mn(II), Ni(II), Cu(II), Zn(II) and Cd(II) Complexes. Polyhedron, 45, 71-85.
http://dx.doi.org/10.1016/j.poly.2012.07.041 - 42. Linert, W. and Taha, A. (1994) Coordination of Solvent Molecules to Square-Planar Mixed-Ligand Nickel (II) Complexes—A Thermodynamic and Quantum-Mechanical Study. Journal of the Chemical Society, Dalton Transactions, 1994, 1091-1095.
http://dx.doi.org/10.1039/dt9940001091 - 43. Govindarajan, M., Periandy, S. and Carthigayen, K. (2012) FT-IR and FT-Raman Spectra, Thermodynamical Behavior, HOMO and LUMO, UV, NLO Properties, Computed Frequency Estimation Analysis and Electronic Structure Calculations on a Bromotoluene. Spectrochimica Acta, 97, 411-422.
http://dx.doi.org/10.1016/j.saa.2012.06.028 - 44. Abu El-Reash, G.M., El-Gammal, O.A., Ghazy, S.E. and Radwan, A.H. (2013) Characterization and Biological Studies on Co(II), Ni(II) and Cu(II) Complexes of Carbohydrazones Ending by Pyridyl Ring. Spectrochimica Acta, 104, 26-34.
http://dx.doi.org/10.1016/j.saa.2012.11.008 - 45. Pearson, R.G. (1989) Absolute Electronegativity and Hardness: Applications to Organic Chemistry. Journal of Organic Chemistry, 54, 1423-1430.
http://dx.doi.org/10.1021/jo00267a034 - 46. Padmanabhan, J., Parthasarathi, R., Subramanian, V. and Chattaraj, P. (2007) Electrophilicity-Based Charge-Transfer Descriptor. The Journal of Physical Chemistry, 111, 1358-1361.
http://dx.doi.org/10.1021/jp0649549 - 47. Parthasarathi, R., Padmanabhan, J., Sarkar, U., Maiti, B., Subramanian, V. and Chattaraj, P.K. (2003) Toxicity Analysis of Benzidine through Chemical Reactivity and Selectivity Profiles: A DFT Approach. Journal of Molecular Structure, 2, 798-813.
- 48. Scrocco, E. and Tomasi, J. (1978) Electronic Molecular Structure, Advances in Quantum Chemistry. Academic Press, Cambridge, 115-193.
- 49. Luque, F.J., López, J.M. and Orozco, M. (2000) Perspective on “Electrostatic Interactions of a Solute with a Continuum. A Direct Utilization of AB initio Molecular Potentials for the Prevision of Solvent Effects”. Theoretical Chemistry Accounts, 103, 343-345.
http://dx.doi.org/10.1007/s002149900013 - 50. Okulik, N and Ubert, A.H.J. (2005) Theoretical Analysis of the Reactive Sites of Non-Steroidal Anti-Inflammatory Drugs. J. Molecular. Design, 4, 17-30.
- 51. Politzer, P., Laurence, P.R. and Jayasuriya, K. (1985) Molecular Electrostatic Potentials: An Effective Tool for the Elucidation of Biochemical Phenomena. Environmental Health Perspectives, 61, 191-200.
http://dx.doi.org/10.1289/ehp.8561191 - 52. Scrocco, E. and Tomasi, J. (1973) The Electrostatic Molecular Potential as a Tool for the Interpretation of Molecular Properties. New Concepts II, Springer, 95-170.
http://dx.doi.org/10.1007/3-540-06399-4_6 - 53. Aljahdali, M. and El-Sherif, A.A. (2013) Synthesis, Characterization, Molecular Modeling and Biological Activity of Mixed Ligand Complexes of Cu(II), Ni(II) and Co(II) Based on 1,10-Phenanthroline and Novel Thiosemicarbazone. Inorganica Chimica Acta, 407, 58-68.
http://dx.doi.org/10.1016/j.ica.2013.06.040 - 54. EL-Saied, F.A., Shakdofa, M.M.E. and Al-Hakimi, A.N. (2011) Synthesis, Characterization and Biological Studies of New Mn(II), Ni(II), Co(II), Cu(II) and Zn(II) of 2-(Benzothiazol-2-yl)-N’-(2,5-dihydroxybenzylidene)acetohydrazide. Journal of the Korean Chemical Society, 55, 19-27.
http://dx.doi.org/10.5012/jkcs.2011.55.1.019 - 55. El-Tabl, A.S., El-Saied, F.A. and Al-Hakimi, A.N. (2008) Spectroscopic Characterization and Biological Activity of Metal Complexes with an ONO Trifunctionalized Hydrazone Ligand. Journal of Coordination Chemistry, 61, 2380-2401.
http://dx.doi.org/10.1080/00958970801914041 - 56. Israel, Y. and Meites, L. (1976) Vanadium. In: Bard, A.J., Ed., Encyclopedia of Electrochemistry of the Elements, Vol. VII, Chap. VII-2, Marcel Dekker Inc., New York, 336-378.

Figure S1. IR spectrum of L1 (TPTZ).

Figure S2.IR spectrum of the [VO(L1)(2,4-pentadionate)] Cl•4HCl complex.

Figure S3.IR spectrum of the [V2O2(L1)(SO4)2(EtOH)5/2] complex.

Figure S4. IR spectrum of the [V2O2(L1)(SO4)2(EtOH)3/2(H2O)1/2] complex.

Figure S5. IR spectrum of the [VO(L1)SO4(H2O)3/2]•2.5H2O complex.

Figure S6. IR spectrum of the [V2O2(L1)(SO4)2(H2O)]•H2O complex.
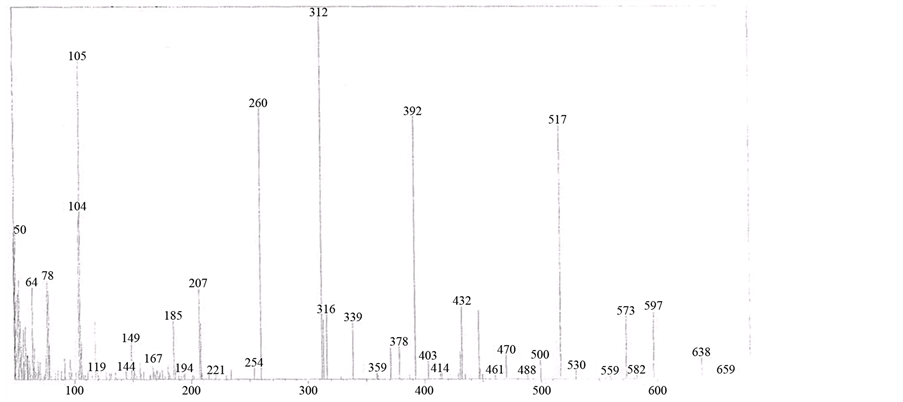
Figure S7. The mass spectrum of [VO(L1)(2,4-pentadionate)] Cl•4HCl complex.

Figure S8. The fragmentation pattern of [VO(L1)(2,4-pentadionate)] Cl•4HCl complex.
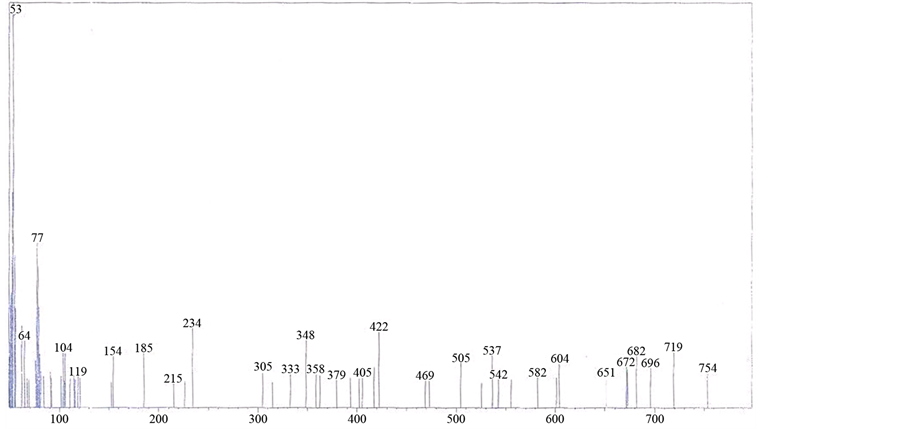
Figure S9. The mass spectrum of [V2O2(L1)(SO4)2(EtOH)5/2].

Figure S10. The fragmentation pattern of [V2O2(L1)(SO4)2(EtOH5)/2].
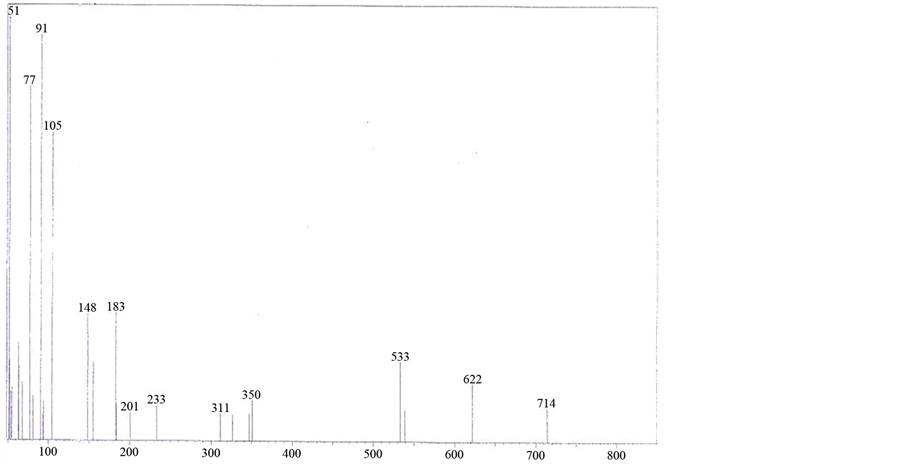
Figure S11.The mass spectrum of [V2O2(L1)(SO4)2(EtOH)3/2(H2O)1/2].

Figure S12.The fragmentation pattern of [V2O2(L1)(SO4)2(EtOH)3/2(H2O)1/2].
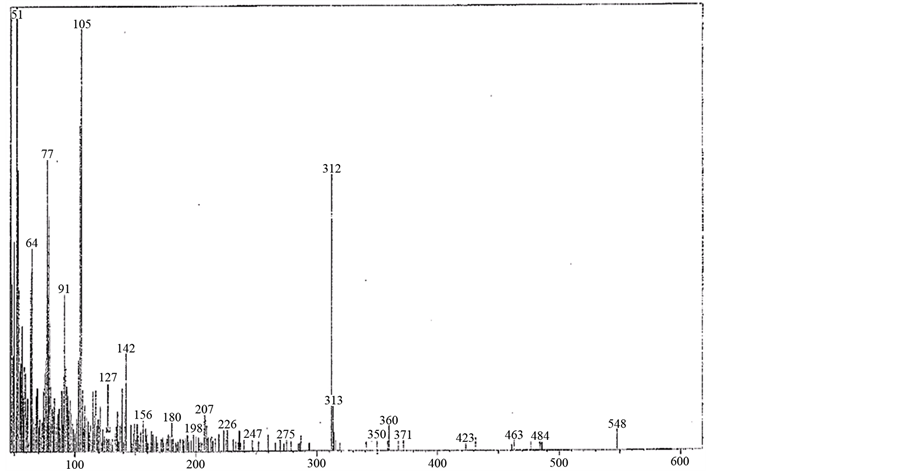
Figure S13.The mass spectrum of [VO(L1)SO4(H2O)3/2]•2.5H2O.

Figure S14.The fragmentation pattern of [VO(L1)SO4(H2O)3/2]•2.5H2O.
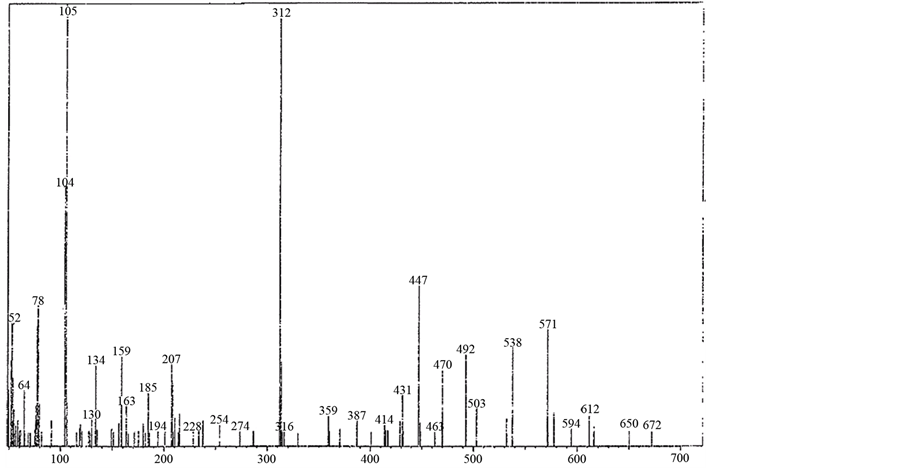
Figure S15. The mass spectrum of [V2O2(L1)(SO4)2(H2O)]•H2O.

Figure S16. The fragmentation pattern of [V2O2(L1)(SO4)2(H2O)]•H2O

Figure S17. The TGA curve of [VO(L1)(2,4-pentadionate)] Cl•4HCl.

Figure S18. The TGA curve of [V2O2(L1)(SO4)2(EtOH)5/2].

Figure S19. The TGA curve of [VO(L1)SO4(H2O)3/2]•2.5H2O.

Figure S20. The TGA curve of [V2O2(L1)(SO4)2(H2O)]•H2O.

Figure S21. X-band ESR spectrum of [VO(L1)(2,4-pentadionate)] Cl•4HCl.

Figure S22. X-band ESR spectrum of [VO(L1)SO4(H2O)3/2]•2.5 H2O.

Figure S23.The electronic spectra of [V2O2(L1)(SO4)2(H2O)]•H2O.

Figure S24. Electronic spectra of [V3O3(L1)(SO4)3(EtOH)1/2(H2O)3/2].

Figure S25.The electronic spectrum of [VO(L1)(2,4-pentadionate)] Cl•4HCl.

Figure S26.The electronic spectrum of [V2O2(L1)(SO4)2(EtOH)5/2].
 (a)
(a) 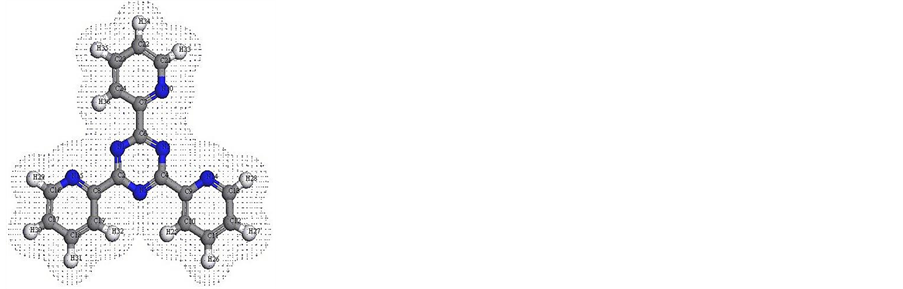 (b)
(b)  (c)
(c) 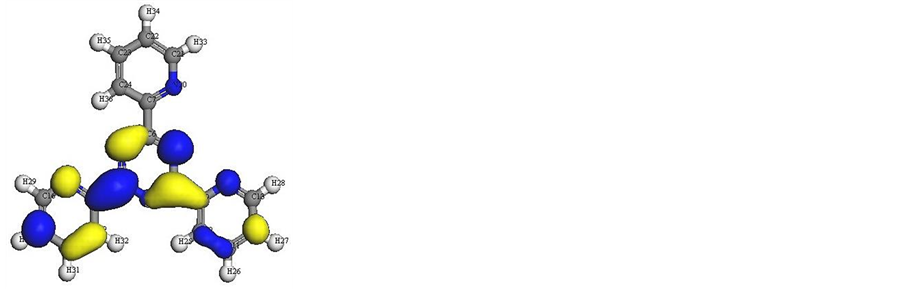 (d)
(d)
Figure S27.Molecular modeling of (a) (L1), (b) electron density, (c) HOMO and (d) LUMO.
 (a)
(a) 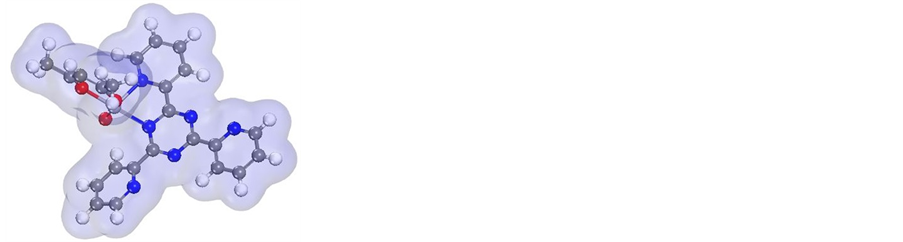 (b)
(b) 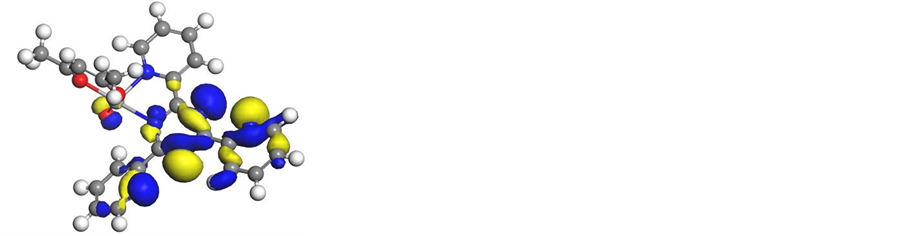 (c)
(c) 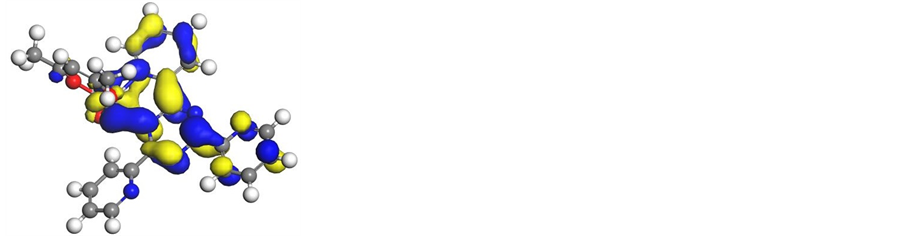 (d)
(d)
Figure S28.Molecular modeling of (a) [VO((L1)) (2,4-pentadionate)] Cl•4HCl, (b) electron density, (c) HOMO and (d) LUMO.
 (a)
(a) 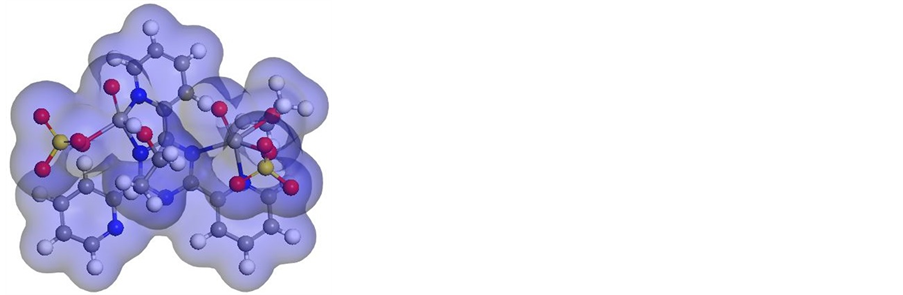 (b)
(b) 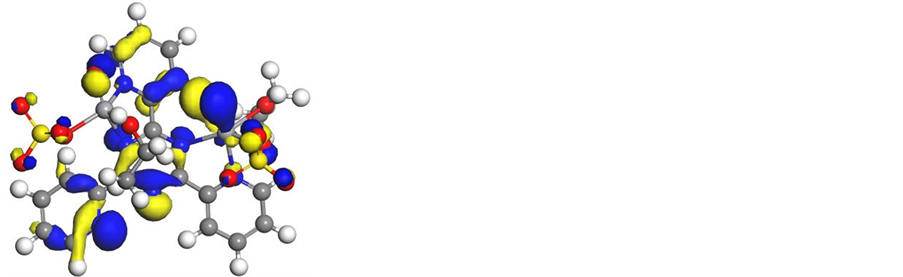 (c)
(c) 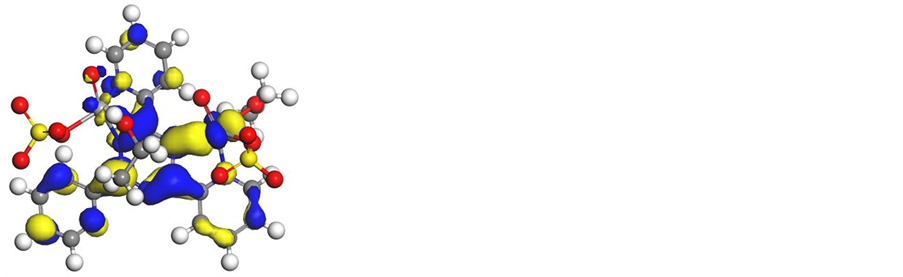 (d)
(d)
Figure S29. Molecular modeling of (a) [V2O2((L1))(SO4)2(EtOH)5/2], (b) electron den- sity, (c) HOMO and (d) LUMO.
 (a)
(a) 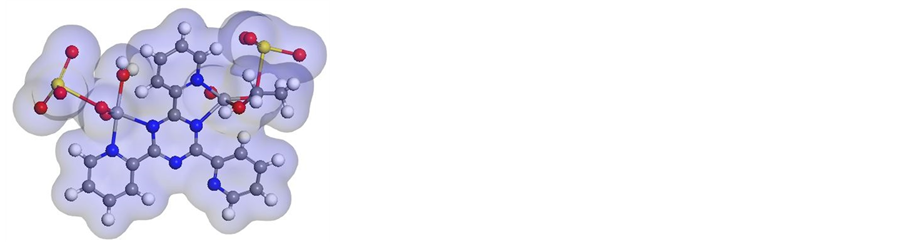 (b)
(b) 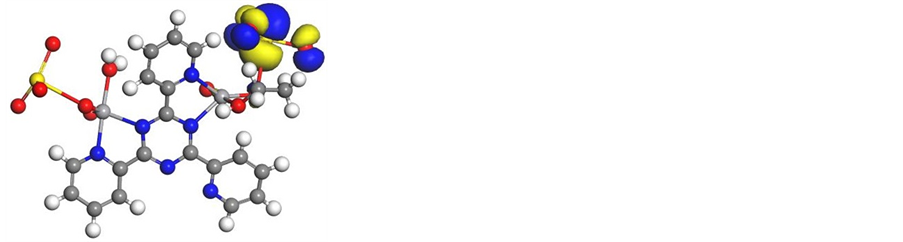 (c)
(c) 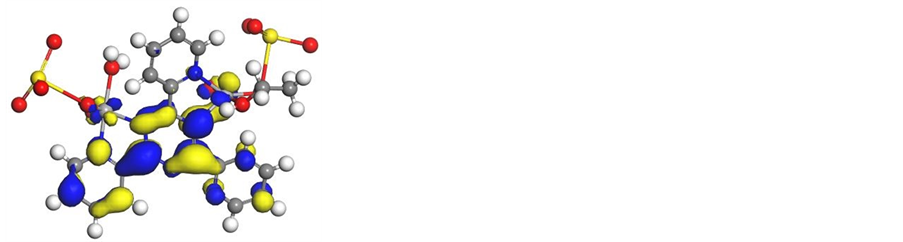 (d)
(d)
Figure S30.Molecular modeling of (a)[V2O2((L1))(SO4)2(EtOH)3/2(H2O)1/2], (b) electron density, (c) HOMO and (d) LUMO.
 (a)
(a) 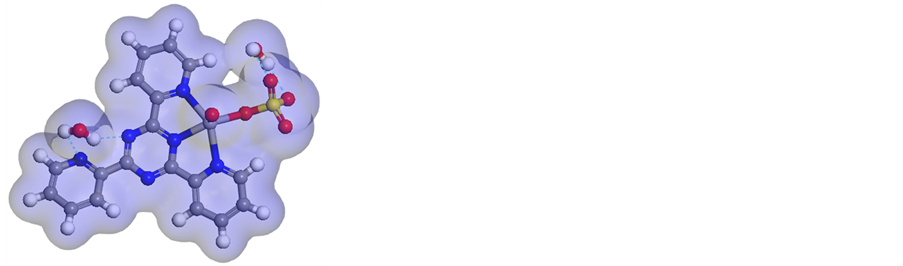 (b)
(b) 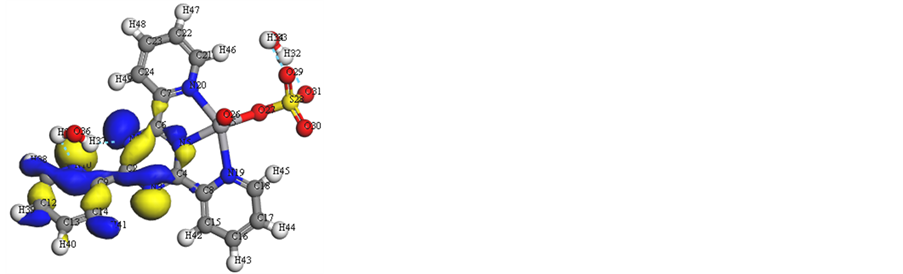 (c)
(c) 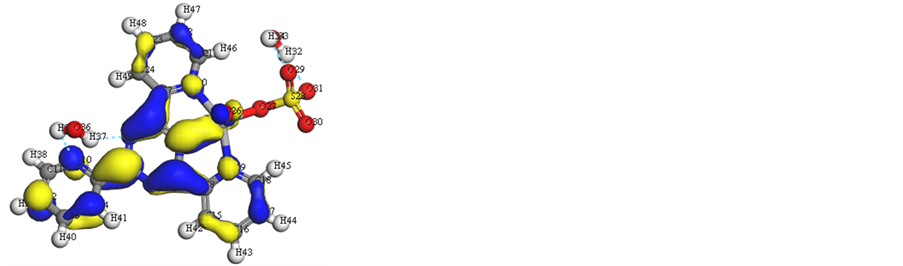 (d)
(d)
Figure S31. Molecular modeling of (a) [VO((L1))SO4(H2O)3/2]•2.5H2O, (b) electron density, (c) HOMO and (d) LUMO.
 (a)
(a) 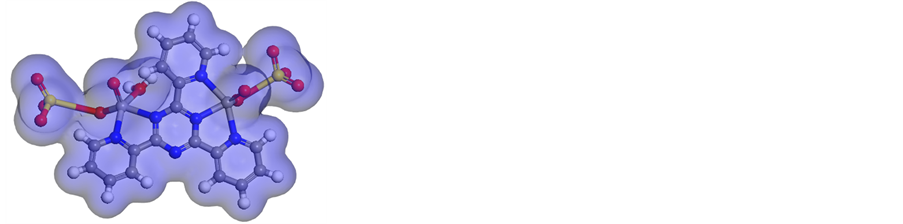 (b)
(b)  (c)
(c)  (d)
(d)
Figure S32.Molecular modeling of (a) [V2O2((L1))(SO4)2(H2O)]•H2O, (b) electron density, (c) HOMO and (d) LUMO.
Table S1.Bonds lengths (Å) of (L1) using DFT-method from DMOL3 calculations.
Table S2.Bonds angles (˚) of (L1) using DFT-method from DMOL3 calculations.
Table S3.Bonds lengths (Å) of [VO((L1))(2,4-pentadionate)] Cl•4HCl using DFT-method from DMOL3 calculations.
Table S4.Bonds angles (˚) of [VO((L1))(2,4-pentadionate)] Cl•4HCl using DFT-method from DMOL3 calculations.
Table S5.Bonds lengths (Å) of [V2O2((L1))(SO4)2(EtOH)5/2] using DFT-method from DMOL3 calculations.
Table S6. Bonds lengths (Å) of [V2O2((L1))(SO4)2(EtOH)5/2] using DFT-method from DMOL3 calculations.
Table S7.Bonds lengths (Å) of [V2O2((L1))(SO4)2(EtOH)3/2(H2O)1/2] using DFT-method from DMOL3 calculations.
Table S8.Bonds angles (˚) of)[V2O2((L1))(SO4)2(EtOH)3/2(H2O)1/2] using DFT-method from DMOL3 calculations.
Table S9.Bonds lengths (Å) of [VO((L1))SO4(H2O)3/2]•2.5H2O using DFT-method from DMOL3 calculations.
Table S10.Bonds angles (˚) of [VO((L1))SO4(H2O)3/2]•2.5H2O using DFT-method from DMOL3 calculations.
Table S11. Bonds lengths (Å) of [V2O2((L1))(SO4)2(H2O)]•H2O using DFT-method from DMOL3 calculations.
Table S12.Bonds angles (˚) of [V2O2((L1))(SO4)2(H2O)]•H2O using DFT-method from DMOL3 calculations.
NOTES

*Corresponding author.