Journal of Building Construction and Planning Research
Vol.2 No.1(2014), Article ID:43864,9 pages DOI:10.4236/jbcpr.2014.21003
An Assessment of Thermal Comfort in Multi Storey Office Buildings in Ghana
Barbara Simons1*, Christian Koranteng², Emmanuel Adinyira¹, Joshua Ayarkwa¹
1Department of Building Technology, Kwame Nkrumah University of Science and Technology, Kumasi, Ghana
2Department of Architecture, Kwame Nkrumah University of Science and Technology, Kumasi, Ghana
Email: *nanaakuaayebea@yahoo.co.uk
Copyright © 2014 by authors and Scientific Research Publishing Inc.
This work is licensed under the Creative Commons Attribution International License (CC BY).
http://creativecommons.org/licenses/by/4.0/


Received 27 December 2013; revised 29 January 2014; accepted 15 February 2014
ABSTRACT
Amidst the recent development in the usage of curtain walls for office buildings, high utilization of energy and poor thermal comfort issues have become paramount. This paper assesses thermal comfort in multi storey (naturally and mechanically ventilated) office buildings in Accra, the Capital city of Ghana using Fanger’s Predicted Mean Votes (PMV) and Predicted Percentage of Dissatisfied persons (PPD) model. The model relates to the American Society of Heating, Refrigerating and Air-Conditioning Engineers (ASHRAE) Standard 55 (which gives an acceptable temperature range of 23˚C - 26˚C) and the International Standards Organization (ISO) 7730. Indoor environmental parameters (temperature and relative humidity) of 4 multi storey office buildings were recorded over a 10 month period. The environmental parameters were analyzed using PMVcalc_v2 software which resulted in the generation of PMV-PPD values. The findings reveal high PMV-PPD values in the Naturally Ventilated Building (NVB) whiles the Mechanically Ventilated Buildings (MVB) fall within the comfort zone. Meanwhile, the Actual Mean Votes (AMV) by the occupants suggest all four buildings are relatively comfortable with the mechanically ventilated offices being more comfortable. Additionally, it is recommended that buildings are orientated with their longer sides facing north-south, with enough shading in order to improve the thermal comfort conditions of work spaces.
Keywords:Thermal Comfort; ASHRAE Standard 55; Office Buildings; Natural; Mechanical

1. Introduction
Man has over the years been successful in creating environment that is conducive for all kinds of activities. One of the basic requirements of this environment is to maintain thermal conditions comfortable for occupants as these have a direct effect on health, productivity and morale [1] . What is more, [1] ascertains that thermal comfort is attained when a thermal balance is achieved: a situation in which no heat storage occurs in the body. Although this can be achieved over a wide range of thermal environmental conditions, thermal-comfort is associated with conditions to which the body can readily adjust. Reference [2] defines thermal comfort as the “state of the mind that expresses satisfaction with the surrounding environment”. Standards such as ASHRAE Standard 55 [2] and ISO Standard 7730 [3] have been the basis in the determination of thermal comfort by most practitioners and researchers [4] . Nonetheless, people in different climatic zones feel comfortable at different indoor air temperatures: a situation which can vary considerably from that of the world standards.
The factors affecting thermal comfort depend on four environmental (i.e. dry bulb temperature, mean radiant temperature, relative humidity and air velocity) and two personal (clothing-insulation and physical activity) parameters [5] . The thermal comfort standard prescribed by ISO 7730 was the first to have been used on a worldwide basis [6] . It’s based on Fanger’s work in climate chamber experiments using young Danish students and eventually the PMV model.
Architecturally, the hot and humid regions are the hardest climates to improve through design: due to high outdoor thermal conditions (humidity and temperature) that result in soaring indoor temperatures exceeding the ASHRAE summertime comfort upper limit of 26˚C. A temperature limit should at least get 90% of occupants feeling thermally comfortable for most part of the year [7] .
1.1. Problem Statement
In recent years, most multi storey office buildings in Ghana have become what is termed the “glass box” exposing all or most part of its facades to the high day time temperatures. The effect of which is the contribution of thermal discomfort within the indoor spaces. In an attempt to ameliorate the effect of this exposure, multi storey office buildings have resorted to the use of complex HVAC systems which comes with its problems such as high usage of energy and greater emission of Carbon dioxide (CO2) into the atmosphere.
1.2. Objectives of the Paper
The objectives of the research include the followings:
• To measure indoor and outdoor thermal comfort parameters of the selected buildings;
• To compare the predicted mean votes (PMV) within the office with the actual mean votes (AMV) given by the occupants.
2. Literature Review
The PMV Model
The Fanger-based approach, which is alternatively known as the heat-balance approach, is built on experiments in climate chambers and eventually theorized into the PMV-PPD model. It was fist propounded by Fanger around the 1970s with about 1296 participants dressed in standardized clothing and completed standardized activities constituting a metabolism rate of 1.2 Mets or 70 W/m2. The predicted mean vote (PMV) equation has been used in international standards to predict thermal sensation of occupants. It has been widely used by designers to assess indoor thermal environments [8] .
The PMV equation uses the four environmental parameters; air temperature (˚C), mean radiant temperature (˚C), air velocity (m/s), relative humidity (%) and two personal variables (clothing insulation (Clo) and metabolic rate (Met)). The aforementioned when calculated, forms an index that can be used to predict the thermal comfort levels within a space. The index provides a score that corresponds to the ASHRAE thermal sensation scale and represents the average thermal sensation felt by a group of people in a space [9] [10] . Table 1 shows the seven point ASHRAE thermal sensation scale.
Overall, thermal comfort field studies [8] [11] have suggested that the PMV model does not always accurately predict the actual thermal sensation of occupants. Researchers have cited measurement error and contextual assumptions as the two contributing factors to the discrepancies [12] . Measuring of the physical variables with reliable instrument, clothing insulation, activity levels, individual differences, building differences, outdoor climate, behavioural and psychological adaptation are all factors that have been mentioned by thermal comfort

Table 1. ASHRAE thermal sensation scale.
researchers as factors contributing to the bias nature of the PMV model [12] -[14] . The PMV model prediction has been found by a majority of researchers as a better predictor in mechanically ventilated buildings [15] and [16] . In the case of naturally ventilated buildings, differences have been observed between the thermal sensations reported by the occupants and that of the PMV model [17] . Studies have shown that the PMV either underestimates or over-estimates the thermal sensation of occupants. Reference [18] and [19] for instance observed the underestimation of thermal sensation by PMV model in their respective studies.
Air temperature is often taken as the main design parameter for thermal comfort. Hence it is essential for occupants’ well-being, productivity and efficiency [20] . Reference [21] suggested that air temperature alone is a good indicator of thermal comfort. The effects of other environmental parameters on thermal comfort have also been studied by [22] as cited in [5] .
Reference [23] in his study asserted that, heat gain through the exterior window accounts for 25% - 28% of the total heat gain. Moreover, the thermal capacities of various materials respond differently on incident solar radiation [24] .
Orientation and spatial organization also affect the ability of a building to ventilate and receive solar radiation [25] . To minimize solar heat gain and maximize ventilation, buildings should be orientated with their longer sides intercepting prevailing winds and the shorter sides facing the direction of the strongest solar radiation. The positive effects of shading on thermal comfort have been stated by [26] and [27] .
Reference [28] studied thermal comfort and workplace occupant satisfaction in low energy office buildings in Germany. They reported that votes of “just right” and “slightly warm” covered operative temperatures of above 27˚C. Again, they noted that PMV was very wide spread on the sensation scale and only changed slightly, dependent on the class of the subjective votes (“just right”, “slightly warm” or “very warm”).
Similar studies conducted by [17] in UK summer conditions found a mean temperature value of 23.9˚C in office buildings with a range of 21.6˚C to 26˚C. Additionally, there was an average PMV value of −0.25 with a range of −1.6 to 0.5. Reference [16] also found lower mean temperatures of 23.8˚C in offices he studied in London.
Very few studies have been conducted in the area of thermal comfort in Ghana [29] [30] . There is therefore a need to build a growing literature of the subject. Thermal comfort and indoor thermal environment can have an important impact on productivity [31] . Accordingly the aim of this study is to evaluate thermal comfort levels in naturally and mechanically ventilated offices using the PMV-PPD. Eventually, all the stakeholders in the building industry will be informed on best practices that can improve upon thermal comfort in office buildings.
3. Research Methodology
Thermal comfort of the offices was studied by means of quantitative survey along with questionnaire for building occupants. The thermal comfort index (PMV) which formed the basis of the study is considered to be applicable within an environment for the following reasons; Fanger’s investigation was based upon a wide range of environmental conditions, including conditions when air temperature >30˚C, and relative humidity up to 70%. In addition, a moderate thermal environment is deemed to have been achieved when PMV values range from −3 as cold to +3 as hot. Figure 1 below illustrates the functional relationship between PMV and PPD. At PMV neutral (0), 5% of the occupants are still dissatisfied.
Four buildings (Table 2) situated within the central business district of Accra were selected for the studies. The selected buildings are representative of current design trends in Ghanaian high-tech office construction due to their exposed glazing.
3.1. Participants in the Study
In all, 195 occupants in all 4 buildings participated in the study. All participants were workers on the floors monitored and had stayed in their current offices from between a year to ten years. The respondents in total consisted of 80 females and 115 males. Greater majority of the respondents (131) were between the ages of 25 - 35 years, while 8 were under 25 years, 29 participants were between 36 - 45 years and 37 were above 45 years.
Table 2. General overview of selected buildings.
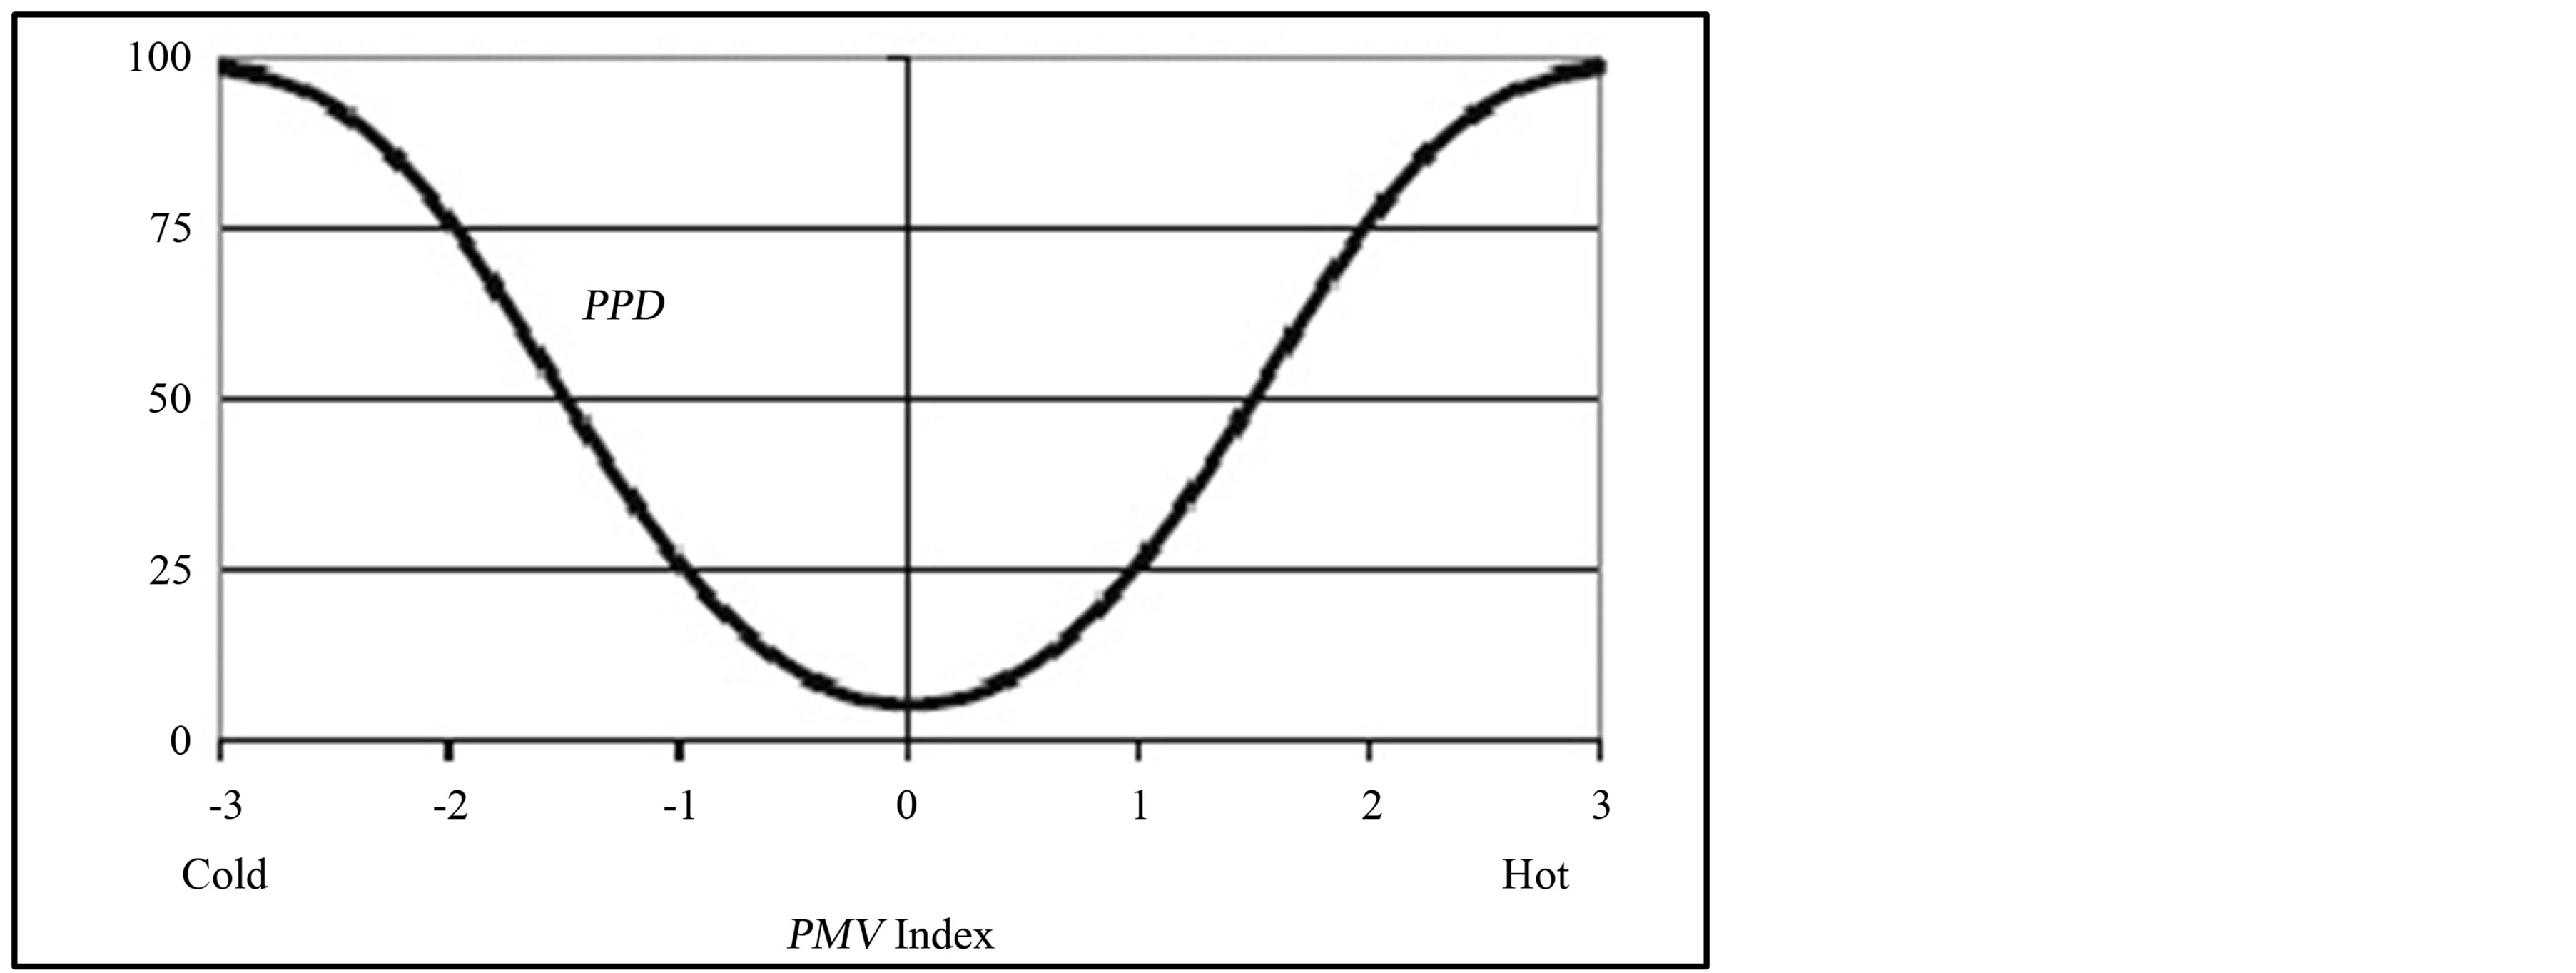
Figure 1. The PMV-PPD curve.
3.2. Experimental Design
A field study was carried out from the 14th April, 2012 to 31st January, 2013, representing both the raining and the dry seasons in Ghana. Subjective measurements (in form of a thermal comfort questionnaire) and objective data were recorded during the study period. The objective data made use of loggers (onset hobo sensors for environmental parameters) which were installed at various points in the offices. Indoor temperature and relative humidity levels were measured at 10 minutes intervals for the study period. Altogether, a total of 714,286 data set points were measured and used for the study.
3.2.1. Subjective Measurements
Participants were asked to rate their thermal sensation on the ASHRAE seven-point scale. This was to gather information on how the occupants feel within their office spaces, thus their Actual Mean Votes (AMV). These were then compared to the Predicted Mean Votes (PMV). As part of the questionnaire, occupants were also asked to put down what they normally wore to work. This was used to find the corresponding clothing value from a clothing checklist [17] . Thermal insulation of the chairs of participants (0.1) was added to the clothing insulation for each respondent. Metabolic rate of 1.2 mets which is proposed in ISO 7730 (2005) and asserted in [31] was used as occupants in the offices engaged in sedentary activities.
3.2.2. Objective Data
Air temperature (T) and relative humidity (R.H) values were monitored with onset hobo sensors, whilst the hot wire anemometer was used to measure the air velocity (A.V). Measurements were taken at a height of 1.1 m above the floor, which represent the height of an occupant when seated. The accuracy of the measuring instruments is shown below (Table 3).
Table 3. Measuring equipment technical data.
3.3. PMV Calculation
The software, PMV calc v2 was used to calculate the Predicted Mean Vote (PMV) and the Predicted Percentage of Dissatisfied occupants (PPD) after [32] . This was achieved by inputting the clothing values, metabolic rates of the occupants, air velocities, indoor temperatures and relative humidity values of the occupied spaces into the software. The output results were tabulated and analyzed.
Statistical Analysis of Data
Greenline software was used to launch and download the files from the data loggers. The downloaded values were screened and exported to an MS Excel file. In Excel, the text files were screened and built together in monthly tables (comprising of all the days within the month). Formulae sheets (excel working sheets) were generated to produce mean hourly values. Output values were generated considering only the working hours from 8:00 am to 5:00 pm. The generated values were analyzed using descriptive statistics.
4. Results and Discussion
The results for the study are presented. They provide clues on the thermal comfort levels in the studied offices.
4.1. Outdoor Conditions
The lowest mean outdoor temperature measured within the study period was 26.2˚C (in August) corresponding to 76.2% relative humidity (R.H) with the highest being 29.8˚C recorded in November and 74.4% R.H. The highest R.H was however recorded in July with a value of 78.9% with January recording the lowest of 72.6%. With the values recorded, the two main climatic seasons in Ghana is clearly indicated.
4.2. Indoor Measurement Results and Survey Responses
Table 4 shows mean, minimum and maximum values of all indoor environmental parameters. PMV of occupants with its corresponding PPD is illustrated. The Actual Mean Votes (AMV) of the respondents was also determined. Based on the findings, the average Relative humidity values recorded within the MVB’s were 54%, 59% and 51.2% as against 71.6% in the NVB. The subjective analysis of humidity is also presented in Figure 2. The respondents were satisfied with the humidity levels in the offices though it is known that humidity has little or no effect on thermal comfort when within 6% - 90% [33] .
From Table 4, it can be deduced that the mean air temperatures for the MVBs’ falls within the ASHRAE’s acceptable temperature range of 23˚C - 26˚C [2] . Albeit, many studies have concluded that the comfort temperature is higher in tropical regions, since humans have the ability to acclimatise [34] . Reference [35] reported that the comfort band for Malaysia for all building types is between 23.6˚C - 28.6˚C. Air velocity from Table 4 ranges from 0.2 - 0.5 m/s with an average of 0.2 m/s, a result which correlates with [36] studies. In their studies, average air velocity was found to be 0.16 m/s with most samples having air velocity of lower than 0.2 m/s [36] .
In the World Trade Centre (W.T.C) which is a naturally ventilated building (NVB), average PMV recorded was 1.5 (warm) which corresponded to 51.4% PPD. Meanwhile, the indoor temperature ranged from 26.7 - 29.5˚C. These values are in sharp contrast with [17] studies. In their study, indoor temperature values ranged from 21.6˚C - 26˚C with an average of 23.9˚C. PMV value of −0.25 was also found: making W.T.C warmer with a PMV of 1.5.
The finding in the NVB also contrasts [6] study in the Ghadames, Libya. In their work, the same metabolism rate and clothing values used in this study was used to calculate the PMV values for occupants in naturally ventilated buildings. The PMV was found to be 2.7 (hot). The difference in the two values could be attributed to the
Table 4. Statistical summary of indoor measurement results.

Figure 2. General feeling concerning Humidity.
climate characteristics of Libya. The climate (Ghadames) is characterized by high air temperature, high solar radiation, low rainfall, low humidity and many sandstorms.
Shape and orientation to breezes, vertical shafts to promote air flow, wing walls and overhangs in the direction of winds have to be considered for naturally ventilated buildings [30] . In addition, intelligent systems and system controllers have to be installed in buildings since they have positive effect on thermal comfort [37] . The installation of fans (with a temperature reduction capability of 2˚C [30] could be installed within the offices to reduce the high temperature values as short term improvement mechanism in the free-running building.
The H.T building also recorded an average indoor temperature of 26.1˚C with a range of 24.8˚C - 27.7˚C. The aforesaid could be attributed to the orientation of the building (east-west) with its unprotected glazing: confirming the assertion of a number of studies that heat gain through the exterior window accounts for 25% - 28% of the total heat gain within a space [23] and [38] . A PMV of 0.8 was recorded whiles an AMV of −0.5 was indicated by the respondents. Again though H.T is a MVB, the slightly warm PMV indication is as a result of it orientation and the lack of shading. What is worse, the glazing has also been fixed on the east-west sides of the building.
Respondents in the H.T building during the afternoons take long breaks (1 - 1.5 hrs) outside their offices (35%) whiles those with single occupancy set their air-conditions at 18˚C (19%) instead of the general 20˚C - 24˚C by management.
Other respondents (37%) also felt comfortable within their clothes and yet again, 9% are indifferent.
4.3. PMV and AMV Comparison
In Table 4, PMV calculation for the buildings indicated that the occupants inside the mechanically ventilated buildings were comfortable (averages were all within the central three categories of the thermal sensation scale: −1, 0, 1). The NVB recorded a PMV of 1.5 (between slightly warm and warm). Figure 3 shows the subjective responses (AMV) in all the buildings.
PMV and the average AMV in the NVB (W.T.C) shows wide disparities. Whiles PMV recorded is 1.5, average AMV is 0.5 (Table 4). Significantly, PMV has over-predicted the indoor thermal comfort in the W.T.C by 1 scale unit: A result which is in the range of the findings of [39] . They concluded in their study that there was a discrepancy between PMV and AMV by 1.3 scale units. The over-prediction nature of the PMV has also been recorded by other researchers in their studies [15] [40] . Some reasons for the over-prediction in the current study could be summarised as follows: The fact that the respondent had a couple of adaptive advantages (open windows, use of personal standing fans).
Again, the respondents in the office work in the mornings when the temperature was assumed to be comfortable. During the afternoons where temperature recorded is high, 90% of the respondents are out of the office of various assignments since it’s a financial research company.
Another rationale could also be that the respondents had acclimatised to the temperature and humidity values and therefore reported as such.
Additionally, there are a number of variations within the office spaces that could lead to the high value of the PMV which was not the case during the climate chamber experiment. Amongst them include the use of office equipment (laptops, photocopy machines, printers etc.) and the partitions for individual personalised workstations. Some respondents who are located along the windows are very comfortable in the mornings when the windows are opened (53.9%) whiles those within the central part of the office space are uncomfortable (10.2%).
5. Conclusions
Analysis of data collected and findings from the assessment of thermal comfort in multi storey office buildings have been presented in this paper. The study aimed at evaluating thermal comfort levels of naturally and mechanically ventilated offices in comparison with ASHRAE 55 and ISO 7730 standards.
The study employed Fanger’s PMV-PPD model in finding the thermal comfort levels in the office spaces. Following the results and discussion, it is stated that the PMV-PPD model comfortably predicts thermal comfort in MVBs’ than in NVBs’. Thus, thermal comfort levels found within the MVB compared well with the ASHRAE and ISO standards. The mean temperature of 25˚C for the MVB falls within ASHRAE’s acceptable temperature range of 23˚C - 26˚C (summer comfort). Meanwhile the average subject satisfaction for the MVB of 87.5% is also within ISO 7730’s range of 75% and close to ASHRAE’s 90% of total subject satisfaction which is not the case for the NVB.
6. Recommendation
Adaptive principles must be used to enhance the thermal comfort conditions (external shading, reduction in wall-to-window ratio, etc.) in naturally ventilated buildings.
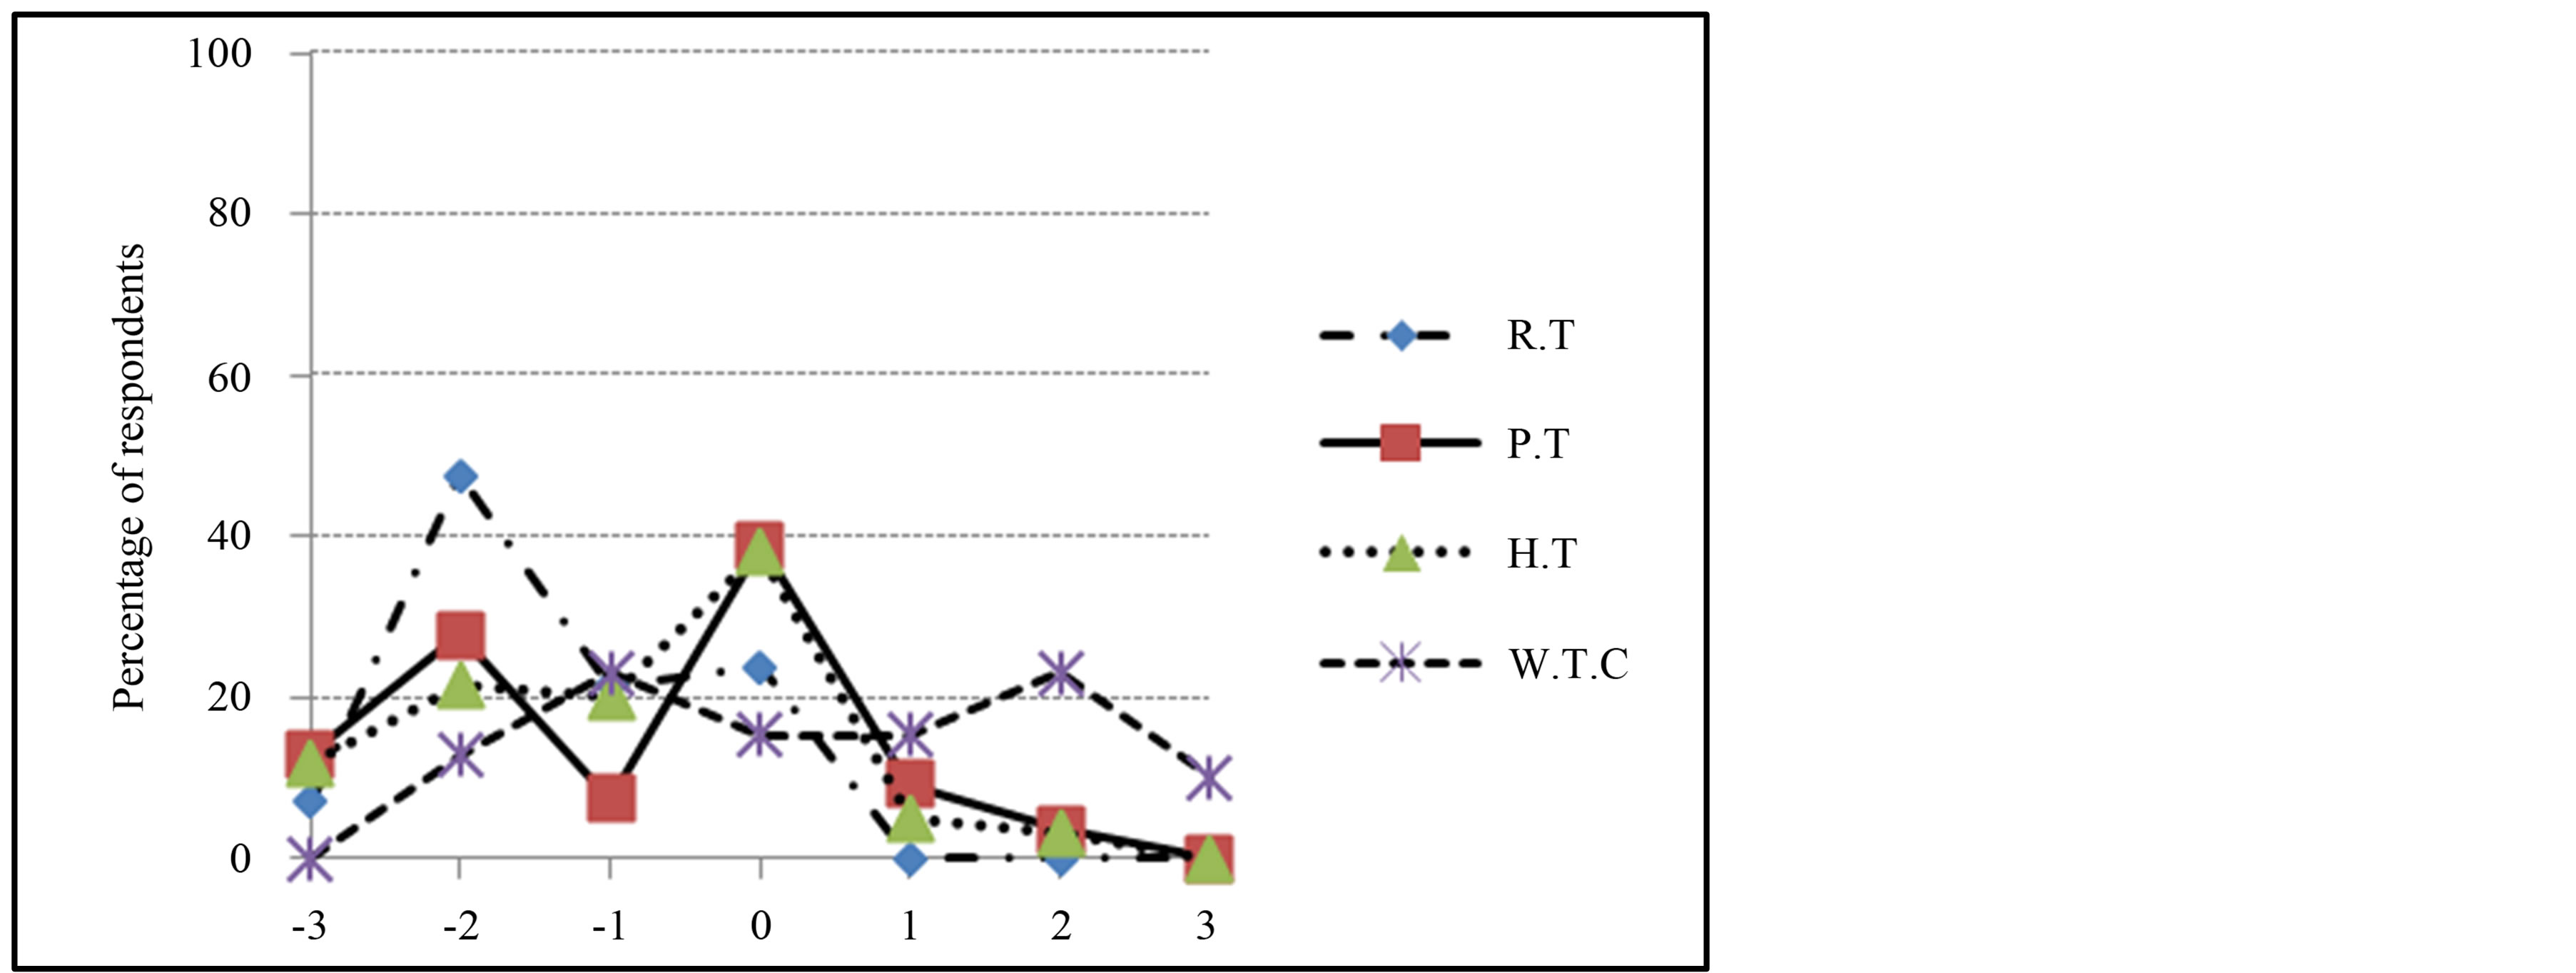
Figure 3. Respondents thermal comfort levels in the buildings.
Further studies should however be conducted to ascertain the reliability of the PMV-PPD to predict the thermal sensation within offices spaces.
Best practices that will lead to the efficient use of air-conditions should be looked into.
References
- Budaiwa, I.M. (2006) An Approach to Investigate and Remedy Thermal-Comfort Problems in Buildings. Building and Environment, 42, 2124-2131. www.Sciencedirect.com
- American Society of Heating, Refrigerating and Air-Conditioning Engineers (ASHRAE) (2004) Standard 55-2004 & Standard 55-1992, Thermal Environmental Conditions for Human Occupancy. ASHRAE, Atlanta.
- ISO 7730 (2005) Moderate Thermal Environments—Determination of the PMV and PPD Indices and Specifications for Thermal Comfort. 2nd Ediyion, International Organization for Standardization, Geneva.
- Charles, K.E. (2003) Fanger’s Thermal Comfort and Draught Models. Institute for Research and Construction. IRC- RR-162, Institute for Research in Construction, Ottawa.
- Szokolay, S. (2004) Introduction to Architectural Science: The Basis of Sustainable Design. Architectural Press, Oxford, 17.
- Ealiwa, M.A., Taki, A.H, Howarth, A.T. and Sedan, M.R. (2001). An Investigation into Thermal Comfort in the Summer Season of Ghadames, Libya. Building and Environment, 36, 231-237. http://dx.doi.org/10.1016/S0360-1323(99)00071-2 www.elsevier.com/locate/buildenv
- Hyde, R. and Sabarinah, S.A. (2008) Bioclimatic Housing, Innovative Designs for Warm Climates. Earthscan, UK & USA.
- Humphreys, M.A. and Nicol, J.F. (2002) The Validity of ISO-PMV for Predicting Comfort Votes in Everyday Thermal Environments. Energy and Buildings, 34, 667-684. http://dx.doi.org/10.1016/S0378-7788(02)00018-X
- American Society of Heating, Refrigerating and Air-Conditioning Engineers (ASHRAE) (2001) Thermal Comfort. In ASHRAE Handbook: Fundamentals, ASHRAE, Atlanta, 8.1-8.29.
- Fanger, P.O. (1970) Thermal Comfort. Danish Technical Press. Copenhagen.
- de Dear, R., Fountain, M., Popovic, S., Brager, G. and Arens, E. (1993) A Field Study of Occupant Comfort and Office Thermal Environments in a Hot-Humid Climate. Final Report, ASHRAE RP-702, American Society of Heating, Refrigerating and Air-Conditioning Engineers, Atlanta.
- de Dear, R.J. and Brager, G.S. (2002) Thermal Comfort in Naturally Ventilated Buildings: Revision to ASHRAE Standard 55. Energy and Buildings, 34, 549-561. http://dx.doi.org/10.1016/S0378-7788(02)00005-1
- Morgan, C.A., De Dear, R. and Brager, G. (2002) Climate, Clothing and Adaptation in the Built Environment. In: Levin, H., Ed., Indoor Air 2002: The 9th International Conference on Indoor Air Quality and Climate, Monterey, 30 June-5 July 2002, 98-103.
- Nicol, F.G. (2001) Characterising Occupant Behaviour in Buildings: Towards a Stochastic Model of Occupant Use of Windows, Lights, Blinds, Heaters and Fans. Proceedings of 7th International IBPSA Conference, Rio de Janeiro, 13-15 August 2001, 1073-1078.
- Brager, G.S. and De Dear, R.J. (1998) Thermal Adaptation in the Built Environment: A Literature Review. Energy and Buildings, 27, 83-96.
- Oseland, N.A. (1995) Predicted and Reported Thermal Sensation in Climate Chambers, Offices and Homes. Energy and Buildings, 23, 105-115. http://dx.doi.org/10.1016/0378-7788(95)00934-5
- Beizaee, A., Firth, S.K., Vadodaria, K. and Loveday, D. (2012) Assessing the Ability of PMV Model in Predicting Thermal Sensation in Naturally Ventilated Buildings in UK. 7th Windsor Conference: The Changing Context of Comfort in an Unpredictable World, Windsor, 12-15 April 2012, Network for Comfort and Energy Use in Buildings, London. http://nceub.org.uk
- Hong, S.H., Gilbertson, J., Oreszczyn, T., Green, G., Ridley, I and the Warm Front Study Group (2009) A Field Study of Thermal Comfort in Low-Income Dwellings in England Before and After Energy Efficient Refurbishment. Building and Environment, 44, 1228-1236. http://dx.doi.org/10.1016/j.buildenv.2008.09.003
- Han, J., Zhang, G., Zhang, Q., Zhang, J., Liu, J., Tian, L., Zheng, C., Hao, J., Lin, J., Liu, Y. and Moschandreas, D.J. (2007) Field study on Occupants’ Thermal Comfort and Residential Thermal Environment in a Hot-Humid Climate of China. Building and Environment, 42, 4043-4050. http://dx.doi.org/10.1016/j.buildenv.2006.06.028
- Adebamowo, M.A. and Akande, O.K. (2010) Indoor Thermal Comfort for Residential Buildings in Hot-Dry Climate of Nigeria. http://nceub.org.uk
- Heidari, S. and Sharples, S. (2002) A Comparative Analysis of Short-Term and Long-Term Thermal Comfort Surveys in Iran. Energy and Buildings, 34, 607-614. http://dx.doi.org/10.1016/S0378-7788(02)00011-7
- Auliciems, A. (1981) Towards a Psycho-Physiological Model of Thermal Perception. International Journal of Biometeorology, 25, 109-122. http://dx.doi.org/10.1016/S0378-7788(02)00011-7
- Al-Najem, A.A. (2010). The Effects of Orientation, Ventilation and Varied WWR on the Thermal Performance of Residential Rooms in the Tropics. http://www.ccsenet.org/journal/index.php/jsd/article
- Stein, B. and Reynolds, J.S. (2000) Mechanical and Electrical Equipment for Buildings. Ninth Edition, John Wiley and Sons, Inc., New York, 455-475.
- Koranteng, C. and Abaitey, E.G. (2010) The Effects of Form and Orientation on Energy Performance of Residential Buildings in Ghana, Journal of Science and Technology, 30, 71-81.
- Chenvidyakarn, T. (2007) Passive Design Techniques for Thermal Comfort in Hot Humid Climate. www.shibaura-it.ac
- Sumanon, R. (2004) The Unique Angle of Roof Slope Effecting Thermal Comfort in the Traditional Thai House. http://www.arquitecturatropical.org.pdf
- Wagner, A., Gossauer, E., Moosmann, C., Gropp, T. and Leonhart, R. (2007) Thermal Comfort and Workplace Occupant Satisfaction—Results of Field Studies in German Low Energy Office Buildings. Energy and Buildings, 39, 758- 769. http://dx.doi.org/10.1016/j.enbuild.2007.02.013 www.sciencedirect
- Koranteng, C., Nyame-Tawiah, D. and Quansah, E. (2011) A Psychometric Analysis of Thermal Comfort in Low-Rise Office Buildings in Ghana. Journal of Science and Technology, 31, 76-88.
- Koranteng, C. and Mahdavi, A. (2010) An Enquiry into the Thermal Performance of Five Office Buildings in Ghana. 10th Revha World Congress on Sustainable Energy Use in Buildings (CLIMA 2010), Antalya, 9-12 May 2010.
- Daghigh, R., Adam, N.M., Sopian, K. and Sahari, B.B. (2009) Thermal Comfort of an Air-Conditioned Office through Different Windows-Door Opening Arrangements. Building Services Engineering Research and Technology, 30, 49-63. http://dx.doi.org/10.1177/0143624408099448
- Fanger, P.O. (1967) Calculation of Thermal Comfort: Introduction of a Basic Comfort Equation. ASHRAE Transactions, 73, III4.1-III4.20.
- Olesen, B.W. and Brager, G.S. (2004) A Better Way to Predict Comfort. ASHRAE Journal, 46, 20-28. http://www.cbe.berkeley.edu/research
- Xi, T., Li, Q., Mochida, A. and Meng, Q. (2012) Study on the Outdoor Thermal Environment and Thermal Comfort around Campus Clusters in Subtropical Urban Areas. Building and Environment, 52, 162-170. http://dx.doi.org/10.1016/j.buildenv.2011.11.006
- Sabarinah, A. and Steven, S. (2007) The Performance of a Partially Air-Conditioned Apartment Building in Kuala Lumpur. The 24th International Conference on Passive and Low Energy Architecture, Singapore, 22-24 November 2007, 608-614.
- Huang, L., Zhu, Y., Ouyang, Q. and Cao, B. (2012) A Study on the Effects of Thermal, Luminous, and Acoustic Environments on Indoor Environmental Comfort in Offices. Building and Environment, 49, 304-309. http://dx.doi.org/10.1016/j.buildenv.2011.07.022
- Mohammadi, A. (2007) Modeling Occupants’ Control Actions and Their Energy Implications in an Office Building. Institute of Building Physics and Building Ecology. Technology University of Vienna, Austria.
- Yu, J., Yang, C. and Tian, L. (2008) Low Energy Envelope Design of Residential Building in Hot Summer and Cold Winter Zone in China. Energy Build, 40, 1536 -1546. http://dx.doi.org/10.1016/j.enbuild.2008.02.020
- Doherty, T.J. and Arens, E. (1988) Evaluation of the Physiological Bases of Thermal Comfort Models. ASHRAE Transactions, 94, 1371-1385.
NOTES

*Corresponding author.