Open Journal of Statistics
Vol.3 No.6A(2013), Article ID:41364,10 pages DOI:10.4236/ojs.2013.36A003
The Assessment of Localized Clustering of Photovoltaic Plants in Italy: The Role of Financial Incentives
Department of Economics, University “G.d’Annunzio”, Pescara, Italy
Email: *asarra@dmqte.unich.it-nissi@ unich.it
Copyright © 2013 Annalina Sarra, Eugenia Nissi. This is an open access article distributed under the Creative Commons Attribution License, which permits unrestricted use, distribution, and reproduction in any medium, provided the original work is properly cited. In accordance of the Creative Commons Attribution License all Copyrights © 2013 are reserved for SCIRP and the owner of the intellectual property Annalina Sarra, Eugenia Nissi. All Copyright © 2013 are guarded by law and by SCIRP as a guardian.
Received October 23, 2013; revised November 26, 2013; accepted December 4, 2013
Keywords: Renewable Energy Sources; Photovoltaic Power System; Feed-in Tariff; Elliptic Scan Statistics; Localized Cluster
ABSTRACT
In recent years, the rapid growth of renewable energy sources (photovoltaic, biomass, geothermal, wind and hydroelectricity) constitutes a feasible solution for environmental problems created by the present production-consumption energy model. Photovoltaic (PV) is one of the most promising, renewable energy sources with great potential for development. Over the last decade, the diffusion of photovoltaic installations in Italy has recorded a considerable increase, displaying at the same time substantial regional dissimilarities. In this paper, we sustain the hypothesis that the installation of PV plants is first of all driven by the financial incentives granted. Using data for Italian provinces, derived under two different editions of the Energy Account, which represents the current Italian financing mechanism, we apply a statistical cluster detection method (the spatial elliptic scan statistics) to identify differences in the spatial distribution of PV plants, in terms of most concentration, throughout the Italian territory. The focus is on mapping the clusters and checking their spatial stability over time, when different subsidy schemes have been adopted. The evidence shows that in the latest detected clusters there are many Northern Italian provinces, with adverse climate conditions (low global irradiance level, low annual temperatures), which have rapidly taken advantage of incentives for solar energy installations.
1. Introduction
The present energy crisis, arising from the world’s dependence on fossil fuels, has highlighted the need to search for renewable and non polluting sources of energy. In recent decades the renewable energy is extensively recommended by researchers and promoted by governments as a viable solution to the hazard posed to sustainability by greenhouse gas emissions and global climate change [1].
Photovoltaic (PV) power systems, among other renewable sources (biomass, geothermal, wind and hydroelectricity), have a great potential to be widely used. Initially, the photovoltaic technology was regarded as a niche issue and not as a useful tool for sustainable energy production.
Despite a difficult beginning, the installation of PV plants starts becoming a regular practice in urban planning in many developed countries where photovoltaic modules are increasingly common components in the design of buildings.
Over the last decade the PV power systems had a growth rate around 47% [2]. The leaders market in 2011 were Italy, Germany, China, US, France and Japan, with over 1 GW of new capacity installed.
A distinguished characteristic of solar energy is its tendency to be highly site-specific. As a consequence, the specific physical condition of a potential site (i.e. topography, local ecology) affects the overall project design and related economic profitability. Khan [3] summaries this situation in the following statement: “in the development of a renewable power plant, it is the site that choice the project, not the reverse”. Actually, there are not clear rules for site selection.
The process of site selection must take into account multiple constraints in order to maximize output and minimize costs. Indeed, locating optimal sites for the installation of photovoltaic power systems, requires the assessment of some discrimination factors (such as solar irradiance, local climate, topography, proximity to existing roads, grid-connection, financial incentives). Anyway, at the heart of location decision, there are the financial incentives. In particular the feed-in tariff, which are fixed prices which an energy producer is guaranteed to receive per unit of energy produced, are become a worldwide tool to support the development of renewable technologies and increase the installed capacity (see among others, [4-6]). As documented by the European Commission (2008) [7], “the feed-in tariff regimes are commonly the most efficient and effective support schemes for promoting renewable electricity in the European Union”.
However, the reward of a feed-in tariff policy can be structured in various ways, with changing degrees of success [8]. Avril et al. [9] compares the public instruments used in five representative countries (France, Germany, Spain, Japan, US) to support the development of PV plants. That study remarks the importance of feed-in tariff as a tool for a good energy policy along with the necessity to have a well controlled progression of the installed capacity. Italy offers a very attractive support scheme, mixing net-metering (that is the possibility for the users to exchange energy with the local electricity grid) and a well segmented premium feed-in tariff. One peculiarity of Italian PV sector concerns the geographical distribution of PV plants within the territory since substantial regional differences are observed. In this paper, the focus is in identifying differences in the spatial distribution of PV plants over time, in terms of most concentration, throughout the Italian territory, under two different editions of the Energy Account (“Conto Energia”), which represents the current Italian PV technology development public strategy. Throughout this study we support the hypothesis that the financial incentives play an important role in shaping the spatial diffusion of photovoltaic systems in Italy. One way to rigorously quantify the spatial heterogeneity of PV installations is to carry out a spatial cluster detection analysis. To comply with the aim of work, the elliptic scan statistics is employed as an appropriate method for detecting and evaluating spatial clusters. This technique is advocated to attribute statistical significance to results presented in simple cartographic analysis displaying raw data. In this respect, it should be noted that data exploration and visualization are important tools for revealing the structure of data and identifying potential spatial pattern but there are some pitfalls. For instance, a certain degree of random variation is usually observed in data collection and the observed pattern may simply be a consequence of this. Accordingly, to be more reliable in the analysis of spatial distribution of photovoltaic plants, we pursue the aforesaid statistical method for detecting statistically significant spatial clusters. The next step will be to determine if those areas would change for data derived under two temporally lagged PV incentive regimes.
The remainder of this paper is organized as follows.
In Section 2 we give a brief overview of the photovoltaic sector in Italy, with particular regard to the Italian financing mechanism (the Energy Account). The methodology of the reviewed cluster detection approach will be discussed in Section 3; data and empirical results are presented in Section 4. Finally, some conclusions are formulated in Section 5.
2. An Overview of Photovoltaic in Italy
2.1. Regional Distribution of PV Plants in Italy
In Italy there is a motivated background for using solar energy on urban scale. First of all, Italy imports about 80% of primary sources in form of fossil and the urban areas, where almost the 80% of inhabitants live, are responsible for 40% of all CO2 production [10].
Furthermore, Italy is well-placed to benefit from the successful development of solar energy projects, being characterized by a very high irradiation level: up to 30% higher than Central Europe, which translates into increased productivity and remuneration of the plant.
Italy can rely on annual daily average of about 4 - 5 daylight hours. The optimal orientation is towards the South of Italy (see Figure 1) along with an inclination of about 30 - 35 degrees. In recent years the growth in the number and power of photovoltaic systems took place at considerable rates.
According to GSE (Gestore Servizi Elettrici), which is a company wholly owned by the Italian Government and involved in promotion, support and development of renewable energy sources in Italy, the major number of PV plants, also in terms of overall installed power, are predominantly in the North of Italy; in the South the most virtuous regions are Puglia and Sicilia [11]. At the end of 2011 PV systems installed in Italy were 330,196 with a gross maximum capacity amounted to 12,773 MW. In 2011, over the previous year, there was an increase in number (+112%) and power (+268%) in all regions. The number of plants went from a +65% of Liguria a +206% in Molise and from +77% in Trentino Alto Adige to a +636% in Molise in terms of power installed.
In absolute terms, the Lombardia region has the largest number of plants with 48,692, followed by Veneto with 44,997. Puglia is the Italian region with the largest installed capacity (2186 MW) followed at a distance from Lombardia (1322). Therefore the power has increased more than proportionally to the number of installations, as it came into action plants of a larger size. This
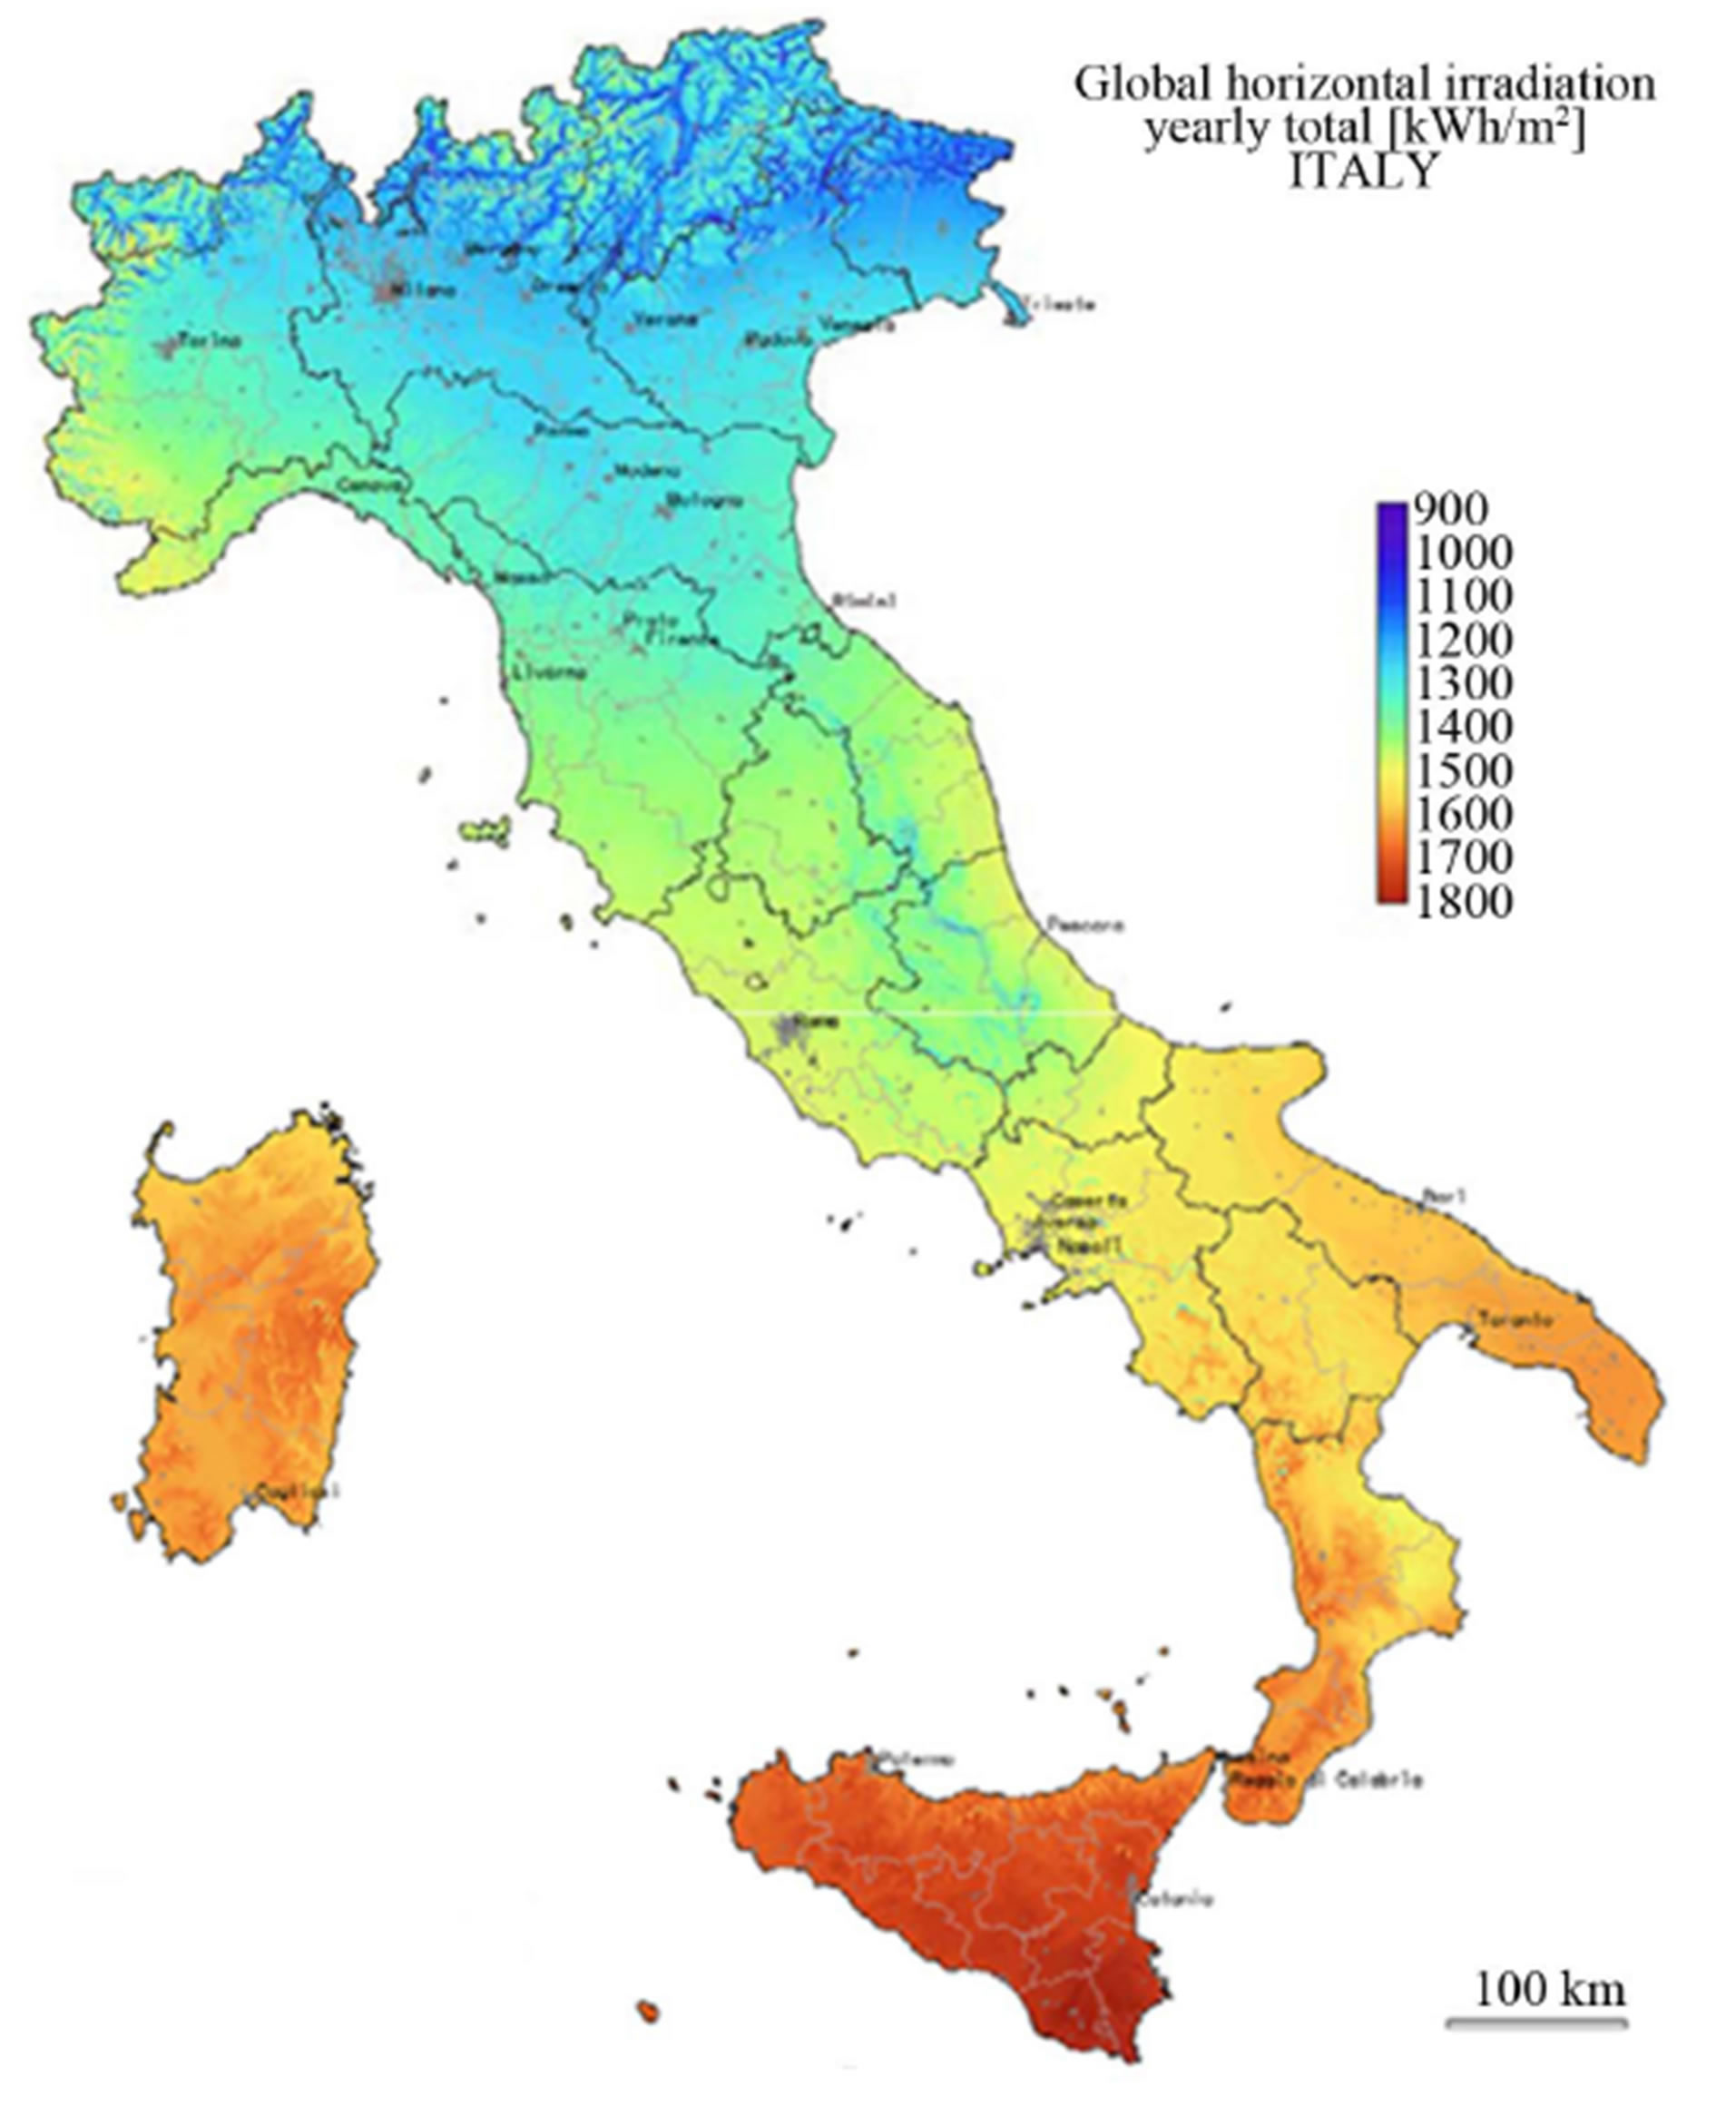
Figure 1. Global horizontal irradiation yearly total (Source: European Commission: Joint Research Centre Institute for Environment and Sustainability).
phenomenon is particularly evident at the end of 2011 when the average size of the park of PV systems grows up to 38.7 kW [11]. Table 1 displays the total number of PV plants along with the overall power installed at the end of April 2012. A simple cartographic map of the regional distribution of PV plants is given in Figure 2.
The park of PV systems is mainly constituted of plants stimulated through the financial support instruments whereas the other plants, installed before the advent of the incentives, represent a minority.
2.2. Italian PV Incentive Regimes: The Energy Account
Here, we give a brief overview of the Italian relevant legislation regarding incentives for the production of electricity by photovoltaic plants. In Italy the first experience of financing method, leading to a primary diffusion of photovoltaic technology, was the National Photovoltaic Rooftops (Tetti Fotovoltaici) programme. This project, funded by the ministry of the Environment and Land Protection, started in 2001, to promote the development of small grid connected plants (nominal power from 1 to 20 kW), integrated in buildings (roofs, façade and other elements, such as urban infrastructures). The financial support was provided by a grant in aid to the initial investment up to 70% of the eligible cost of the
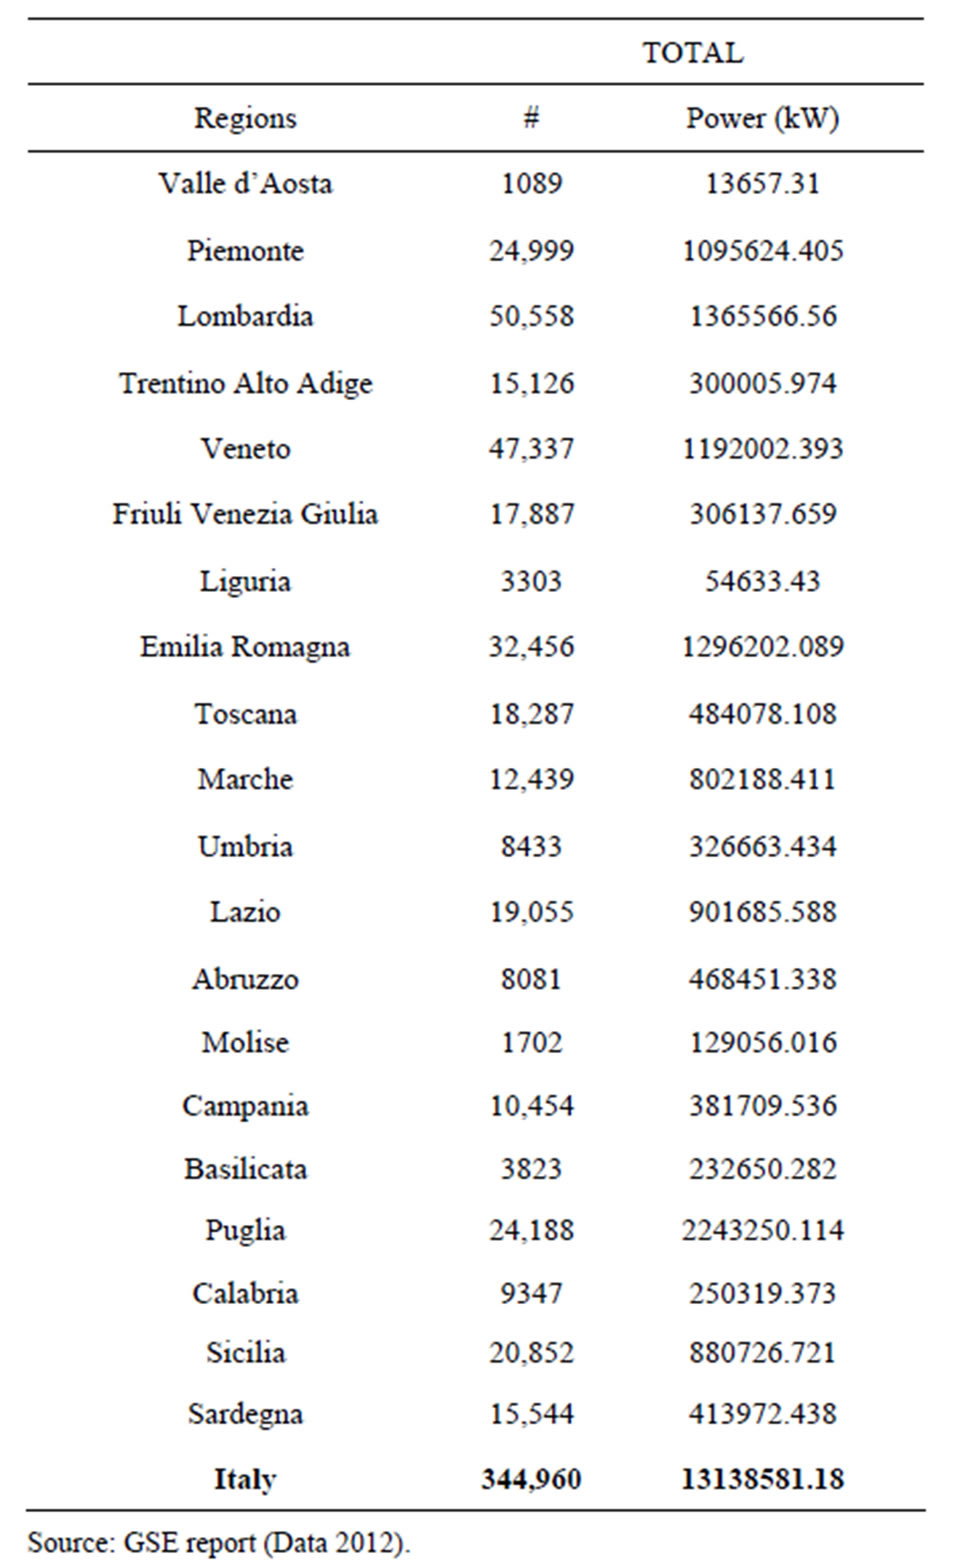
Table 1. Regional distribution and power plants.
plant. This subsidy scheme faced a lot of difficulties, mainly due to the lack of preparation with respect to the application of an innovative technology like photovoltaic as well as enduring bureaucratic delays, especially at regional level. As a consequence, the “Rooftops programme” experienced a rather slow growth and by the end of 2005, only over 14 MW out of the anticipated 21 MW had been installed. Nevertheless, that project had the merit to promote and develop the interest for a market which was unknown. Subsequently, a feed-in tariff system (the so-called Energy Account) was introduced in Italy to promote the production of electricity from renewable sources. The basic idea behind a feed-in tariff scheme is simple: the investor is guarantee to receive a certain price for each kWh fed into the grid over a fixed period of time [12]. In Italy the tariff consists of two separate payments: a certain tariff (premium) for the electricity produced by PV plant over a fixed period of time (defined for twenty years and annually revised), and
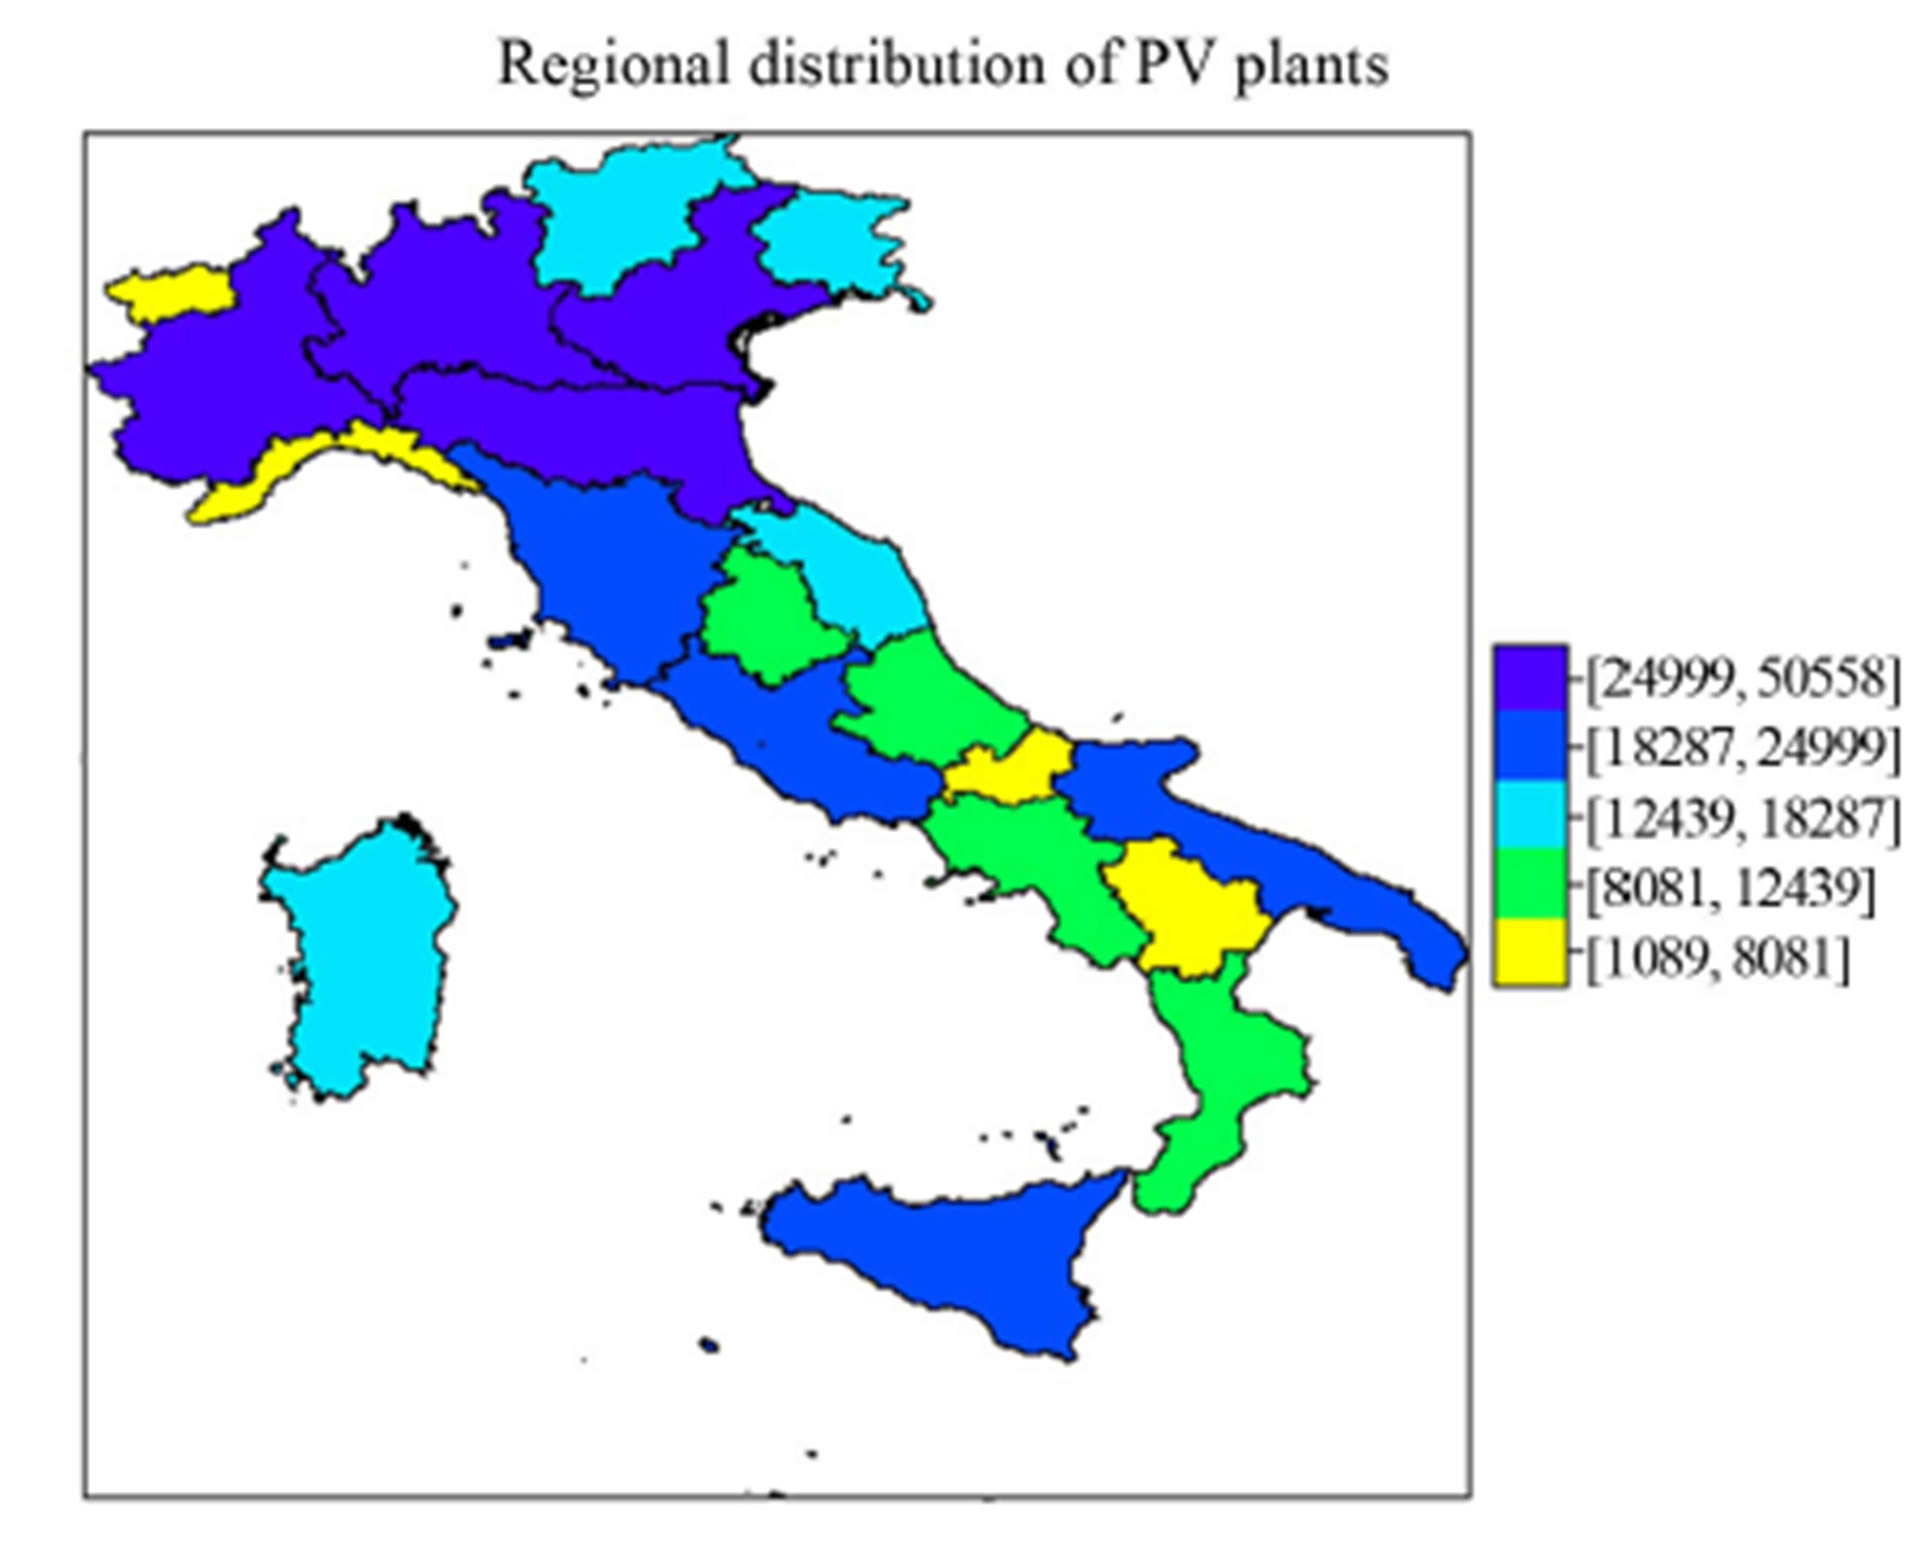 (a)
(a)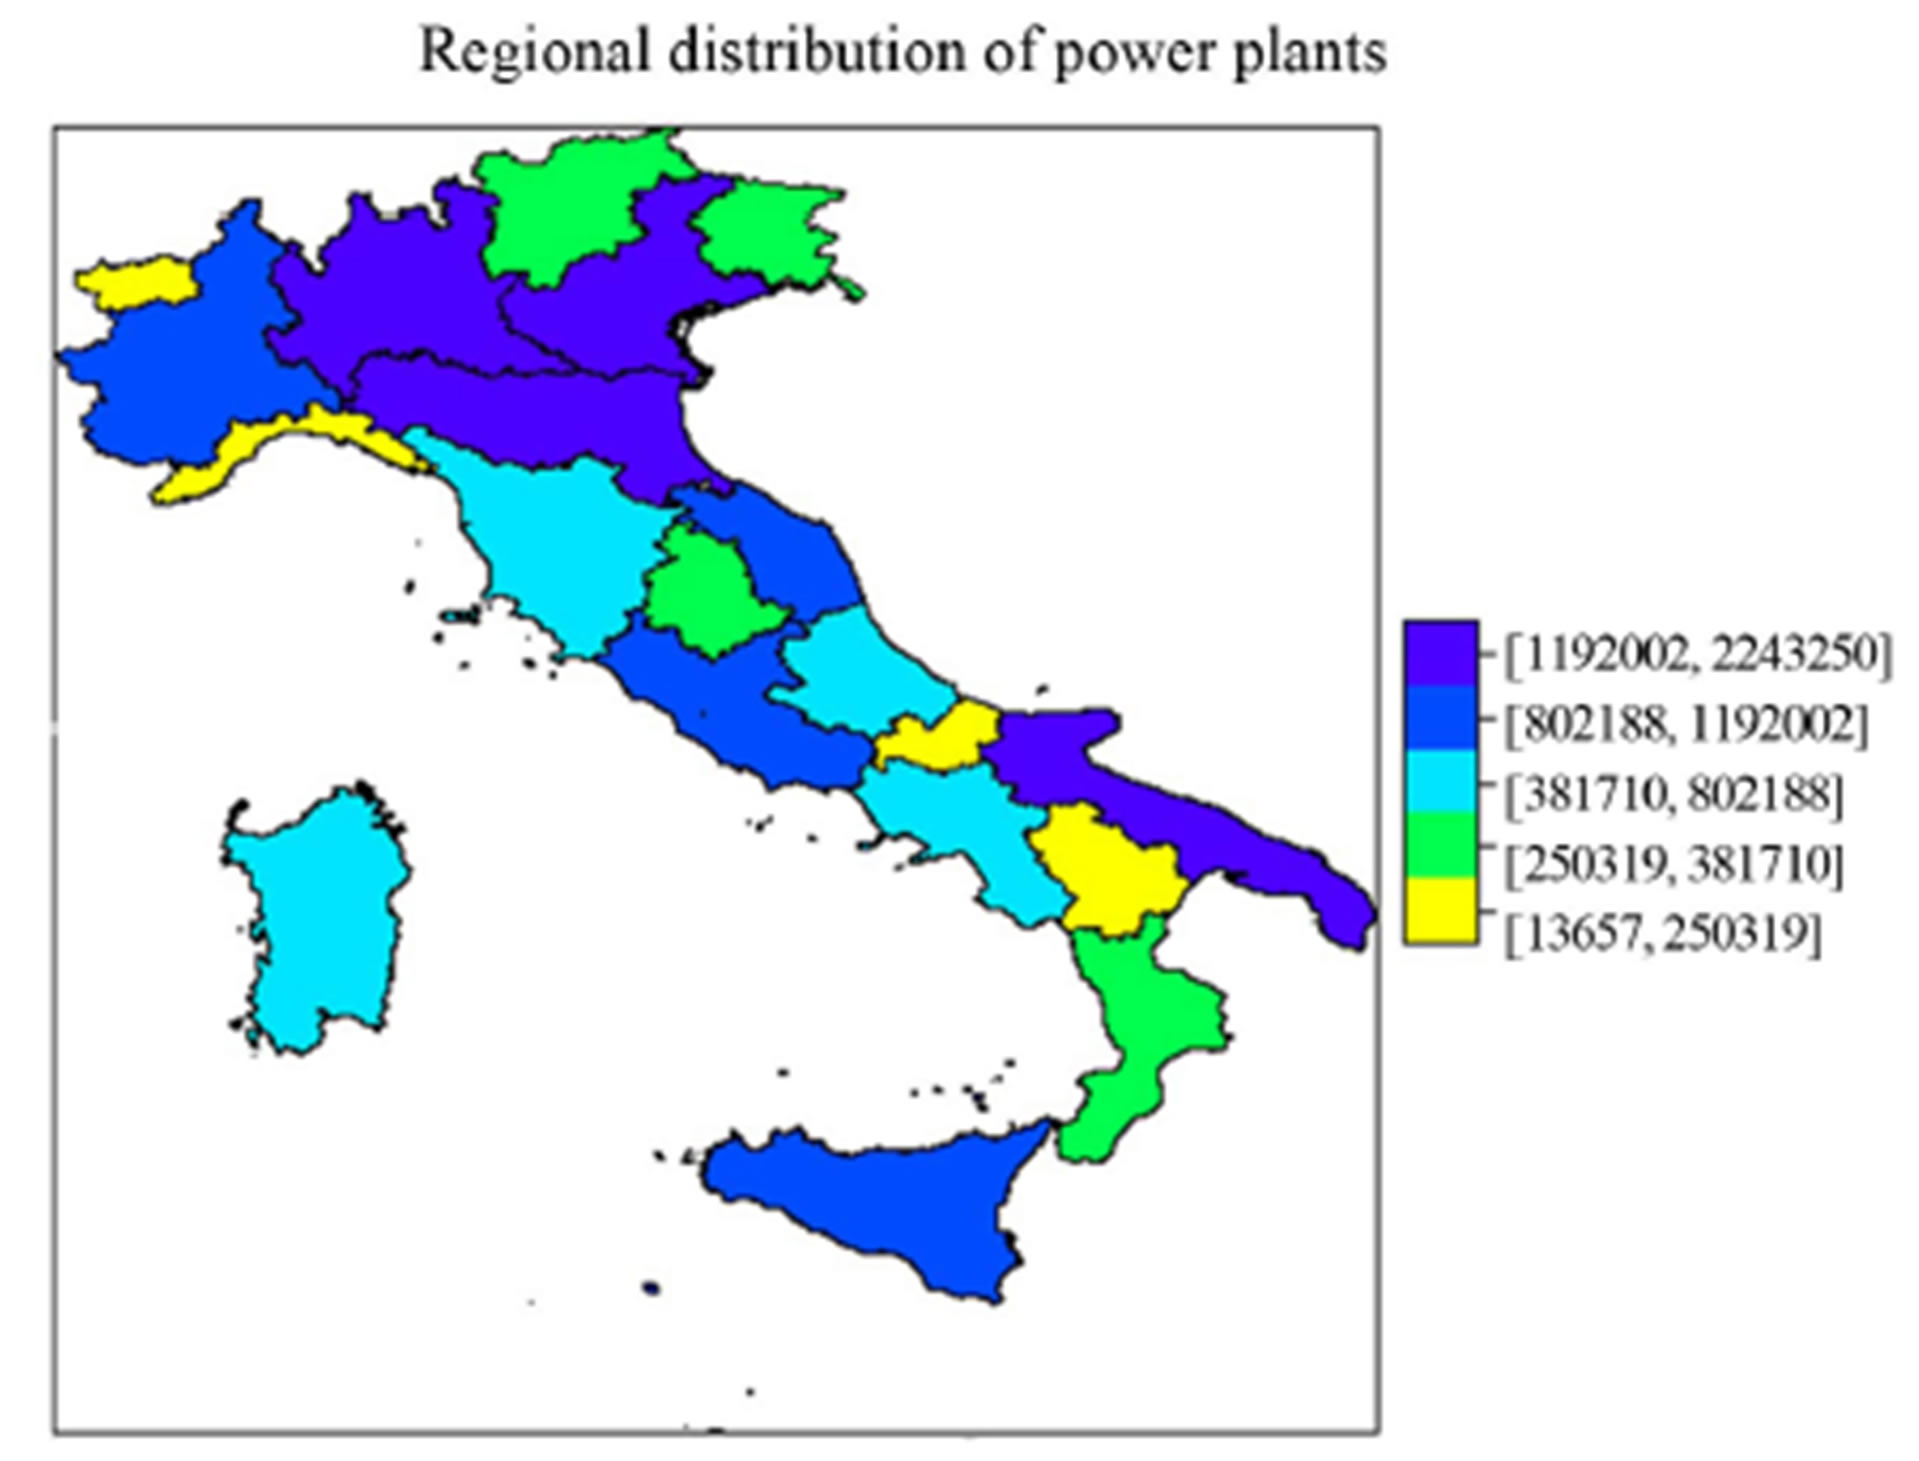 (b)
(b)
Figure 2. (a) Regional distribution in terms of number of PV plants; (b) Regional distribution in terms of installed power.
the value of electricity produced which can either be used on “Net metering” or sold to the local utility grid (at the current market price). Under the net metering service, producers/users may inject into the grid the electricity that they generate on site but do not consume immediately and withdraw from the grid, part or all of the electricity that they need at a different time. Tariffs depend on size and level of building integration of PV plant. The first edition of the subsidizing scheme had specifically defined the level of building integration according to three different degree of implementation: integrated (if PV plants replace architectural elements or roofs of the buildings they are intended for), partly integrated (if PV plants are installed on flat roofs or parts of the buildings without substituting any part of them), not integrated plants (if systems not belonging to the previous mentioned categories), with decreasing tariffs. This incentive mechanism should have lead, as in other countries in which it has been implemented, to a gradual reduction of the costs of systems, to the improvement of the generation efficiency and to a longer life of cycle of systems.
Notwithstanding the numerous requests and the real attractiveness of incentives fees, installations were rather limited and only a fraction of the admitted projects was effectively installed. Reasons for that were administrative barriers: lengthy of bureaucratic procedures for authorization and grid connection. The grid problem is another weak point of photovoltaic market because of the high delays of the distribution energy company in realizing the connection. At the same time, such demand of photovoltaic plants has not been followed by an adequate growth of national PV industry. The situation seems however to be overcome with a new edition of feed-in tariff decree (issued in February 2007), substitutive of the previous one, which has introduced simplified procedures and surmounted most barriers, giving new vitality to the Italian photovoltaic sector and capturing the interest of manufactures, installers, investors and common citizens on the production of electricity energy by means of this technology. Starting from 2007, the solar power installations have increased significantly in Italy, as the result of the activation of updated versions of Energy Account, which had acted as catalyst for the increase in the installed capacity in Italy. The Second Energy Account (2007-2010) was adopted with the objective to stimulate the photovoltaic market by a gradual reduction of the price of photovoltaic modules.
Under this edition it was no longer necessary to wait for the allocation of tariffs by the GSE. The installation of the PV plants was possible once required the connection to the GSE [13]. The Third account Energy changed the classification of photovoltaic systems and assigned to each type a limit for the cumulative power eligible for incentives. The Fourth Energy Account (published in May 2011) redefined the different types of plants, compared with the previous legislation and introduced an increase of 10% of the basic incentives if at least 60% of the investment cost of the plant was due to a production achieved in the European Union. For all plants operating from 2013, the Fourth Energy account provides one overall feed-in tariff scheme that includes both the electricity price and the premium.
However incentives granted under the Fourth feed-in tariff scheme have been significantly reduced compared to those provided under the Third Energy Account. Besides, all incentives granted under the Fourth Energy Account shall be paid for a period of twenty years without inflation adjustments.
In Table 2 we display the tariffs set up with the Fourth Energy Account, differentiated according to the type and size of PV systems.
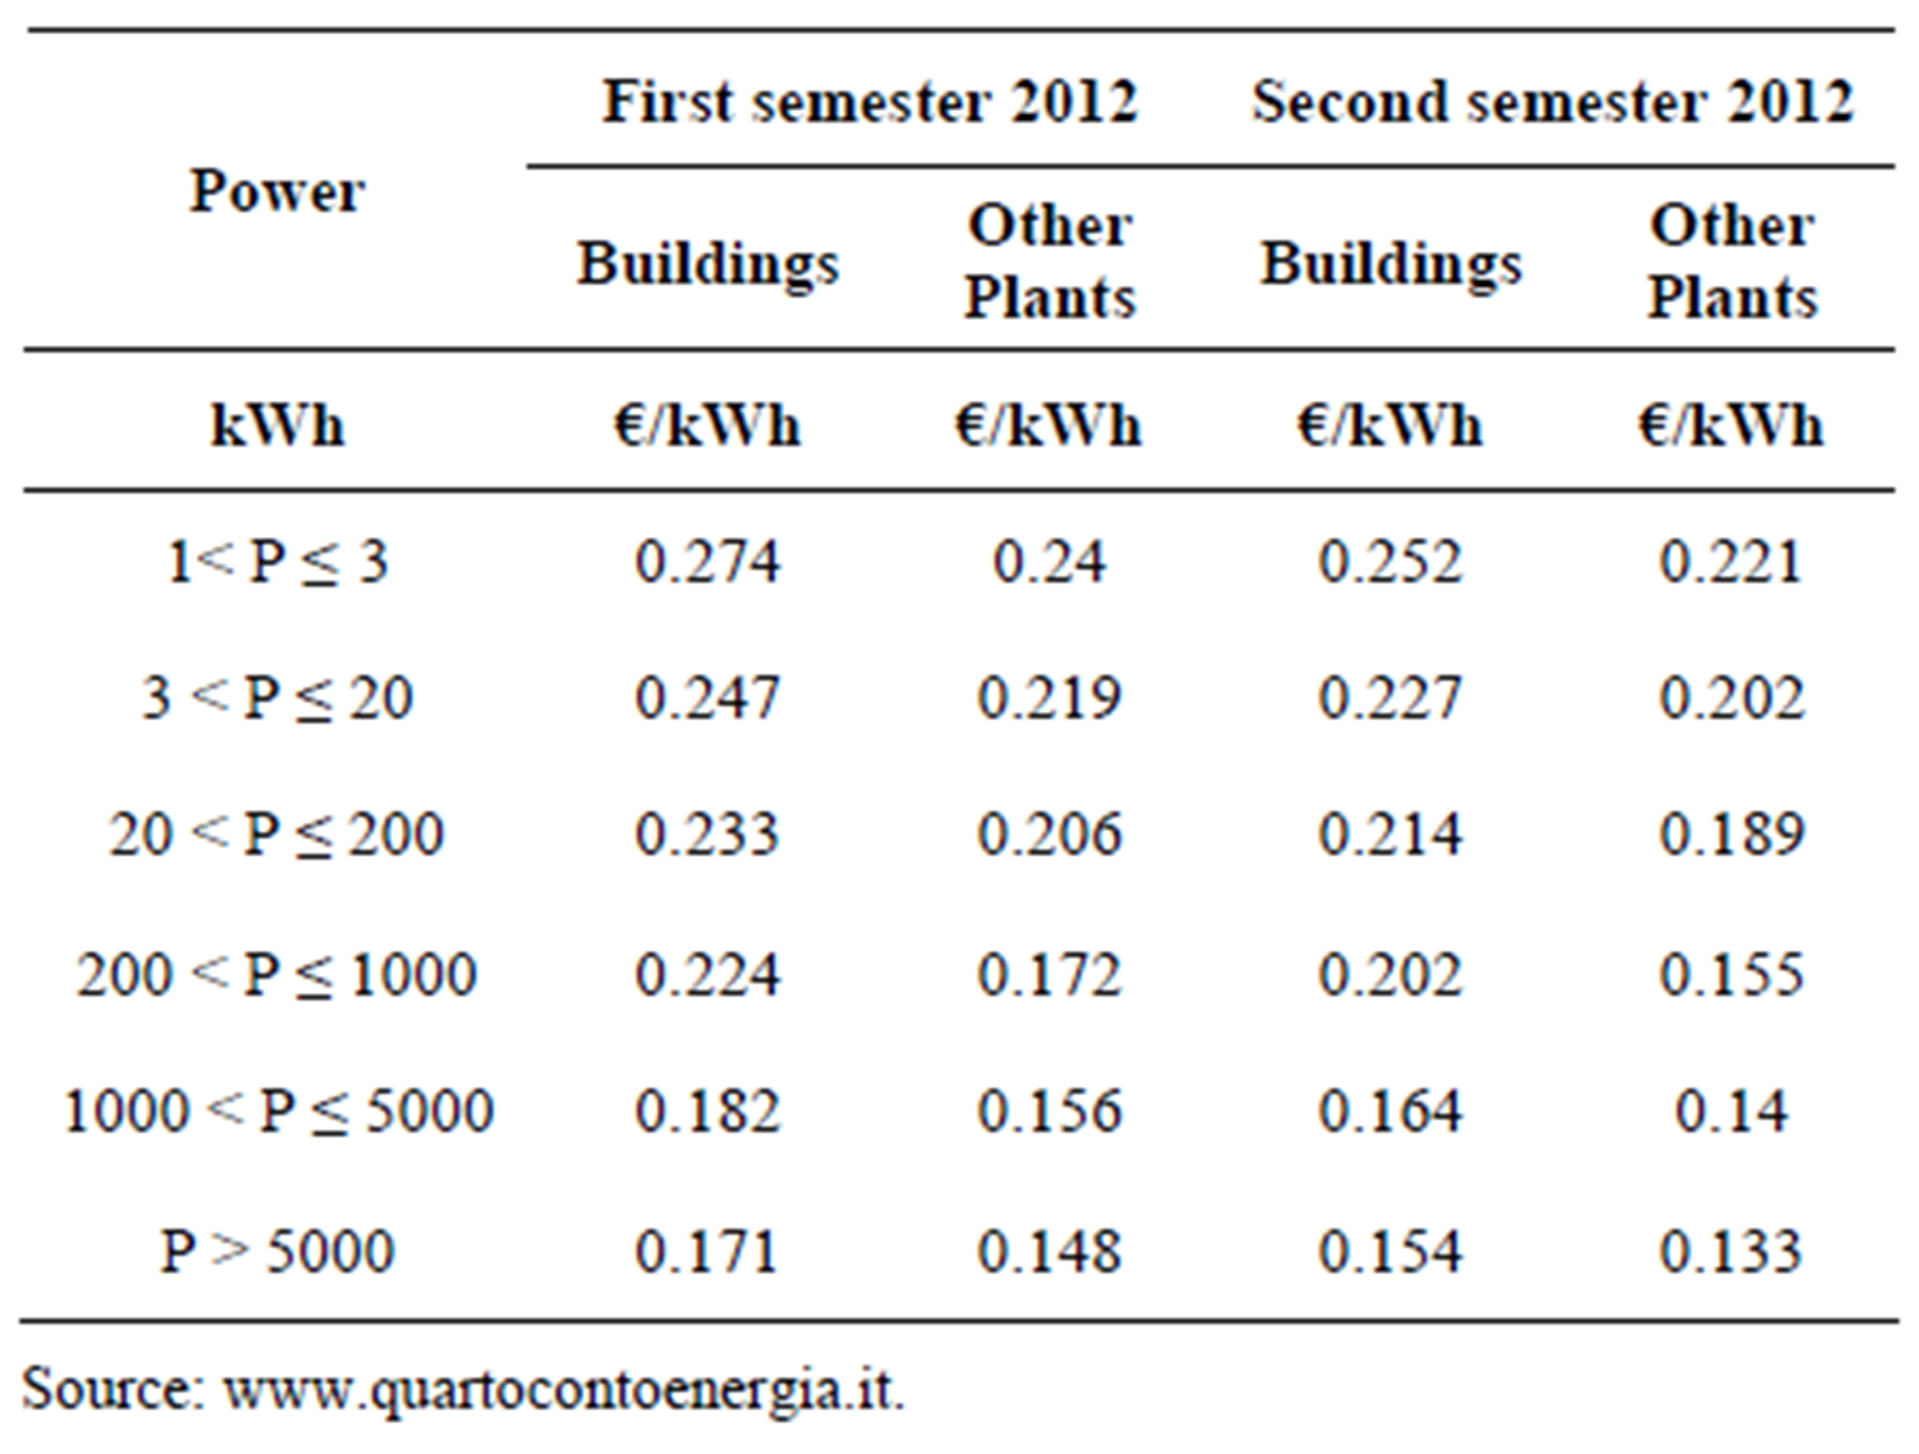
Table 2. Tariffs for small and large PV plants.
3. Statistical Methodology
In this section, we review the statistical framework for the detection of spatial clusters. The question of whether events are clustered in space and/or in time has received considerable attention in literature. Often, most of application of cluster analysis have been confined to the field of epidemiology, where a cluster is defined as an unusual aggregation of health events real or perceived. In the epidemiological context and spatial disease surveillance, methods to locate potential clusters are essentials to provide insight into the etiology of disease, when it has not yet been well established, and early warnings of intentional release of biological and nuclear agents respecttively. Anyway, cluster detection is an important task in a variety of application domains on condition that a cluster detection is carried out with care and scientific rigor. Hence, it is not necessary that the unusual aggregation should be related to health event data: any phenomenon showing geographic (spatial) variability can be subject to cluster detection analysis. Generally, cluster detection methods can clarify if there is a pattern in the examined data and help to gain a better understanding of a geographic phenomenon by an automatic detection of regions of space that are “anomalous”, “unexpected” or otherwise “interesting”. In this study we adopt as cluster detection technique the well-known spatial scan statistics [14,15], which can be adapted to different data types and distributions. Like other approaches, the spatial scan statistics impose circular regions over the study area and then evaluate the significance of the number of cases that fall within each circle. In addition, Kulldorff’s scan statistics solved the problem of multiple hypothesis testing that has plagued previous cluster detection methods (see for example [16] and [17]). In the scan statistics procedure there are two key phases: the identification of the most likely clusters, for which the occurrences of a phenomenon within a region are higher than outside it, and the separation of clusters that are significant from those which occurred by chance. Kulldorff’s scan statistics reduce the problem of cluster detection to a problem of maximum likelihood estimation over geographical space and use a likelihood ratio test statistic whose mathematical formulation depends on the probability model used. Different types of discrete or continuous data can be analyzed, using spatial scan statistics for Bernoulli, Poisson [15], ordinal [18], exponential [19] normal [20] and multinomial [21] models. Poisson models are the most popular models for discrete data. In applications, such as epidemiology, where cases are rare events with respect to total population, the Poisson models are usually assumed. For implementing a typical scan statistic one partitions the study region into a given number of subregions, requiring as input data the number of cases in each area, the total background population as well as the centroid location (i.e. the longitude and latitude coordinates) of each area. Under the null hypothesis we expect that there is no cluster in the study region and the cases in each subregion are uniformly distributed such that the expected number of cases in each area is proportional to its population. In order to establish a framework for statistical testing we used the following notation: let be L(Z) the likelihood under the alternative hypothesis that there is a cluster in zone Z; L0 the likelihood under the null hypothesis;  the expected number of cases inside zone Z under the null hypothesis;
  the actual number of cases inside zone Z and C the total number of cases. In the case of Poisson distributed process, the likelihood ratio takes the following form:
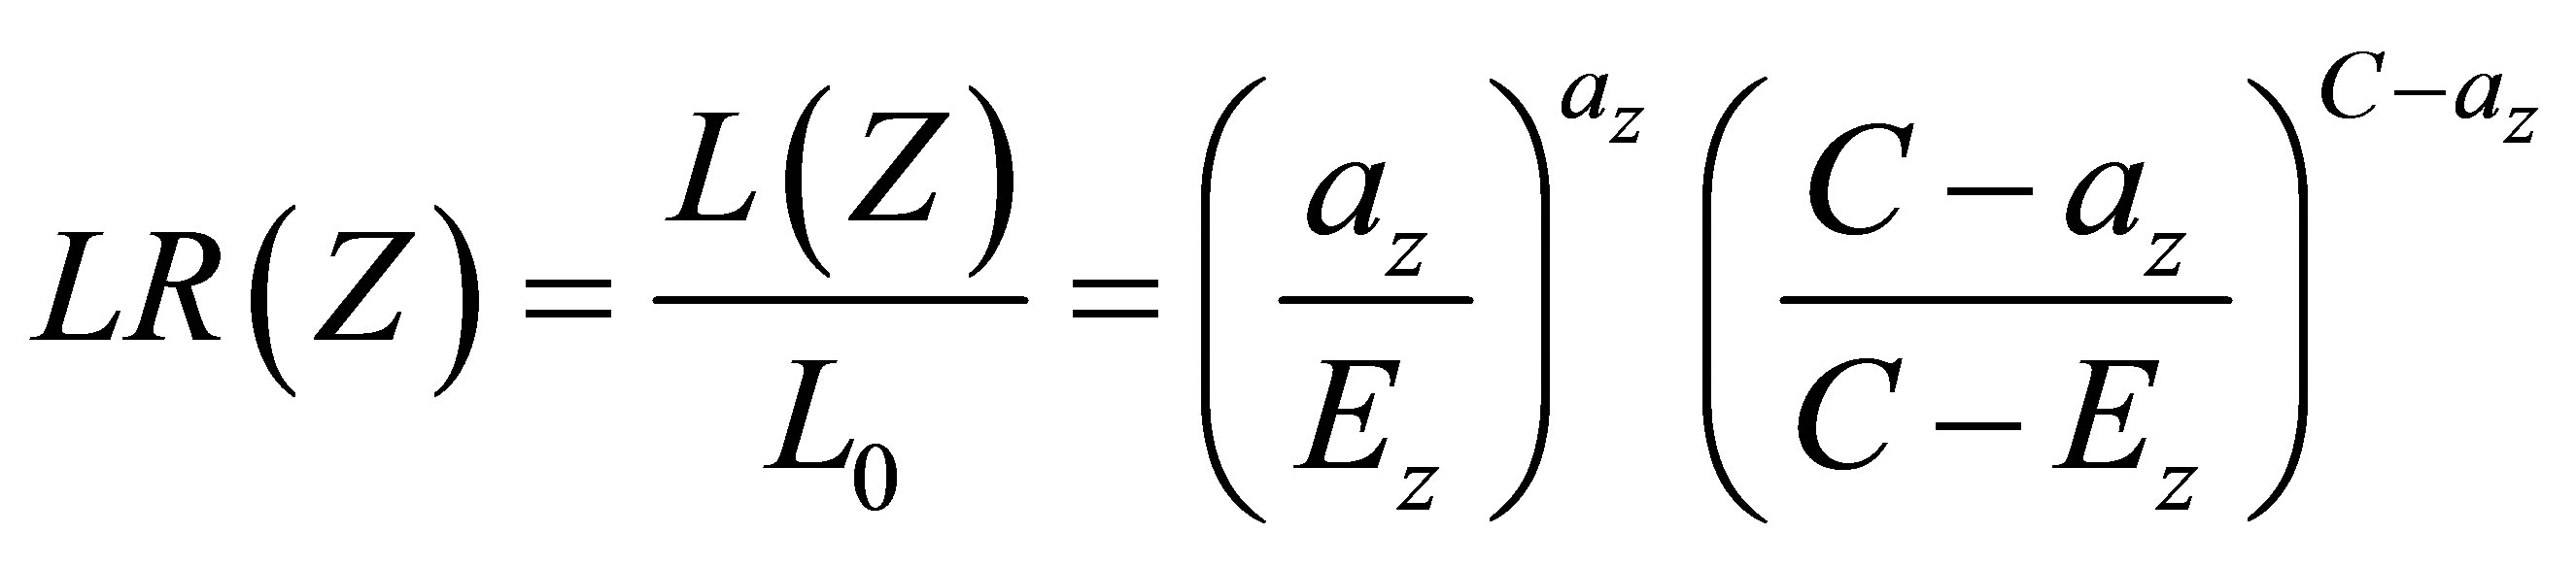 (1)
(1)
when  and one otherwise [15]. The most likely cluster is defined as the set of connected regions that attain the maximum likelihood ratio. A Monte Carlo testing procedure [22] is adopted to evaluate the signifycance of the likelihood-ratio. As previously pointed out, the standard spatial scan statistic uses a circular window to scan the potential cluster areas; as a consequence it has difficulty in correctly identifying actual non circular clusters. Recognizing that in real situations we frequently find spatial clusters with quite different shapes from circular ones, over the last years there have been many modifications to the spatial scan procedure. Several non circular spatial scan statistics have been proposed (see, among others [23-26]. One of the extension of the method considers an elliptic scanning window of variable location, shape, eccentricity and size, with or without a penalty variable. The elliptical version of spatial scan statistic [26] can be viewed as a particular case of the circular one, with the underlying statistical theory, the cluster search and the evaluation of the statistical significance of spatial clusters unchanged compared to the standard case. As known, an ellipse is characterized and identified by the following parameters: the cartesian coordinates of its centroid (x,y), the eccentricity, the angle and the size. The ratio between the semimajor axis and the semiminor axis determines the shape (s) of the ellipse. A ratio equal to 1 identifies a circle whereas values greater than one define an ellipse with a narrow and long shape. The parameter relative to the angle
  of an ellipse is defined through the horizontal line (direction east-west) and the semimajor axis. When the semimajor axis is north-south oriented an angle of 90 degrees is obtained. The shape (s) is related to the eccentricity (e) of ellipse through the formula
 . After setting the parameters, the procedure varies the size of scanning window moving from 0 to an upper limit, fixed a priori, expressed as percentage of population to be integrated in the final cluster, such that at most 50 percent of total population is included within the ellipse. The ability to vary the size of the ellipse is important because we usually do not know the size of the area covered by a cluster [17,27]. In the search stage a range of values for the parameter s are fixed. Usually a valuable collection of ellipse shapes is 1.5, 2, 3, 4, 5, 6. The authors recommend using a number of angles at least three times the value of parameters. We define E(s) as the subset of the collection E that includes all the shapes listed above in this section up to and including s. Hereby, a finite number of overlapping ellipses are considered as candidate cluster area. In order to avoid not interesting spatial aggregation, i.e. to discourage less compact clusters, an eccentricity penalty variable can be introduced. This parameter is defined as
 . The exponent
  is a tuning scalar value and is attached to the penalty function to control its strength. In this respect, we observe that with
  the penalty function is always 1 irrespectively of s, collapsing the strength of penalty; when
  goes to infinity the penalty function goes to 0 for all s > 1, so that only circular clusters are considered. Hence, the log-likelihood function is modified according to the following equation:
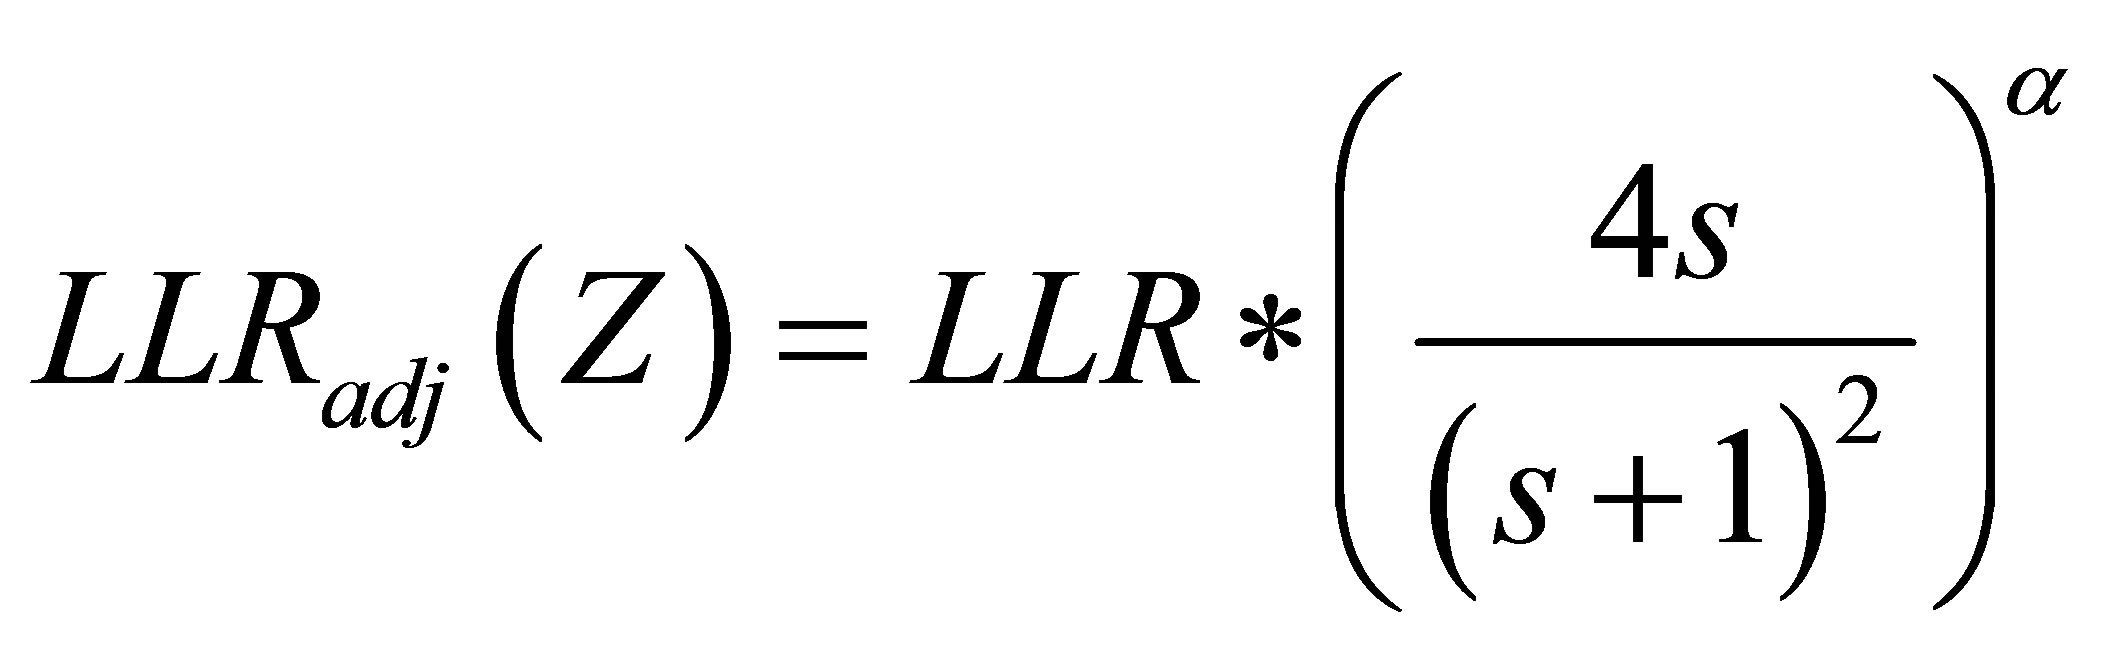 (2)
(2)
where LLRadj is the adjusted log-likelihood ratio, LLR is the original log likelihood ratio. When the cluster search is carried out without an eccentricity penalty, a sensible choice for s is required. In fact a remarkable eccentricity might considerably affect the procedure computational efforts. In an attempt to delineate clusters of PV plants and uncover their geographic location, the elliptic version of Kuldorff’s spatial scan statistic has been adopted as this tool has better power and precision compared with circular version for most of situations [28]. Besides, the elliptical shape more accurately follows certain geographic features. The spatial scan statistic for elliptic scanning window has been implemented into the freely available software SaTScan which can be downloaded from www.satscan.org [29].
4. Application to Photovoltaic Data
The cluster detection method, illustrated in Section 3, is applied to photovoltaic data, derived from two different editions of Energy Account, in order to locate and detect clusters of photovoltaic plants within the Italian provinces (or districts) and check their stability over time, when different incentive systems have been introduced. In particular, we compare data before 2007, drawn from the old incentives scheme, hereafter named “Old Energy Account” and data drawn from the new financing scheme, hereafter named “Fourth Energy Account”. In our study, the photovoltaic plants are distinguished according to their capacity. On this point, we underline that power or capacity of installed PV is measured in kWp (peak kilo Watt). A Wp (peak watt) gives the electric power generated (in watt) by a photovoltaic cell in standard conditions. It is worth noting that 1 kWp of power corresponds indicatively to a surface area of photovoltaic modules of 8 m2. In order to employ the elliptic scan statistic as cluster detection method, we consider the overall number of PV plants as background data, whereas the case data refer to the installations with power exceeding a given kWp threshold. In this respect, plants with overall power greater than 20 kWp, 50 kWp and 100 kWp are in turn considered. Our interest is restricted to large PV systems since they represent the most installed plants over the last years. As previously underlined, the analysis is based on the geographic area of the Italian provinces and all distance measures involved in the method are calculated using the coordinates of the 110 districts’ centroids. Before presenting the results, we wish to point out that this cluster detection analysis requires to limit the dimension of the cluster. The choice of an appropriate cluster size is critical. On one hand, smaller cluster have the advantage to look at a specific neighborhood although they are characterized by a more statistical and spatial uncertainty; on the other hand larger clusters are more robust but provide less geographic information. In the SatScan software the maximum cluster size can be set to any values less than or equal to 50% of total population, named “population at risk”, reflecting the epidemiological origins of the spatial scan statistic. Many times the most likely cluster composition is heterogeneous, blending regions with elevated responses of the phenomenon under study and areas with low occurrences.
To enhance the interpretation of the spatial scan statistic we implement different spatial scans, systematically varying the “population at risk” parameter from 5% to 50%. Clusters were identified by scanning window associated with the maximum likelihood and a likelihoodratio test statistic was calculated.
The p-value of the statistical test is based upon the null distribution of likelihood ratio test statistic obtained with 999 Monte Carlo replications of the data set generated under the null hypothesis.
Through Tables 3 and 4 and Figures 3-5 we are able to highlight the generated spatial scan statistics results and capture discrepancies examining data arising under two different financial regimes.
Tables 3 and 4 summarize several values for the detected PV clusters, differentiating PV plants according to their power.
In addition to the maximum dimension of cluster, population, number of cases, expected cases, relative risk, log-likelihood ratio and p-values are also displayed.
We first look at the detected results for PV plants with overall power greater than 20 kWp, presented in Figures 3(a) and (b).
Visual evidence of non random spatial distribution of PV plants drawn from the Old-Energy Account, shows that the most likely cluster (largest likelihood-statistics) was geographically confined to some Northern-Eastern and Central Italian regions.

Table 3. Elliptic scan results (Data from GSE-report 2007).
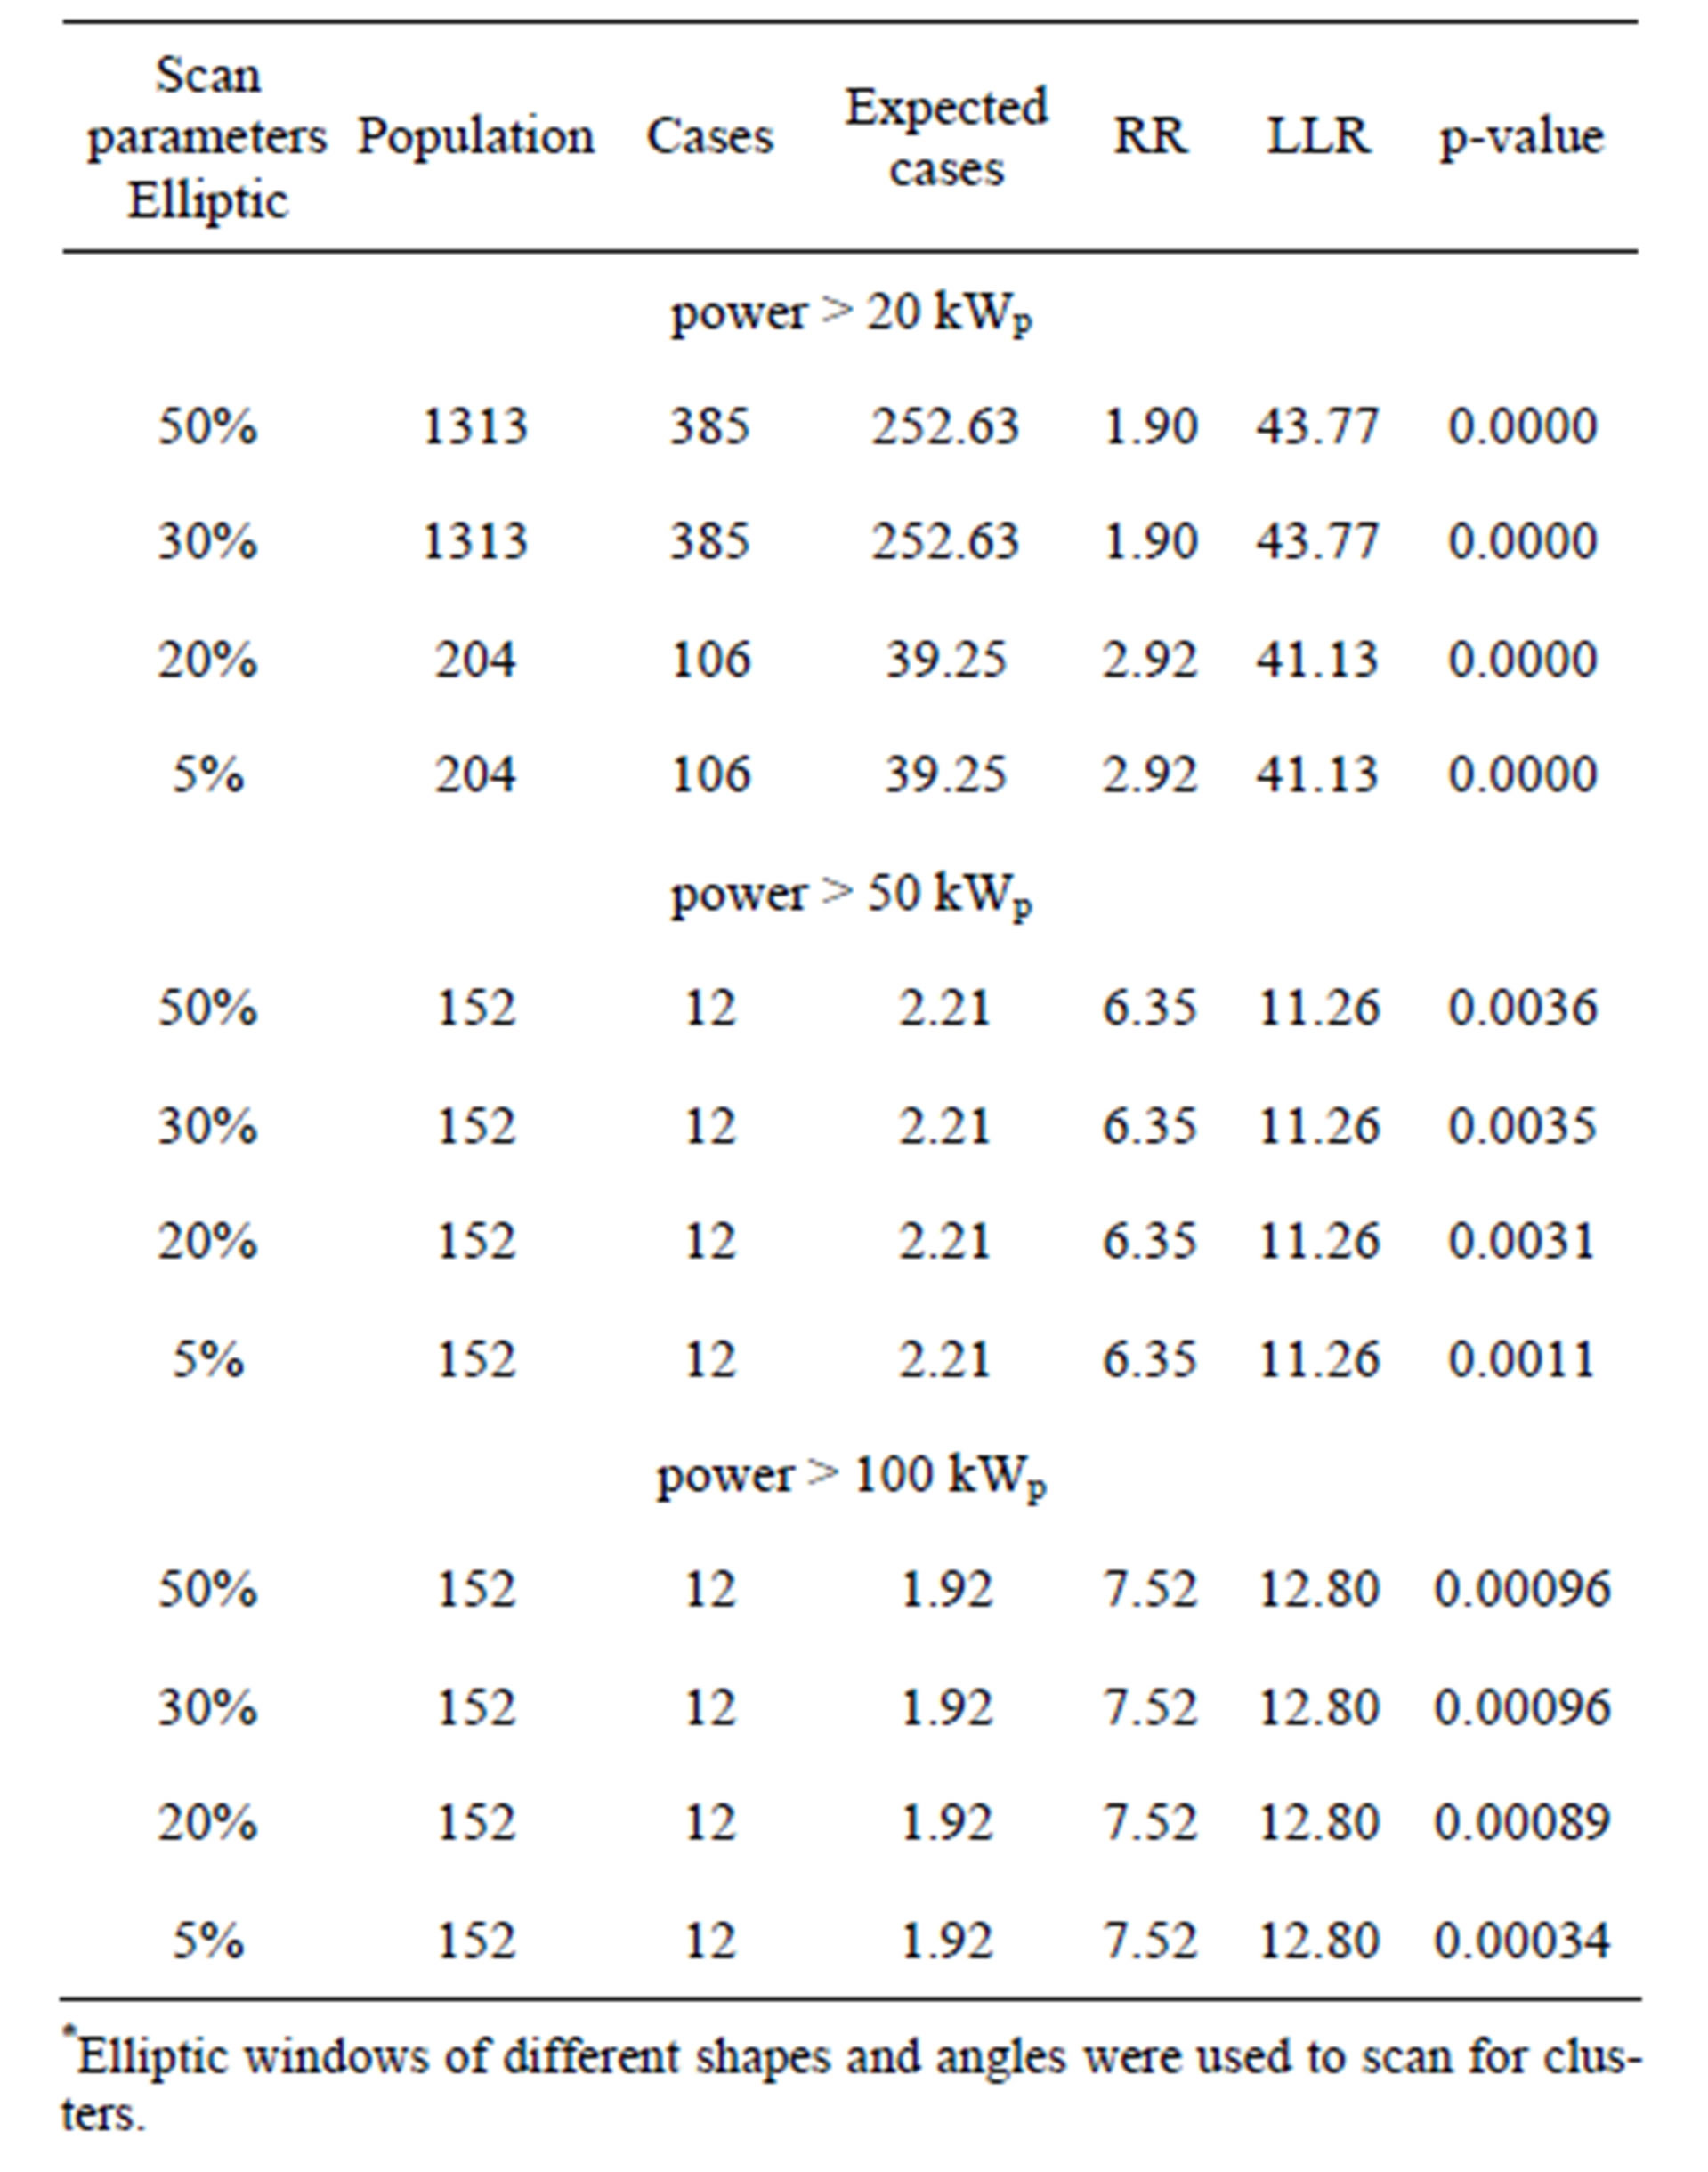
Table 4. Elliptic scan results (Data from GSE-report April 2012).
More specifically, the cluster with the most statistical strength includes some provinces of Trentino-Alto Adige, Veneto, Emilia-Romagna, Toscana, Marche, Umbria and Lazio. Interestingly, when the cluster search process is replicated for the most recent available data, derived from the Fourth Energy Account, we find out that the boundaries of detected cluster are changed.
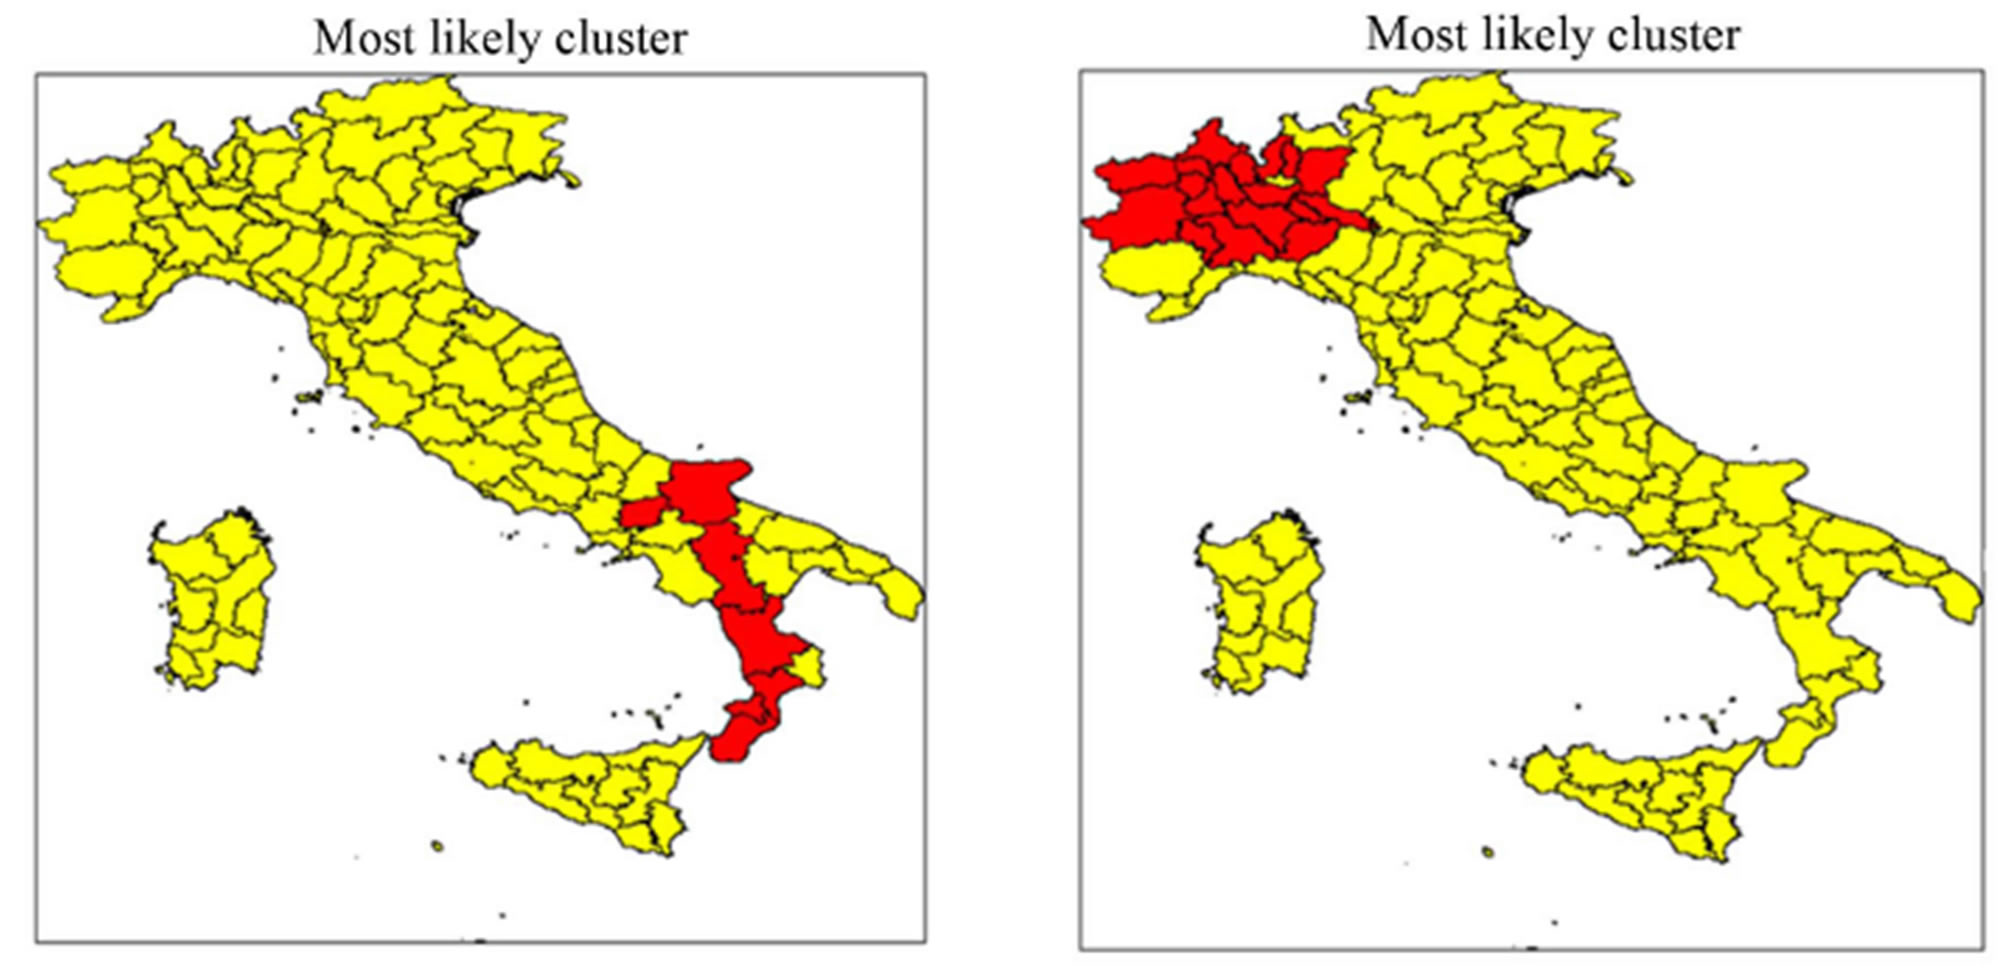
The prevalent cluster occurs at different locations and encompasses districts of Northern-Western regions (Piemonte, Liguria and Lombardia). For the sake of comparison we also performed cluster detection analysis for PV installations with overall power greater than 50 kWp. Results, displayed in Figure 4, clearly indicate that, when data come from the “Old Energy Account”, the most probable cluster, for which the occurrences of phenomenon under study within a region are higher than outside, is located in the South of Italy and consists of provinces belonging to Campania, Puglia, Basilicata and Calabria regions. Change of the data set under study results in the change of statistical significance aggregation of area characterized by a significant level of phenomenon. On inspection of Figure 4(b), it is evident that, according to the scanning method, the regions exhibiting spatial cluster are now located in the Northern Territory. In this case, provinces of Valle d’Aosta, Piemonte and Lombardia appear to be areas of interest.
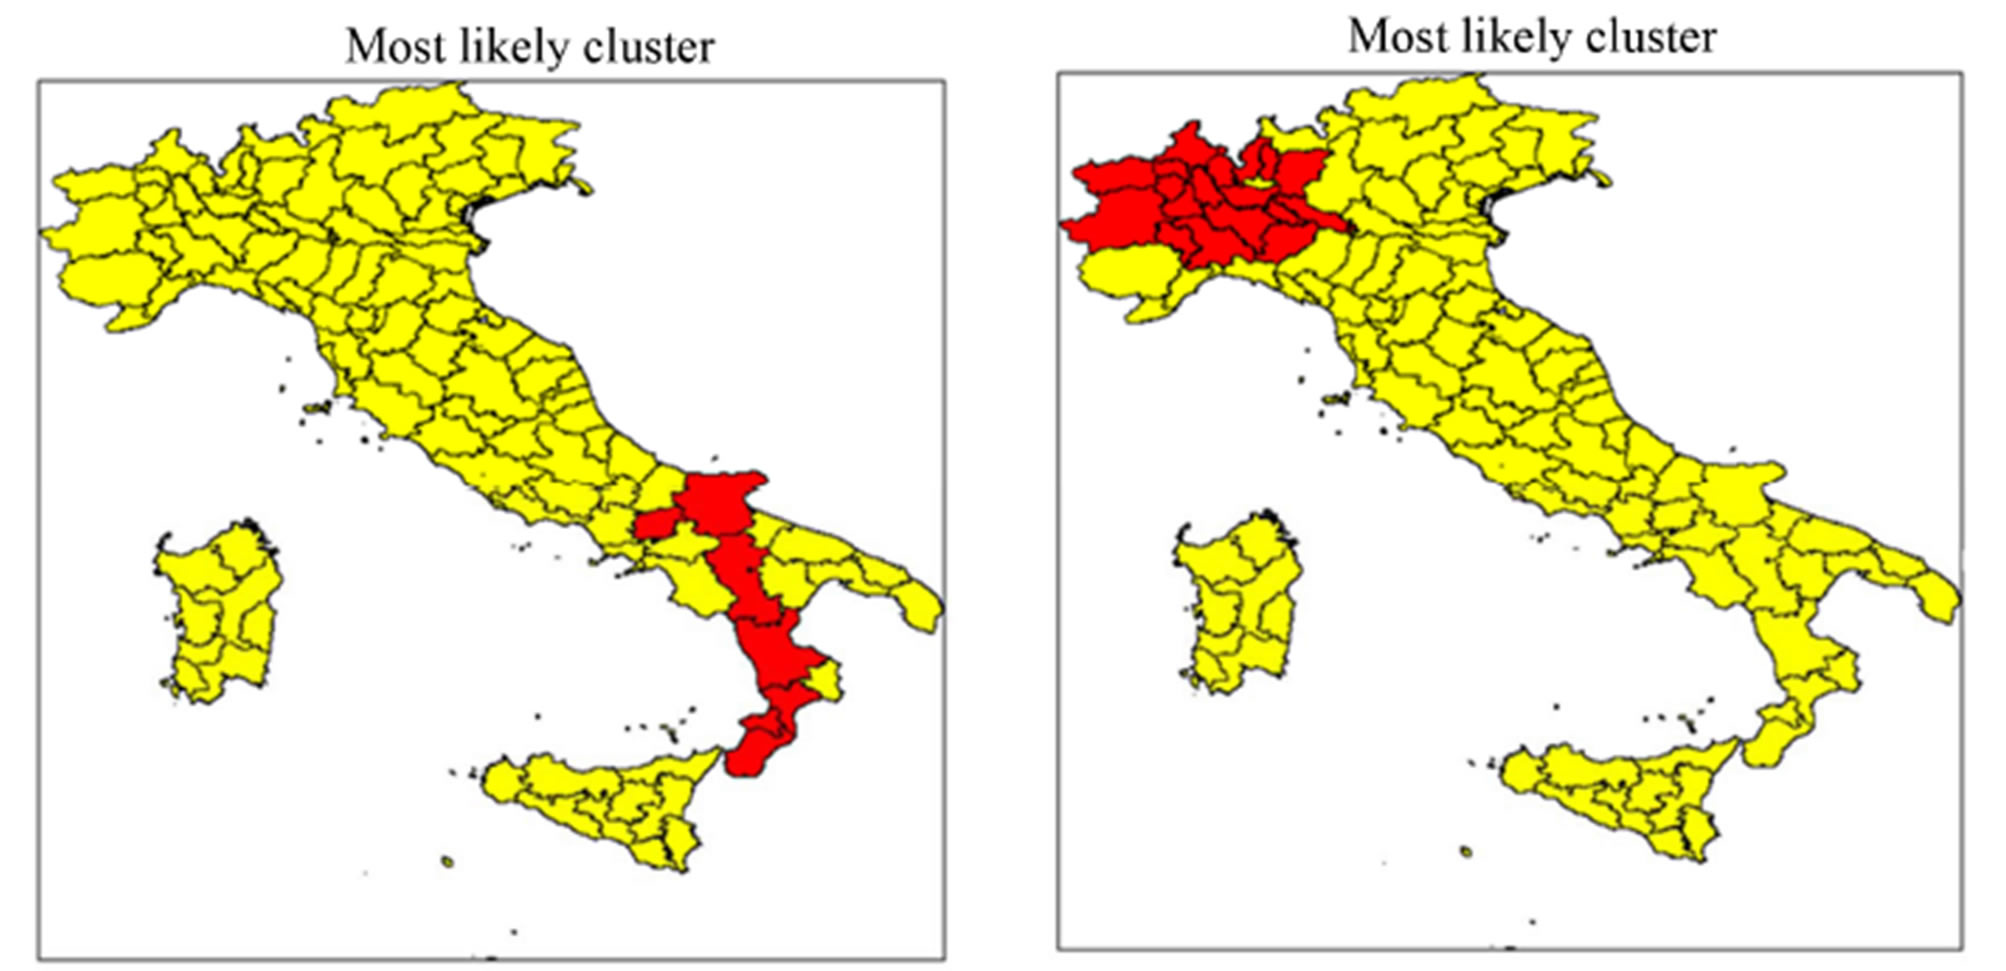
Finally, the same aggregation areas are individuated when the consideration is limited to the biggest PV plants in terms of installed power (PV installations with power
 (a) (b)
Figure 3. (a) Spatial cluster analysis* of PV plants in Italy—threshold value > 20 kWp—data from Old Energy Account; (b) Spatial cluster analysis* of PV plants in Italy—threshold value > 20 kWp—data from Fourth Energy Account. *SaTScan Poisson model using an elliptic scan window with a non compactness penalty, maximum cluster <20% of the background population.
 (a) (b)
Figure 4. (a) Spatial cluster analysis* of PV plants in Italy—threshold value > 50 kWp—data from Old Energy Account; (b) Spatial cluster analysis* of PV plants in Italy—threshold value > 50 kWp—data from Fourth Energy Account. *SaTScan Poisson model using an elliptic scan window with a non compactness penalty, maximum cluster <20% of the background population.
 (a) (b)
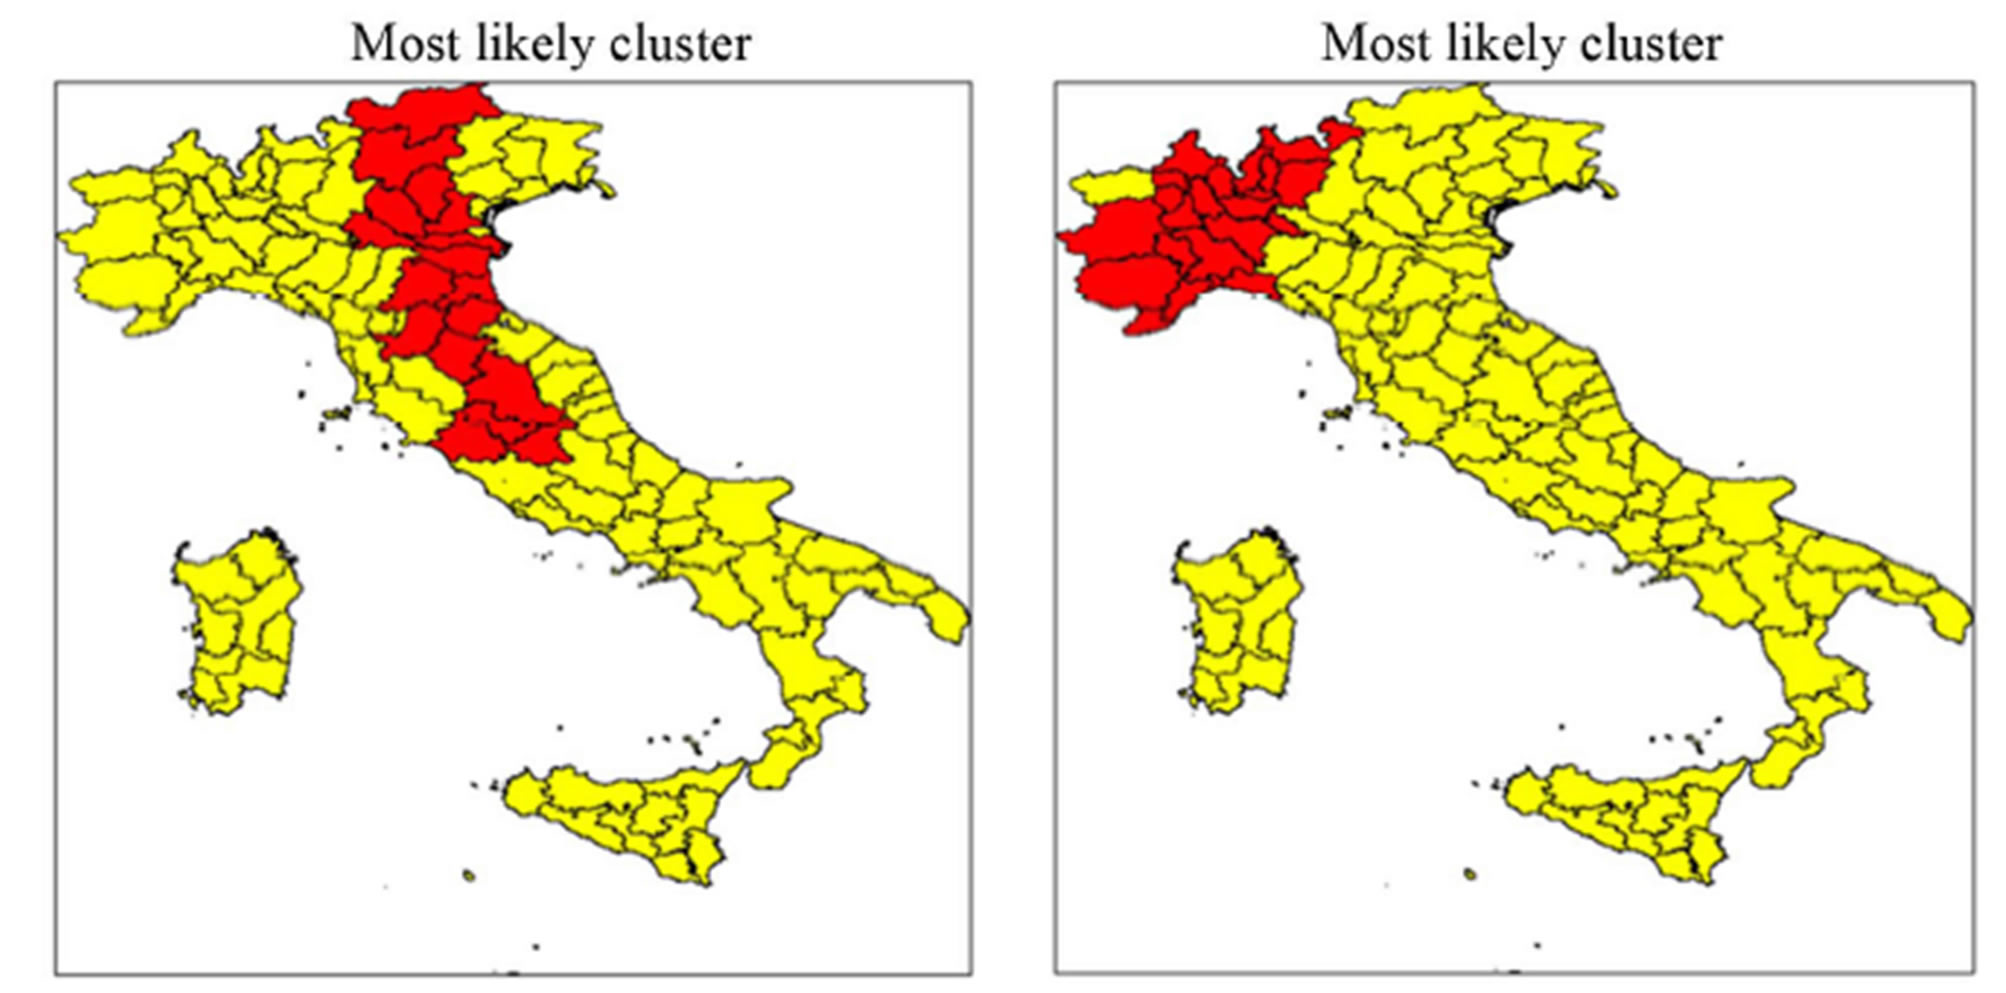
Figure 5. (a) Spatial cluster analysis* of PV plants in Italy—threshold value > 100 kWp—data from Old Energy Account; (b) Spatial cluster analysis* of PV plants in Italy—threshold value > 100 kWp—data from Fourth Energy Account. *SaTScan Poisson model using an elliptic scan window with a non compactness penalty, maximum cluster <20% of the background population.
greater than 100 kWp). As a result, the clusters depicted in Figures 5(a) and (b) perfectly overlap with those displayed in the maps of Figures 4(a) and (b).
5. Conclusions
The analysis proposed in this paper was designed to provide a statistical examination of regional variability in diffusion patterns of PV plants in Italy. Given the nature of PV energy, throughout this paper we support the hypothesis that the policies of local institutions [30], and in particular the financial incentives, play a relevant role in location decisions and in explaining differences in the spatial distribution of PV installations and in their not uniform development. As argued by [31], in Italy there is a considerable variability in the institutional quality of regional governments. As for photovoltaic sector, the bureaucratic inefficiency of local governments may discourage PV investments. For instance, the time and efforts required to obtain authorization for installing new PV systems varies widely among regions. Additionally, for many years, there were contrasting local laws with some regions (especially in the South) prohibiting photovoltaic applications of any kind (Basilicata) and others permitting them only when local companies are involved in their construction (Calabria). This study considers the spatial locations of photovoltaic plants in 110 Italian provinces, distinguished according to their power. To identify differences in the spatial distribution of large PV plants (those targeted starting from 20 kWp), in terms of most concentration, throughout the Italian territory, we adapted the techniques of spatial cluster detection, mostly used in epidemiology, to the problem at hand. More specifically, we employed the elliptic scan statistic to detect a local excess of events and to test if such an excess can reasonably have occurred by chance. Starting from the last available annual report of GSE (2012), we compared photovoltaic data drawn from both the “Old Energy Account” and the “Fourth Energy Account”, with the latter came into force in 2011. The activation of updated versions of Energy Account has had a large impact on the density of PV plants and on their spatial diffusion in Italy. Our findings provided some empirical support that the spatial distribution of PV plants in Italy is characterized by substantial regional dissimilarities.
This study showed that solar energy development depends today on the capability of local structures to promptly take advantages of incentives for solar energy installations more than solar irradiation. In spite of the privileged climate and orographic setting of Southern Italy, which gives to whole South an enormous potential for the installation of photovoltaic power plants, the prevalent and persistent localized clusters of larger PV plants embrace mainly Northern provinces. In those locations, that may seems unlikely on first look, the low solar resource has been counterbalanced by high local incentives, making solar projects feasible. Thereby, it arises the need for the education of regional and local governments about the benefit of solar energy. Italian local governments, particularly in the South, should take advantages of the unexploited solar potential in their territories. It is worth noting that the more favourable climatic conditions of Southern regions affect the effecttiveness of PV technology by increasing the hours of use in the year. Solar PV plants located in the South of Italy achieve a very high level of utilization: over 1500 hours a year.
REFERENCES
- N. Stern, “The Economics of Climate Change,” Oxford University Press, Oxford, 2006.
- European Photovoltaic Industry Association (EPIA), “Market Report 2011,” 2011. http://www.epia.org/
- R. Kahn, “Siting Struggles: The Unique Challenge of Permitting Renewable Energy Power Plants,” The Electricity Journal, Vol. 13, No. 2, 2000, pp. 21-33. http://dx.doi.org/10.1016/S1040-6190(00)00085-3
- T. Ackermann, G. Andersson and L. Söder, “Overview of Government and Market Driven Programs for the Promotion of Renewable Power Generation,” Renewable Energy, Vol. 22, No. 1-3, 2001, pp. 197-204. http://dx.doi.org/10.1016/S0960-1481(00)00015-X
- P. Menanteau, D. Finon and M. L. Lamy, “Prices versus Quantities: Choosing Policies for Promoting the Development of Renewable Energy,” Energy Policy, Vol. 31, No. 8, 2003, pp. 799-812. http://dx.doi.org/10.1016/S0301-4215(02)00133-7
- S. Gupta, D. A. Tirpak, N. Burger, J. Gupta, N. Höhne, A. I. Boncheva, G. M. Kanoan, C. Kolstad, J. A. Kruger, A. Michaelowa, S. Murase, J. Pershing, T. Saijo and A. Sari, “Policies, Instruments and Co-Operative Arrangements,” In: B. Metz, O. R. Davidson, P. R. Bosch, R. Dave and L. A. Meyer, Eds., Climate Change 2007: Mitigation. Contribution of Working Group III to the Fourth Assessment Report of the Intergovernmental Panel on Climate Change, Cambridge University Press, Cambridge, International Energy Agency (IEA), New York, 1998. Trends in Photovoltaic Applications—Survey Report of Selected IEA Countries between 1992 and 1997. IEAPVPS106: 1998. http://www.ieapvps.org/products/download/Trends%201992_1997.pdf
- European Commission, “Commission Staff Working Document,” Brussels, 2008. http://ec.europa.eu/energy/climate_actions/doc/2008_res_working_document_en.pdf
- T. Couture and Y. Gagnon, “An Analysis of Feed-In Tariff Remuneration Models: Implications for Renewable Energy Investment,” Energy Policy, Vol. 38, No. 2, 2010, pp. 955-965. http://dx.doi.org/10.1016/j.enpol.2009.10.047
- S. Avril, C. Mansilla, M. Busson and T. Lemaire, “Photovoltaic Energy Policy: Financial Estimation and Performance Comparison of the Public Support in Five Representative Countries,” Energy Policy, Vol. 51, 2012, pp. 244-258. http://dx.doi.org/10.1016/j.enpol.2012.07.050
- IEA, “Renewable Information,” International Energy Agency Statistics, 2010.
- “GSE Statistical Report,” 2011. http://www.gse.it
- K. Cory, T. Couture, C. Kreycik and E. Williams, “A Policymaker’s Guide to Feed in Tariff Policy Design, National Renewable Energy Laboratory (NREL),” US Department of State, 2010, p. 6. http://www.nrel.gov/docs/fy10osti/44849.pdf
- B. De Nisco, “Le Scelte Fotovoltaiche per l’Edilizia Abitativa: Alla luce del 4. Conto Energia,” Maggioli Editore, Santarcangelo di Romagna, 2011.
- M. Kulldorff and N. Nagarwalla, “Spatial Disease Clusters: Detection and Inference,” Statistics in Medicine, Vol. 14, No. 8, 1995, pp. 799-810. http://dx.doi.org/10.1002/sim.4780140809
- M. Kulldorff, “A Spatial Scan Statistic,” Communications in Statistics, Vol. 26, No. 6, 1997, pp. 1481-1496. http://dx.doi.org/10.1080/03610929708831995
- J. Besag and J. Newell, “The Detection of Clusters in Rare Diseases,” Journal of Royal Statistical Society, Series A, Vol. 154, No. 1, 1991, pp. 143-155. http://dx.doi.org/10.2307/2982708
- S. Openshaw, M. Charlton, C. Wymer and A. W. Craft, “A Mark I Geographical Analysis Machine for the Automated Analysis of Point Data Sets,” International Journal of Geographical Information Systems, Vol. 1, No. 4, 1987, pp. 335-358. http://dx.doi.org/10.1080/02693798708927821
- I. Jung, M. Kulldorff, A. C. Klassen, “A Spatial Scan Statistic for Ordinal Data,” Statistics in Medicine, Vol. 26, No. 7, 2007, pp. 1594-1607. http://dx.doi.org/10.1002/sim.2607
- L. Huang, M. Kulldorff and D. A. Gregorio, “Spatial Scan Statistic for Survival Data,” Biometrics, Vol. 63, No. 1, 2007, pp. 109-118. http://dx.doi.org/10.1111/j.1541-0420.2006.00661.x
- M. Kulldorff, L. Huang and K. A. Konty, “Scan Statistic for Continuous Data Based on the Normal Probability Model,” International Journal of Health Geography, Vol. 8, 2009, p. 58. http://dx.doi.org/10.1186/1476-072X-8-58
- I. Jung, M. Kulldorff and O. J. Richard, “A spatial Scan Statistic for Multinomial Data,” Statistics in Medicine, Vol. 29, No. 18, 2010, pp. 1910-1918. http://dx.doi.org/10.1186/1476-072X-8-58
- M. Dwass, “Modified Randomisation Tests for Nonparametric Hypotheses,” The Annals of Mathematical Statistics, Vol. 28, No. 1, 1957, pp. 181-187. http://dx.doi.org/10.1186/1476-072X-8-58
- G. P. Patil and C. Taillie “Geographical and Network Surveillance via Scan Statistics for Critical Area Detection,” Statistical Science, Vol. 18, No. 4, 2003, pp. 457- 465. http://dx.doi.org/10.1214/ss/1081443229
- L. Duczmal and R. Assunção, “A Simulated Annealing Strategy for the Detection of Arbitrarily Shaped Spatial Clusters,” Computational Statistics and Data Analysis, Vol. 45, No. 2, 2004, pp. 269-286. http://dx.doi.org/10.1016/S0167-9473(02)00302-X
- T. Tango and K. Takahashi, “A Flexibly Shaped Spatial Scan Statistic for Detecting Clusters,” International Journal of Health Geography, Vol. 4, 2005, p. 11. http://dx.doi.org/10.1186/1476-072X-4-11
- M. Kulldorff, L. Huang, L. Pickle and L. Duczmal, “An Elliptic Spatial Scan Statistic,” Statistics in Medicine, Vol. 25, No. 22, 2006, pp. 3929-3943. http://dx.doi.org/10.1002/sim.2490
- M. Emch and M. Ali, “Spatial Cluster Analysis for Etiological Research and Identification of Socio-Environmental Risk Factors,” In: O. Khan and R. Skinner, Eds., Geographic Information Systems and Health Applications, Idea Group Publishing, Hershey, 2002, pp. 172-187. http://dx.doi.org/10.1002/sim.2490
- L. Huang, L. Pickle and B. Das “Evaluating Spatial Methods for Investigating Global and Cluster Detection for Cancer Cases,” Statistics in Medicine, Vol. 27, No. 25, 2008, pp. 5111-5142. http://dx.doi.org/10.1002/sim.3342
- SaTScan, “SaTScan v.9.1.1: Software for the Spatial and Space-Time Scan Statistics,” 2011. http://www.satscan.org/
- S. Jacobsson and A. Johnson, “The Diffusion of Renewable Energy Technology: An Analytical Framework and Key Issue for Research,” Energy Policy, Vol. 28, No. 9, 2000, pp. 625-640. http://dx.doi.org/10.1016/S0301-4215(00)00041-0
- R. Putnam, “Making Democracy Work. Civic Traditions in Modern Italy,” Pricenton University Press, Princeton, 1993.
NOTES
*Corresponding author.