Open Journal of Physical Chemistry
Vol. 2 No. 3 (2012) , Article ID: 22103 , 9 pages DOI:10.4236/ojpc.2012.23020
Molecular Simulation of Ion Transport at the Water/Vapor Interface
1Institut Européen des Membranes, CNRS UMR 5635, Université Montpellier II, ENSCM, Montpellier, France
2Département de Physique et Chimie, Faculté des Sciences, Université Libanaise, Nabatieh, Liban
3Laboratoire de Physiotoxcicité Environnementale EDST017, Faculté des Sciences, Université Libanaise, Nabatieh, Liban
Email: kabousaleh@ul.edu.lb, *dweik83@gmail.com
Received May 22, 2012; revised June 25, 2012; accepted July 26, 2012
Keywords: Molecular Dynamics; Ions; Interface; Interaction Potentials; Solvation; Polarization
ABSTRACT
Molecular dynamics was used to quantify the role of the size, charge and polarisability of F–, Cl–, Br–, I– and Na+ ions in their distribution in the water/vapour interface system. Our results show that the larger polarizable anions I– and Br– is attracted to the surface which is traced back to surface-modified ion hydration, while the F– was repelled from the interface and the Cl– occupied the total volume of the water slab. Moreover, by artificially increasing the ions charge, anions were localized to the center of the water slab. These results demonstrate that the effect of polarizability cannot be neglected in the transport mechanism.
1. Introduction
The adsorption and distribution of ions at the water/vapor interface is a fundamental process encountered in a wide range of biological, physical, and chemical systems [1,2]. For instance, ions at the vapor/water interface are important for atmospheric chemistry involving ocean surfaces and seawater aerosols [3-5]. Ion specificity plays also an important role in the interactions of between colloidal particles in electrolytes [6]. Ions at the biomolecule/water interface are crucial for protein stability [7,8] to name at least one biological implication. Recently, Tobias and coworkers have used classical Molecular Dynamics techniques and polarizable potential models to examine the equilibrium properties such as density profiles and surface tensions of ions at the water/vapor interface [9-12]. These authors were able to reproduce the experimental surface tensions for different alkali-halide ion-pairs and proposed a molecular model of the distribution of the ions at the water/vapor interface [12,13]. Dang and coworkers [14-16] also reported an extensive study of ion transport across the water/vapor interface using a constrained Molecular Dynamics technique. These authors showed that the dynamics is governed by the free energy profile associated with the transfer of an ion from water to the vapor phase. Recently, Netz and coworkers [17], report a study in which classical molecular dynamics computer simulations were used to examine the distribution of ions at the water/vapor and water/hydrophobic solid surfaces interfaces. We note here, it is of great interest to evaluate the effect of size and polarization on the molecular mechanism of ion binding to the water/vapor interface. The effects of size and polarizability play a crucial role in understanding the equilibrium properties example, orientational structure, surface potentials and surface tensions of the water/vapor interface.
The first physical picture of ions at an aqueous interface was given by Onsager and coworkers [18]. In order to understand the salvation of ions at the water/low-dielectric medium interface is that of the image charge. Within this model the ions are fully characterized by the charge q. It can be shown that an aqueous ion with charge q is effectively repelled from the water/vapor interface by a fictitious image charge  , i.e., which is of the same sign and practically the same value of charge [12,18,19]. This model doesn’t take into account of the size and the polarisability of the ion, so we have carried out classical Molecular Dynamics (MD) simulations, which are particularly well adapted for studying phenomena at the nanoscale especially the roles of the ions specific (charge, size, polarizability). The simulation results show an important effect of hydrophobic and polarisabilty of ion in the water slab.
In this paper, we report on a molecular simulation study of the thermodynamics and the structure of ions at the water/vapor interface. We address both the effects of size and polarizability of the ions, which are known or expected to play a crucial role on the behavior of such systems by carrying out Molecular Dynamics simulations of the following alkali-halide aqueous electrolytes: Na+X– with X = F, Cl, Br, and I. The behavior of the ions at the interface is characterized by calculating density distributions across the interface as well as pair correlation functions. We also determine the ion partition coefficients Kij which are defined as the ratio of the ion concentration in region i to that in region j (i, j are the water phase, the vapor phase or the interface). In order to address the effect of the ionic force, we also vary the absolute value of the charge carried by the ions from 0 (neutral) up to 1 (monovalent cation). The remainder of this paper is organized as follows. The simulation details including the description of the models and the interaction potentials are given in Section 2. The results are presented and discussed in Section 3. The conclusions and suggestions for future work are given in Section 4.
2. Computational Details
2.1. Molecular Dynamics
The molecular dynamics simulations were performed using the Amber9 [20] program package. The simulation box is consisted of a 3 nm thin film containing 864 water molecules and 18 pairs of sodium/halide ions NaX (X = F, Cl, Br, and I). This corresponds to a sodium halide concentration of 1.2 M. The square section of the thin film is 3 nm × 3 nm (Figure 1). The size of the parallelepiped box along the direction perpendicular to the film is 10 nm so that each face of the film is in contact with the vapor phase. Periodic boundary conditions were applied along the three dimensions x, y, and z in order to avoid finite size effects. The initial configuration of the simulation was obtained by distributing in a homogeneous way the water molecules and ions in the film. The Verlet leap frog algorithm was used to integrate the equations of motion with a time step of 1 fs. The simulations were performed at a constant temperature of 300 K using the weak coupling method [21] thermostat with a relaxation time step of 3 ps for the thermostat. Each simulation consisted of an equilibration stage of 500 followed by a data collection stage of 1000 ps. The OH bond vibrations were frozen using the Shake algorithm [22,23].
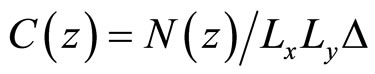
The distribution of ions in the water thin film was investigated by determining both density profiles and partition coefficients. The concentration profiles C(z) for water and ions [11] are measured along the z axis (i.e., perpendicular to the water/vapor interface) by counting the number N(z) of molecules or ions in thin slices of a thickness Δ = 0.2 Å:
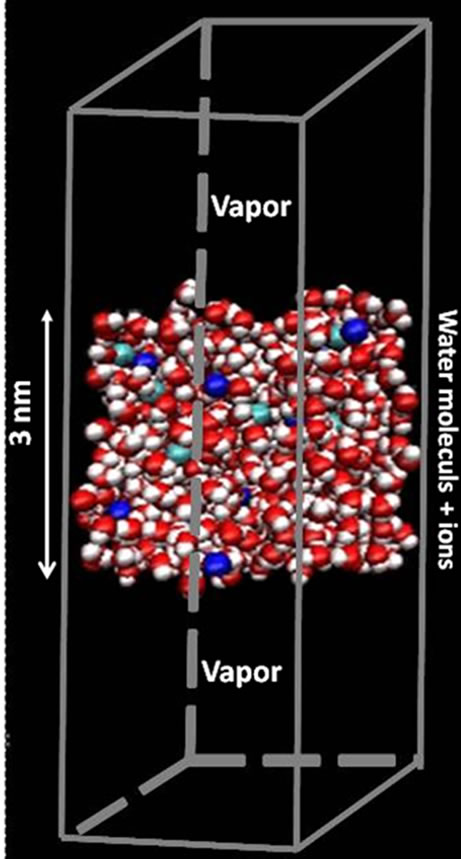
Figure 1. Typical molecular configuration of a 3 nm thin electrolyte film containing 864 water molecules and 18 pairs of sodium/halide ions NaX (X = F, Cl, Br, and I). This corresponds to a sodium halide concentration of 1.2 M. The square section of the thin film along x and y is 3 nm × 3 nm. The size of the parallelepiped box along the direction perpendicular to the film is 10 nm so that each face of the film is in contact with the vapor phase. Red and white spheres are oxygen and hydrogen atoms of the water molecules, respectively. Green and blue spheres are halide and sodium ions, respectively.
 (1)
(1)
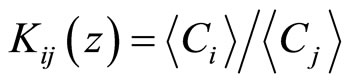
where Lx and Ly are the size of the parallelepiped simulation box. All of the concentration profiles presented in this paper were averaged over 2000 configurations separated by a time of 0.5 ps. Partition coefficients (K) were determined as the ratio of the average ion concentration in region i to that in region j (i, j are either the water phase, the vapor phase, or the interface):
 (2)
(2)
In the remaining of this paper, the following convention will be adopted: the subscripts V, I, and W denote the vapor, the interface and the water region, respectively. As a convention, we define the interface as the region where the water density is comprised between 1% and 99% of its maximum value. As for the concentration profiles, the partition coefficients were averaged over 2000 configurations and the error was estimated as the square root of the standard deviation.
2.2. Interaction Potentials
The rigid polarizable water model “POL3” was chosen because it takes better account of the polarizability of oxygen atoms (water). [24] was used to describe the water-water interaction. The geometry of the POL3 water molecule is shown in Figure 2. This model describes reasonably well the structure and thermodynamic properties of bulk liquid water and the water/vapor interface. The ions are described as rigid polarizable ions using the parameters proposed by Dang and coworkers [14]. The interaction energy Epair between the molecules and ions is the sum of the coulombic interaction and a repulsion and dispersion terms modeled by a Lennard-Jones potential:
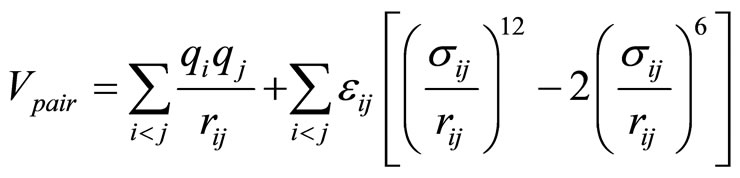 (3)
(3)
where  is the distance between the atoms i and j and qi and qi are the partial charges. σ and ε are the Lennard – Jones parameters for the repulsion and dispersion interactions. All the parameters used in the present work for the water molecules and the elements F, Cl, Br, I, and Na are listed in Tables 1-2. The interaction energy in our model also includes a nonadditive polarization energy term, Epol [25]:
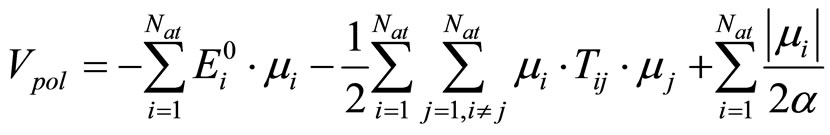 (4)
(4)
The first term in Equation (3) corresponds to the chargedipole and dipole-dipole interactions, respectively. The last term in Equation (3) is the energy associated with the generation of the dipole moment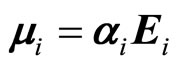 .
.
The latter is defined from the local field Ei, which is related to the electric field created at the position of atom i by the fixed charges j in the system  [14]:
[14]:
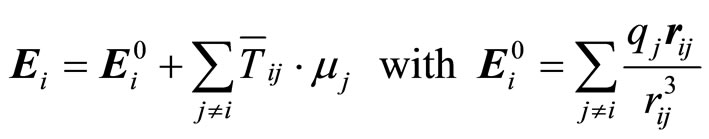 (5)
(5)
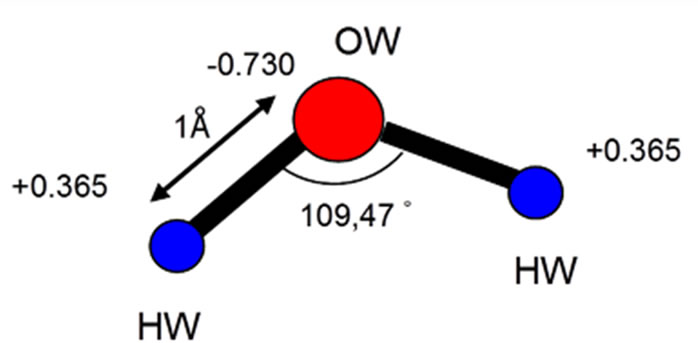
Figure 2. The geometry of rigid polarizable water model “POL3” (taking into account the polarisability of the oxygen atoms) [20] was used to describe the water-water interaction.
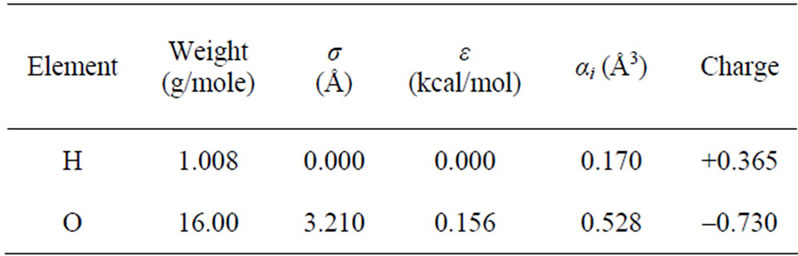
Table 1. Potential parameters for the polarizable rigid water model “POL3” [19].
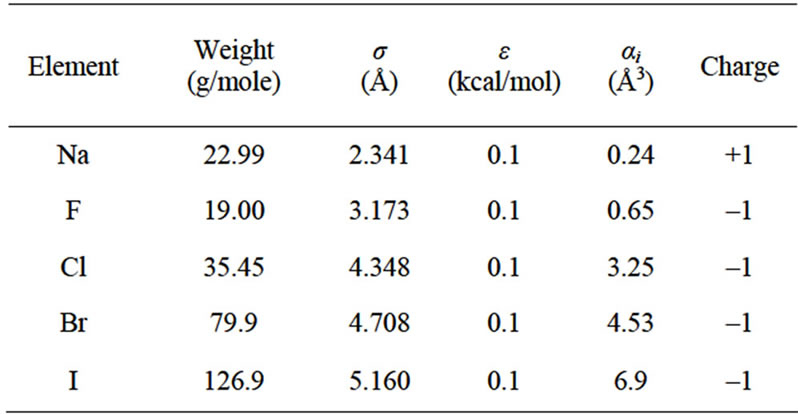
Table 2. Potential parameters for the different ions considered in this work [10,14].
where  is the atomic polarizability and
  is the dipole tensor given by:
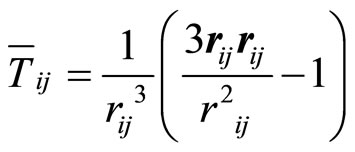 (6)
(6)
In the course of the simulation runs, the Car-Parrinello method [26] was used to evaluate and optimize the induced dipoles. The smooth particle mesh Ewald method [27] was used to calculate the electrostatic energy and the van der Waals interactions and the real space part of the Ewald sum were truncated at 12 Å.
3. Results and Discussions
3.1. Effect of the Size of the Anion (Polarizable Water and Non Polarizable Ions)
We first investigate the effect of the size of the anions on their behavior in aqueous electrolyte interfaces by considering the following systems: water with NaX where X = F, Cl, Br, and I. In this part, non polarizable ions were considered (the effect of the ion polarizabily will be discussed in details below). Figure 3 shows the water, cation and anion concentration profiles across the water/vapor interface at 300 K as a function of the distance z normal to the interface. In order to quantify the degree of exclusion or solvation of halide ions in the electrolyte solutions, we also show in Table 3 the ion partition coefficient KWI which is defined as the ratio of the ion concentration in water to that at the interface. The anions are strongly repelled from the interface and remain within the water film when small ions such as fluoride and chloride are considered (see Figures 3(a) and (b)). In this case, the sodium cations follow the anions as they are also located within the water film. These results are confirmed by the fact that the partition coefficient KWI is much larger than 1 for both the anion and cation (KWI ~ 36 for sodium and KWI ~ 76 for fluoride in sodium fluoride and KWI ~ 24 for sodium and KWI ~ 27 for chloride in sodium chloride). The behavior observed above for small electrolytes such as sodium fluoride and sodium chloride confirms the classical Onsager-Samaras model [18], in which ions are repelled from the water/vapor interface due to their image charges on the vapor side. Different behaviors are observed when larger anions are considered such as bromide and iodide. The concentration profiles for sodium bromide shows that these anions also remain located preferentially in the bulk region of the water film (Figure 3(c)). Nevertheless, the bromide concentration at the water/vapor interface is non negligible compared to fluoride and chloride. In contrast, the sodium cations remain located far from the interface but the concentration profile splits into two peaks which are located on each side of the main concentration peak for bromide. These results, which departs from what is observed for the smallest anions, suggests that the system evolves towards another equilibrium configuration as the size of the anion increases. This is confirmed by the results for the largest anion, which shows that iodide is preferentially adsorbed at the vapor interface as two marked peaks are observed in the region where the water concentration drops off to zero (Figure 3(d)). For this electrolyte solution, the concentration peaks for sodium splits into two peaks which are located within bulk water but close to the peaks for iodide. These results for large anions are consistent with the fact that the ion partition coefficient KWI decreases as the cation gets larger (Table 3). An interesting result that summarizes our observations is that the ion partition coefficient KWI decreases for both the anion and cation as one follows the series NaF, NaCl, NaBr, and NaI.
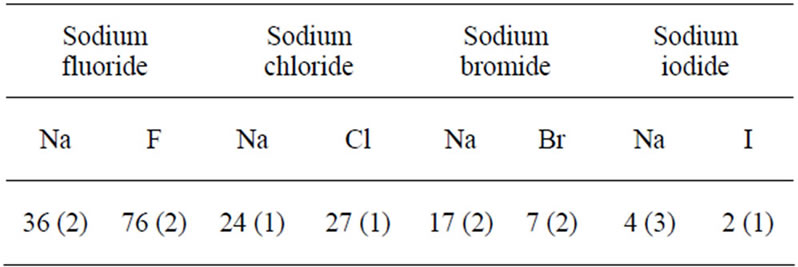
Table 3. Ion partition coefficents KWI between the water phase (W) and the interface (I) for thin electrolyte solutions of a thickness 3 nm when non polarizable ions are considered. KWI is defined as the ratio of the ion concentration in the water phase to that at the interface. The numbers in parentheses indicate the uncertainty of the ion partition coefficient.
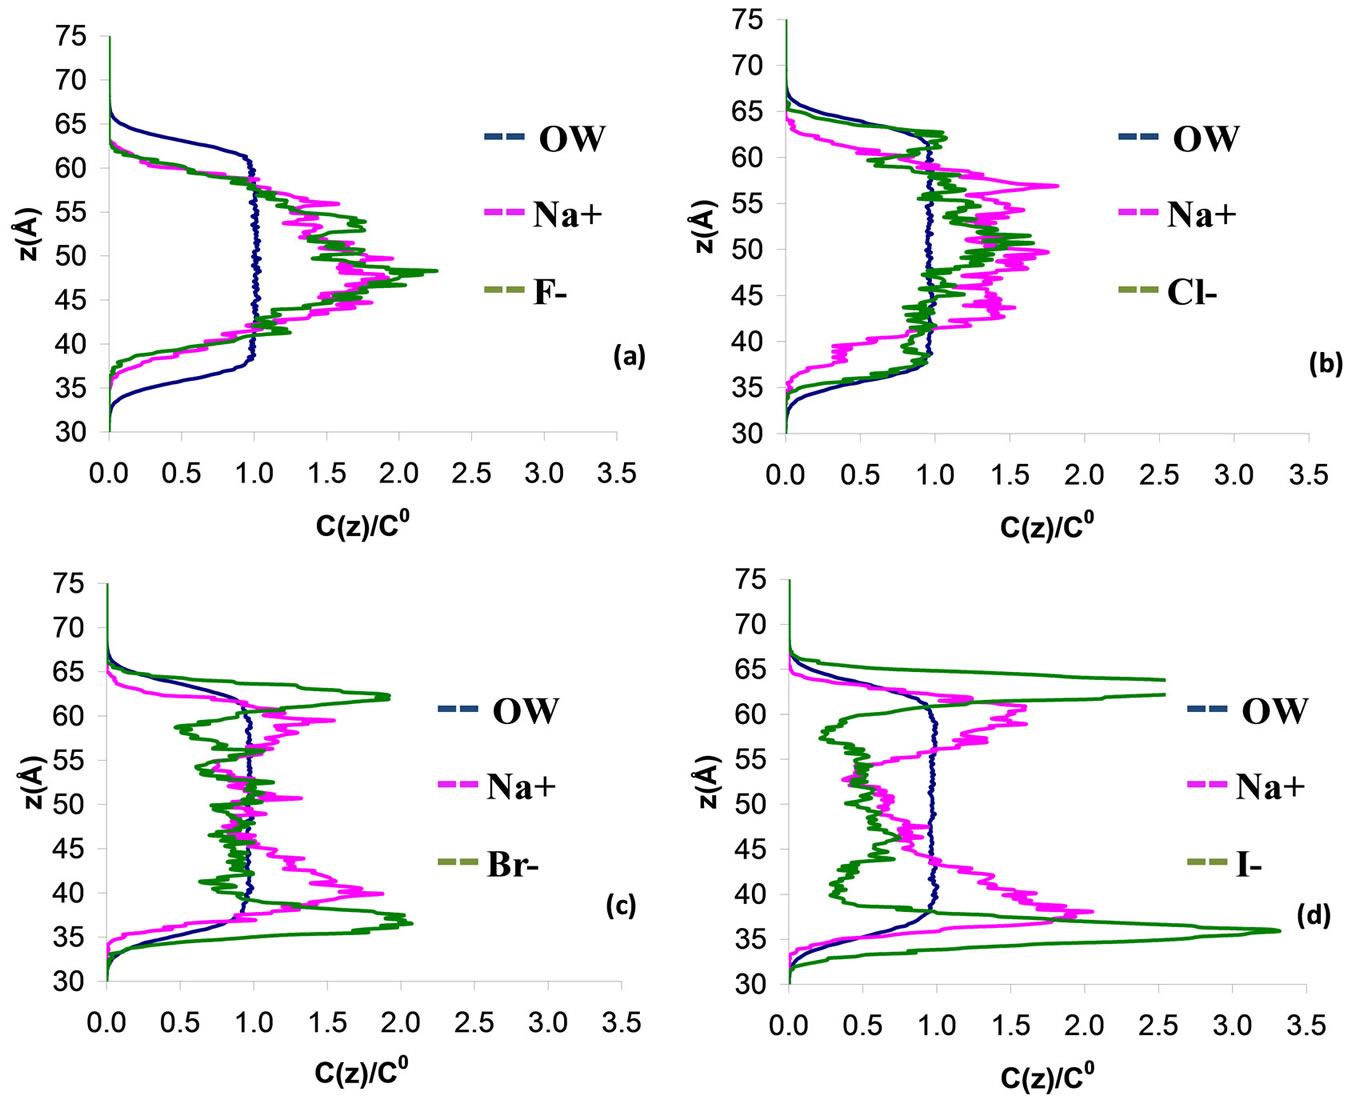
Figure 3. Concentration profile C(z) for a 3 nm thin electrolyte film containing 864 water molecules and 18 pairs of polarizable sodium/halide ions NaX (X = F, Cl, Br, and I). z is the distance normal to the interface (z = 0 is located in the center of the electrolyte film). The blue line corresponds to the data for the water while the pink and red lines correspond to the data for the cation and anion, respectively. The concentration profiles are normalized to the concentration C(0) in the center of the film.
The different regimes observed in this work (anions located in bulk water versus adsorbed at the interface) can be explained in the frame of the so-called “hydrophobic effect” that has been recently reviewed by Chandler [28]. Small anions and cations such as sodium, fluoride, and chloride remain located within bulk water as the volume fraction occupied by these ions is small; the cost in free energy to have these ions in water remains low so that no exclusion is observed. As mentioned above, the classical picture of image charge, which predicts that the ions are repelled from the surface, is relevant in this situation. On the other hand, when larger ions are considered such as bromide and iodide, the volume fraction occupied by the ions becomes significant and leads to high free energy penalties. In this case, the ions tend to move towards the vapor interface. These results show that the hydrophobic effect plays a crucial role as it affects the adsorption and distribution of ions at the water/vapor interface. The origin of this hydrophobic effect is the cost in free energy to solvate the ions as their presence may hinder hydrogen bonding. On the one hand, water molecules can easily solvate small systems (fluoride, chloride) without breaking the hydrogen bonding network so that no exlusion of the ions is observed. On the other hand, large solutes (iodide), which cannot be solvated without drastically hindering hydrogen bonding between the water molecules, tend to be expelled from bulk water towards the water/vapor interface. Depending on the temperature, the free energy penalty responsible for the exclusion of large ions is either enthalpic or entropic. As explained by Chandler [28], a process involving a change in the average number of hydrogen bonds per water molecule will be mainly driven by the enthalpic contribution and the cost in free energy will decrease with increasing temperature. In contrast, a process involving a conformational change in the hydrogen bonding without significant change in the number of hydrogen bonds will be governed by the entropic contribution and the cost in free energy will increase with temperature. In the case of sodium iodide, we found that the fraction of iodide moving from bulk water to the interface increases with increasing temperature (results not shown); this result suggests that solvation and exclusion of large halide ions is driven by the entropic contribution to the free energy.
3.2. Polarizability Effect (Polarizable Water and Ions)
We now discuss the effect of the anion and cation polarizability on the behavior of aqueous electrolyte interfaces by considering the following systems: water with NaX where X = F, Cl, Br, and I. Figure 3 shows the water, cation, and anion concentration profiles across the water/vapor interface at 300 K as a function of the distance z normal to the interface. In order to quantify the degree of exclusion or solvation of the polarizable ions in the electrolyte solutions, we also show in Table 4 the ion partition coefficient KWI which is defined as the ratio of the ion concentration in the bulk water region to that at the vapor/water interface. As in the case of the non polarizable ions, the two following types of concentration profiles are observed. The anions are strongly repelled from the interface and remain within the bulk region of the water film when small ions such as fluoride and chloride are considered (see Figures 3(a) and (b)). Again, in this case, the sodium cations follow the anions as they are also located within the water film. These results are confirmed by the fact that the partition coefficient KWI is much larger than 1 for both the anion and cation (KWI ~ 45 for sodium and KWI ~ 116 for fluoride in sodium fluoride and KWI ~ 30 for sodium and KWI ~ 4 for chloride in sodium chloride). In contrast, the concentration profiles for sodium bromide and sodium iodide shows that these anions are preferentially adsorbed at the water/vapor interface (the effect is even more marked for the largest anion). In this case, the concentration peaks for sodium splits into two peaks which are located within bulk water but close to the peaks for bromide or iodide. These results for large anions are consistent with the fact that the ion partition coefficient KWI decreases as the cation gets larger (Table 4). As in the case of the non polarizable ions, our results show that the ion partition coefficient KWI decreases for both the anion and the cation as one follows the series NaF, NaCl, NaBr, and NaI.
As in the case of the non polarizable ions, the two regimes observed for the polarizable ions (anions located in bulk water versus adsorbed at the interface) can be explained in the frame of the “hydrophobic effect”. Interestingly, the comparison between the ion coefficient partition KWI for the polarizable and non polarizable ions (Tables 3-4) suggests that the polarizability strengthens the solvation of the small ions and the exclusion of the large ions. On the one hand, KWI is larger for the small polarizable ions such as fluoride and chloride than for
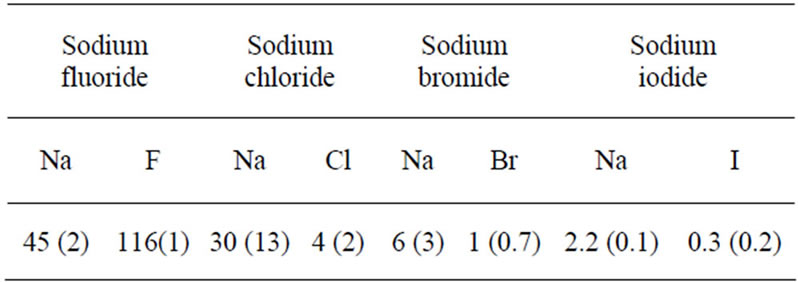
Table 4. Ion partition coefficents KWI between the water phase (W) and the interface (I) for thin electrolyte solutions of a thickness 3 nm when polarizable ions are considered. KWI is defined as the ratio of the ion concentration in the water phase to that at the interface. The numbers in parentheses indicate the uncertainty of the ion partition coefficient.
their non polarizable counterpart. On the other hand, KWI is smaller for the large polarizable ions such as bromide and iodide than for their non polarizable counterpart. We note here that the simulation results are reproduced by Tobias and co-workers, such as density profiles and surface tensions of ions at the water/vapor interface [9,12]. We can also observe experimentally the surface tension and the distribution of ions polarizability [9,13]. To extend our understanding of polarizable ions, it is interesting to note that the PMF (potential mean field) calculated by Dang and co-workers [14]. The physical origin of these results can be explained as follows: At the water/ vapor interface, the salvation is uncompleted (anisotropic salvation); the anion is subjected to a nonzero net dipole. The induced dipole moments of the anions are increased. Note that in the bulk, this net dipole on average equals to zero due to a symmetric salvation of the ion. Consequently, the ion-dipole induction energies between the anion-water are enhanced due to induction effects.
3.3. Effect of the Charge (Polarizable Water and Ions)
We have also examined the dependence on the charge of the polarizable ions on the transport mechanism across the water/vapor interface. Although it does not correspond to any physical situation, the charge of the anion and cation can be arbitrarily changed in order to study the effect of the charge. Figures 4 and 5 show the water, cation, and anion concentration profiles across the water/vapor interface at 300 K for the system NaxI−x (where x varies from 0 up to 1.66). We also quantify in Table 5 the exclusion or solvation of the ions in the electrolyte solutions by calculating the ion partition coefficients Kij which are defined as the ratio of the ion concentration in region i to that in region j (i, j are the water phase, the vapor phase or the interface). On the one hand, both the anions and cations are excluded from the water film when the charge is lower or equal than 0.1. On the other hand, the iodide ions are preferentially adsorbed at the water/vapor interface when the charge x varies between 0.33 and 1. In this case, the sodium cations are located within bulk water but close to the peaks for iodide. When x is larger than 1 (strong ionic strength), both the anions and cations are located within the bulk part of the electrolyte film. These results, which show that the type of behavior for the cations and anions is directly related to the charge of the ions, can be rationalized as follows. The
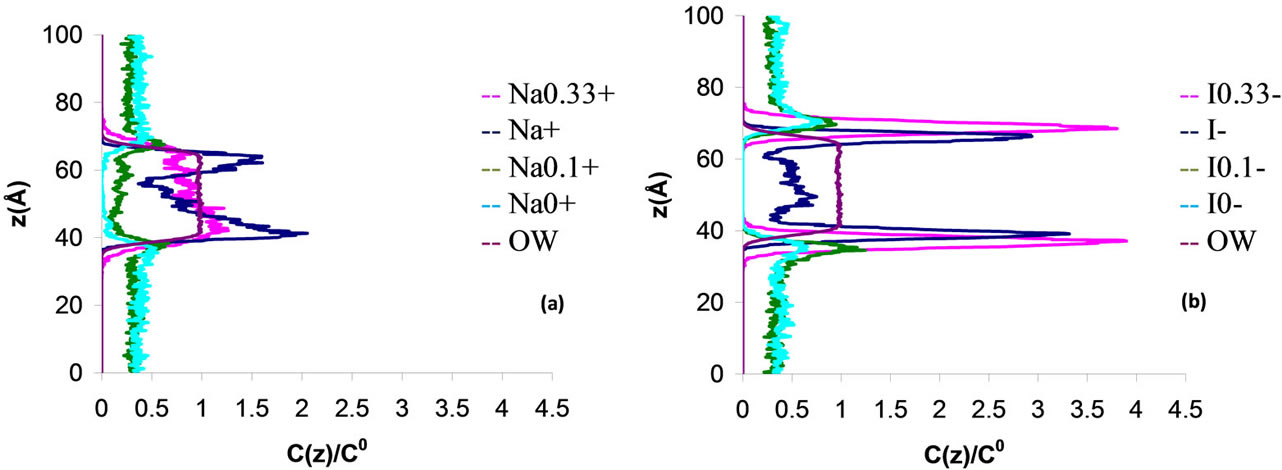
Figure 4. Concentration profile C(z) for a 3 nm thin electrolyte film containing 864 water molecules and 18 pairs of polarizable sodium iodide ions NaxI–x with x varying from 0 to 1. z is the distance normal to the interface (z = 0 is located in the center of the electrolyte film). The concentration profiles are normalized to the concentration C(0) in the center of the film.
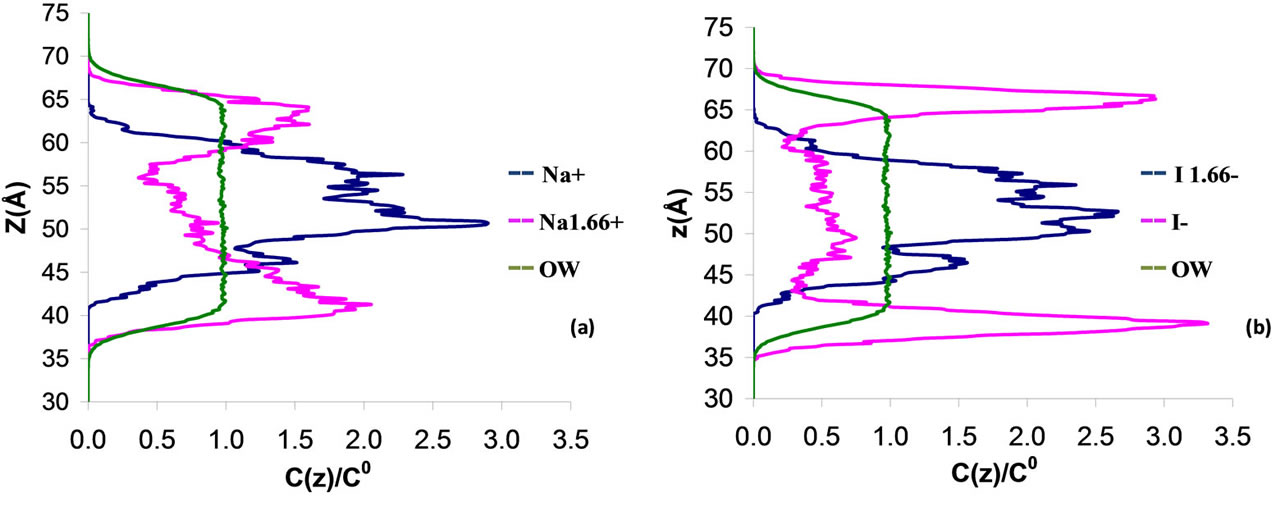
Figure 5. Concentration profile C(z) for a 3 nm thin electrolyte film containing 864 water molecules and 18 pairs of polarizable sodium iodide ions NaxI–x with x varying from 1 to 1.66. z is the distance normal to the interface (z = 0 is located in the center of the electrolyte film). The concentration profiles are normalized to the concentration C(0) in the center of the film.
solvation interaction becomes weak as the ion charge decreases due to the decrease in the coulombic energy. As a result, exclusion of the ions is observed when the charge is very low because the cost in free energy associated with the solvation of the ions is high (the breaking of hydrogen bonds due to the presence of large iodide ions cannot be counterbalanced by the solvation energy). On the other hand, the solvation interaction is strong when the charge is large so that the cost in free energy due to the presence of the iodide ions is compensated by the solvation energy. In the present case of iodide ions having different charges, we note that the solvation/exclusion is driven by the enthalpy contribution to the free energy; indeed, the entropic contribution is independent of the charge x while the enthalpic energy is directly related to x through the solvation energy that depends on the coulombic interaction.
4. Discussion and Conclusions
This paper reports on a Molecular Dynamics simulation study of ions at the water/vapor interface. The fol lowing alkali-halide aqueous electrolytes Na+X– with X = F, Cl, Br, and I are considered. In the case of sodium iodide, we also consider the cases of NaxI–x electrolyte solutions in which the charge x varies from 0 up to 1.66. The cations and anions are found to behave differently in the system as they are either located within the bulk region of the system or preferentially adsorbed at the interface. Our results also show that the size, charge, and polarizability of the ions play a crucial role on their location in the system.
In order to summarize the effect of the size and the polarizability of the ions, we show in Figure 6 the effect of the polarizability α and size R* of the anion X on the phase diagram of the thin electrolyte film. The ions are either located within the bulk region i), near the interface ii), or at the interface iii). In order to determine to which type of phase diagram a system belongs, we adopted the following arbitrary convention:
Belongs to (i) if KWI > 10
Belongs to (ii) if 3 < KWI < 10 (7)
Belongs to (iii) if KWI < 10
For a given polarizability, the ion partition coefficient KWI decreases for both the anion and cation as one follows the series NaF, NaCl, NaBr, and NaI. This result implies that the ions tend to be repelled towards the interface as the size of anion increases. This is an illustration of the so-called “hydrophobic effect”. Small anions and cations remain located within bulk water as the cost in free energy to have these ions in water remains low. In contrast, when larger ions tend to move towards the water/vapor interface they occupy a large volume fraction which leads to a high free energy penalty. The crossover between the different regimes (i, ii, and iii) is also observed when the polarizability increases. As mentioned above, the comparison between the ion coefficient partition KWI for the polarizable and non polarizable ions suggests that the polarizability strengthens the solvation of the small ions and the exclusion of the large ions. The simulations results observed experimentally using the surface tension and the distribution of ions polarizability [9,13]. The simulations correctly reproduce the order of the increase of surface tension 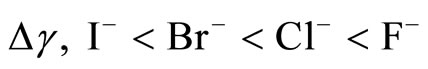 [9,32] and the pic of density profiles at the water/vapor interface [12]. The presence of the larger, polarizable anions at the water/vapor interface is also consistent with a larger number of experimental and theoretical observations of surface locations of these ions on small to moderately sized water clusters [29-31].
Figure 7 shows the effect of the size R*/2 and charge x of the anion I on the phase diagram of the thin electrolyte film of NaxI–x (x varies from 0 up to 1.66). Depending on the values taken by these parameters, five different types of phase behavior are observed. The ions are either located within the bulk region i), near the interface ii), at the interface iii), at the interface iv), or in the vapor phase v). In order to determine to which type of phase behavior a system belongs, we adopted the following arbitrary convention:
Belongs to (i) if KVW and KWI > 10
Belongs to (ii) if KVW = 0 and 2 < KWI < 10
Belongs to (iii) if KVW = 0 and KWI < 2 (8)
Belongs to (iv) if KWI = 0 and KVW < 30
Belongs to (v) if KWI = 0 and KVW > 30
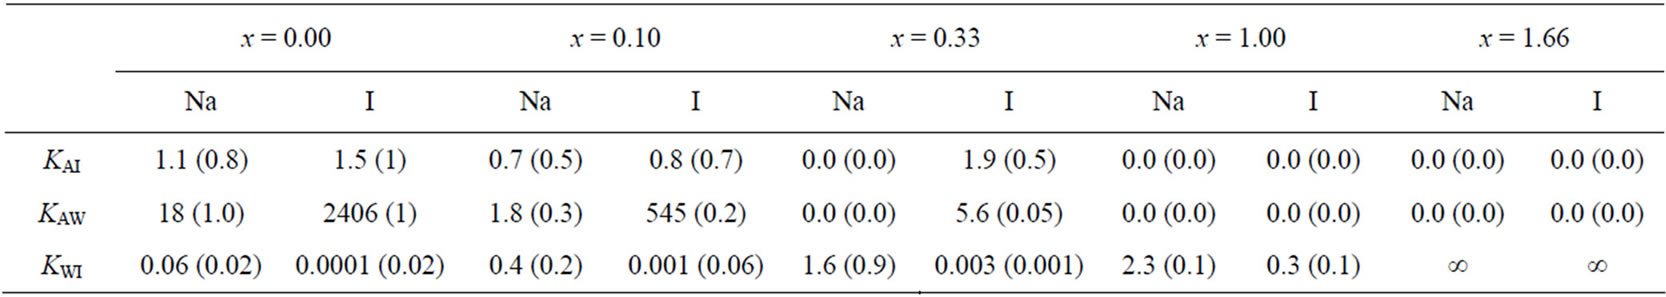
Table 5. Ion partition coefficents Kij between the water phase (W), the vapor phase (V), and the interface (I) for a thin electrolyte solution NaI when the charge x of the ions varies (NaxI–x). Kij is defined as the ratio of the ion concentration in the region i to that in the region j. The numbers in parentheses indicate the uncertainty of the ion partition coefficient.
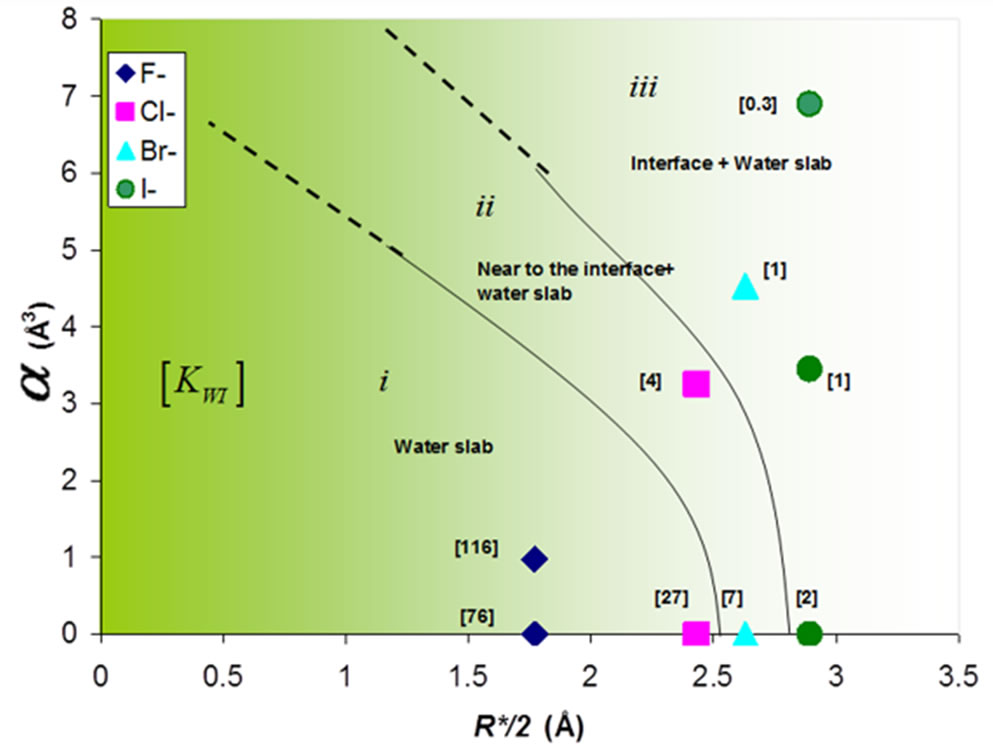
Figure 6. Effect of the polarizability a and size R* of the anion on the phase diagram of a thin electrolyte film containing 864 water molecules and 18 pairs of polarizable sodium ions NaX (X = F, Cl, Br, and I). The ions are either located within the bulk region, near the interface, or at the interface. The number in parentheses indicates the ion partition coefficient KWI defined as the ratio of the ion concentration in water to that at the interface.
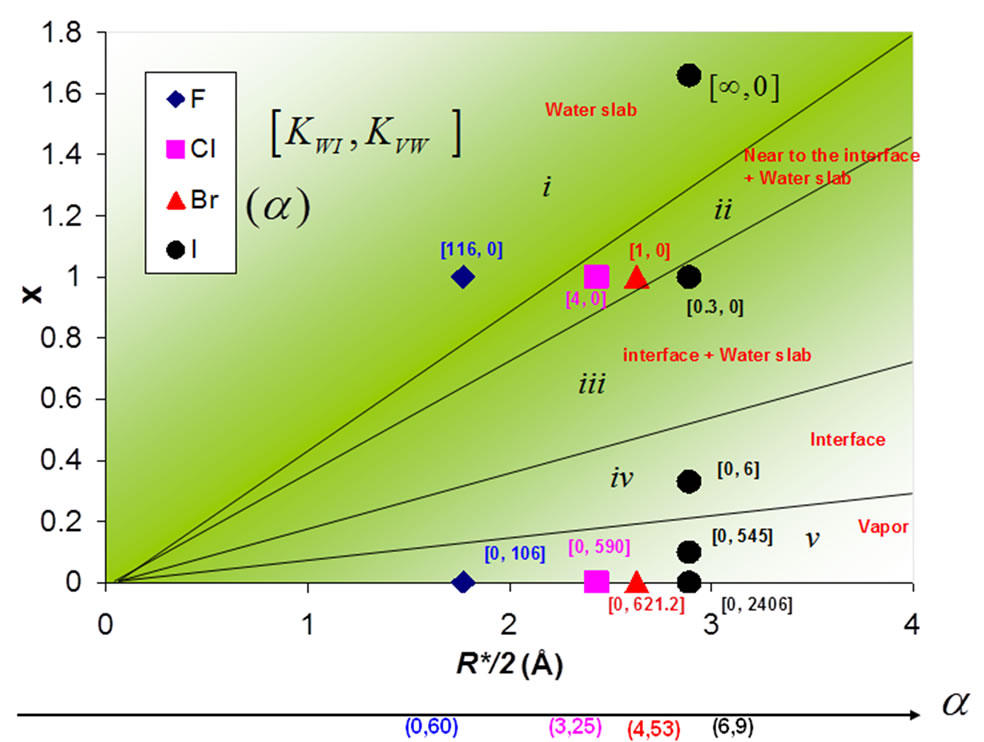
Figure 7. Effect of the charge x and size R* of the anion on the phase diagram of a thin electrolyte film containing 864 water molecules and 18 pairs of polarizable sodium ions NaX (X = F, Cl, Br, and I). The ions are either located within the bulk region, near the interface, or at the interface. The numbers in parentheses and in brackets indicates the ion polarizability and partition coefficients KWI and KAW, respectively.
For a given size of the ions, the phase behavior evolves from i, ii, iii, iv, and v as the charge x decreases from 1.66 down to 0. For neutral systems, both the cations and anions are expelled from the water film as their presence in liquid water corresponds to a high free energy penalty (no compensation arises from the ion/water interaction as there is no coulombic interaction). As the charge x increases, the ions start to be preferentially adsorbed at the interface and, for large values of x, they are located within the bulk region of the water film. In the latter case, even for large ions such as iodide, the coulombic interaction is large enough to counterbalance the cost in free energy associated with the breaking or reorganization of the water hydrogen bond network (no “hydrophobic effect”).
The results reported in the present work underline the crucial role played by the ion charge, size and polarizability on the phase behavior of electrolyte solutions in contact with a vapor phase. In future work, we plan to explore the behavior of similar interfacial electrolyte solutions such as electrolyte solutions confined in nanoporous membranes. These systems, which are known to enhance the diffusion of certain species such as ions and to have a strong selectivity, are very attractive for nanofiltration and therapeutic applications. We will investigate by using the molecular simulation the effect of the size of the nanopores as well as the effect of the charge of the membrane surface.
5. Acknowledgements
We wish to thank the Research Program P-NANO of the French National Agency for Research (ANR) for financial support of this work (Research Project “SIMONANOMEM”). Thanks also to Benoit Coasne and John Palmeri for related help and discussions.
REFERENCES
- S. Mclaughin, “The Electrostatic Properties of Membranes,” Annual Review of Biophysics and Biophysical Chemistry, Vol. 18, 1989, pp. 113-136. doi:10.1146/annurev.bb.18.060189.000553
- B. Honig, W. L. Hubell and R. F. Flewelling, “Electrostatic Interactions in Membranes and Proteins,” Annual Review of Biophysics and Biophysical Chemistry, Vol. 15, 1986, pp. 163-193. doi:10.1146/annurev.bb.15.060186.001115
- J. H. Hu, Q. Shi, P. Davidovits, D. R. Worsnop, M. S. Zahniser and C. E. Kolb, “Reactive Uptake of Cl2(g) and Br2(g) by Aqueous Surfaces as a Function of Br− and I− Ion Concentration: The Effect of Chemical Reaction at the Interface,” Journal of Physical Chemistry, Vol. 99, No. 21, 1995, pp. 8768-8776. doi:10.1021/j100021a050
- B. J. Finlayson and J. C. Hemminger, “Physical Chemistry of Airborne Sea Salt Particles and Their Components,” Journal of Physical Chemistry A, Vol. 104, No. 49, 2000, pp. 11463-11477. doi:10.1021/jp002968n
- B. J. Finlayson-Pitts, “The Tropospheric Chemistry of Sea Salt: A Molecular-Level View of the Chemistry of NaCl and NaBr,” Chemical Reviews, Vol. 103, No. 12, 2003, pp. 4801-4822. doi:10.1021/cr020653t
- F. W. Tavares, D. Bratko and J. M. Prausnitz, “The Role of Salt-Macroion van der Waals Interactions in the Colloid-Colloid Potential of Mean Force,” Current Opinion in Colloid & Interface Science, Vol. 9, No. 1-2, 2004, pp. 81-86. doi:10.1016/j.cocis.2004.05.008
- M. G. Cacace, E. M. Landau and J. J. Q. Ramsden, “The Hofmeister Series: Salt and Solvent Effects on Interfacial Phenomena,” Quarterly Reviews of Biophysics, Vol. 30, No. 3, 1997, pp. 241-277. doi:10.1017/S0033583597003363
- R. J. Piazza, “Interactions in Protein Solutions near Crystallization: A Colloid Physics Approach,” Journal of Crystal Growth, Vol. 196, No. 2-4, 1999, pp. 415-423. doi:10.1016/S0022-0248(98)00867-7
- P. Jungwirth and D. J. Tobias, “Molecular Structure of Salt Solutions: A New View of the Interface with Implications for Heterogeneous Atmospheric Chemistry,” Journal of Physical Chemistry B, Vol. 105, No. 43, 2001, pp. 10468-10472. doi:10.1021/jp012750g
- P. Jungwirth and D. J. Tobias, “Chloride Anion on Aqueous Clusters, at the Air-Water Interface, and in Liquid Water: Solvent Effects on Cl− Polarizability,” Journal of Physical Chemistry, Vol. 106, No. 2, 2002, pp. 379-383. doi:10.1021/jp012059d
- P. Jungwirth and D. J. Tobias, “Surface Effects on Aqueous Ionic Solvation: A Molecular Dynamics Study of NaCl at the Air/Water Interface from Infinite Dilution to Saturation,” Journal of Physical Chemistry B, Vol. 104, No. 32, 2000, pp. 7702-7706. doi:10.1021/jp000941y
- P. Jungwirth and D. J. Tobias, “Specific Ion Effects at the Air/Water Interface,” Chemical Reviews, Vol. 106, No. 4, 2006, pp. 1259-1281. doi:10.1021/cr0403741
- V. Padmanabhan, J. Daillant and L. Belloni, “Specific Ion Adsorption and Short-Range Interactions at the Air Aqueous Solution Interface,” Physical Review Letters, Vol. 99, No. 8, 2007, Article ID: 086105, pp. 1-4.
- L. X. Dang and T. S. Chang, “Molecular Mechanism of Ion Binding to the Liquid/Vapor Interface of Water,” Journal of Physical Chemistry B, Vol. 106, No. 2, 2002, pp. 235-238. doi:10.1021/jp011853w
- L. X. Dang and D. E. Smith, “Molecular Dynamics Simulations of Aqueous Ionic Clusters Using Polarizable Water,” Journal of Chemical Physics, Vol. 99, No. 9, 1993, pp. 6950-6956. doi:10.1063/1.465441
- L. X. Dang, “Computer Simulation Studies of Ion Transport across a Liquid/Liquid Interface,” Journal of Chemical Physics B, Vol. 103, No. 39, 1999, pp. 8195-8200. doi:10.1021/jp991824+
- D. Horinek and R. Netz, “Specific Ion Adsorption at Hydrophobic Solid Surfaces,” Physical Review Letters, Vol. 99, 2007, pp. 226104-22607. doi:10.1103/PhysRevLett.99.226104
- L. Onsager and N. N. T. Samaras, “The Surface Tension of Debye-Hückel Electrolytes,” Journal of Chemical Physics, Vol. 2, No. 8, 1934, pp. 528-536. doi:10.1063/1.1749522
- C. Wagner, “The Surface Tension of Dilute Solutions of Electrolytes,” Physikalische Zeitschrift, Vol. 25, 1924, pp. 474-477.
- D. A. Case, T. A. Darden, T. E. Cheatham, et al., “AM BER9,” 2006. http://ambermd.org/doc9/amber9.pdf
- H. J. C. Berendsen, J. P. M. Postma, W. F. van Gunsteren, A. DiNola and J. R. Haak, “Molecular Dynamics with Coupling to an External Bath,” Journal of Chemical Physics, Vol. 81, 1984, pp. 3684-3690. doi:10.1063/1.448118
- J. W. Caldwell and P. A. Kollman, “Structure and Properties of Neat Liquids Using Nonadditive Molecular Dynamics: Water, Methanol, and N-Methylacetamide,” Journal of Physical Chemistry, Vol. 99, No. 16, 1995, pp. 6208-6219. doi:10.1021/j100016a067
- L. Perera and M. L. Berkowitz,”Structures of Cl−(H2O)n and F−(H2O)n (n=2,3,...,15) Clusters. Molecular Dynamics Computer simulations,” Journal of Chemical Physics, Vol. 100, 1994, pp. 3085-3093. doi:10.1063/1.466450
- G. Markovich, L. Perera, M. Berkowitz and O. Cheshnovsky, “The Solvation of Cl−, Br−, and I− in Acetonitrile Clusters: Photoelectron Spectroscopy and Molecular Dynamics Simulations,” Journal of Chemical Physics, Vol. 105, No. 7, 1996, pp. 2675-2685. doi:10.1063/1.472131
- J. P. Ryckaert, G. Ciccotti and H. J. C. Berendsen, “Numerical Integration of the Cartesian Equations of Motion of a System with Constraints: Molecular Dynamics of n-Alkanes,” Journal of Computational Physics, Vol. 23, No. 3, 1977, pp. 327-341. doi:10.1016/0021-9991(77)90098-5
- W. F. Van Gunsteren and H. J. C. Berendsen, “Algorithms for Macromolecular Dynamics and Constraint Dynamics,” Molecular Physics, Vol. 34, No. 5, 1977, pp. 1311-1327. doi:10.1080/00268977700102571
- U. Essmann, L. Perera, M. L. Berkowitz, T. Darden and L. G. Pedersen, “A Smooth Particle Mesh Ewald Method,” Journal of Chemical Physics, Vol. 103, No. 19, 1995, pp. 8577-8593. doi:10.1063/1.470117
- D. Chandler, “Interfaces and the Driving Force of Hydro Phobic Assembly,” Review, Nature, Vol. 437, No. 29, 2005, pp. 640-647.
- R. W. Gora, S. Rosak and Leszczynski, “Properties and Nature of Interactions in Cl−(H2O)n, n = 1,6 Clusters: A Theoretical Study,” Journal of Chemical Physics Letters, Vol. 325, No. 1-3, 2000, pp. 7-14. doi:10.1016/S0009-2614(00)00624-2
- S. J. Stuart and B. J. Berne, “Surface Curvature Effects in the Aqueous Ionic Solvation of the Chloride Ion,” Journal of Physical Chemistry A, Vol. 103, No. 49, 1999, pp. 10300-10307. doi:10.1021/jp991671q
- P. Ayotte, G. H. Weddle, J. Kim and M. A. Johnson, “ Vibrational Spectroscopy of the Ionic Hydrogen-Bond: Fermi Resonance and Ion-Molecule Stretching Frequencies in the Binary X−·H2O (X=Cl, Br, I) Complexes via Argon Predissociation Spectroscopy,” Journal of the American Chemical Society, Vol. 120, No. 47, 1998, pp. 12361-12362. doi:10.1021/ja981979f
- A. P. dos Santos, A. Diehl and Y. Levin, “Surface Tensions, Surface Potentials and the Hofmeister Series of Electrolyte Solutions,” Langmuir, Vol. 26, No. 13, 2010, pp. 10778-10783. doi:10.1021/la100604k
NOTES
*Corresponding author.