Optics and Photonics Journal
Vol.08 No.06(2018), Article ID:85586,14 pages
10.4236/opj.2018.86017
Sonoluminescence as the PeTa Radiation, Part Three
Vitali A. Tatartchenko
CNRS, Aix-Marceille University, Provence, France

Copyright © 2018 by author and Scientific Research Publishing Inc.
This work is licensed under the Creative Commons Attribution International License (CC BY 4.0).
http://creativecommons.org/licenses/by/4.0/


Received: May 28, 2018; Accepted: June 24, 2018; Published: June 27, 2018
ABSTRACT
This paper is the third in a series published in this journal during 2017-2018. These three papers present various stages in the development of the PeTa model for phenomena of the same physical nature: cavitational luminescence (CL), multi-bubble sonoluminescence (MBSL), single-bubble sonoluminescence (SBSL), and laser-induced bubble luminescence (LIBL). The basis of this model is the PeTa (Perel’man-Tatartchenko) effect―a nonequilibrium characteristic radiation under first-order phase transitions, for instance, vapour condensation. The third iteration of this model “Vapour bubble luminescence” (VBL) is presented in this paper. The essence of this model is as follows: with a local decrease of pressure or an increase of temperature in a tiny volume of the liquid, one or several bubbles filled with vapour will appear. Subsequently, a very rapid increase in pressure or a decrease in temperature of the bubble leads to super-saturation of the vapour inside the bubble, followed by its instantaneous condensation with the emission of condensation energy (this is the PeTa effect). A sharp decrease in pressure causes the collapse of the bubble accompanied by a shock wave in the liquid. VBL model is conveniently represented on the solid-liquid-vapour phase diagram. A better understanding of the physical nature of the phenomena under consideration could help to find their useful applications. To develop this idea further, we propose a design of a cavity-free pulsed laser on the basis of CL/MBSL/SBSL. An analysis of LIBL in cryogenic liquids is also given in this paper.
Keywords:
Cavitational Luminescence (CL), Sonoluminescence (SL), Multi-Bubble Sonoluminescence (MBSL), Single-Bubble Sonoluminescence (SBSL), Laser-Induced Bubble Luminescence (LIBL), LIBL in Cryogenic Liquids, Vapour Bubble Luminescence (VBL), PeTa (Perel’man-Tatartchenko) Effect, First-Order Phase Transitions, Evaporation, Condensation, Crystallization, Cavity-Free Pulsed Laser

1. Introduction
This is the third paper in a series presenting different steps in the development of the PeTa model of similar physical phenomena: cavitational luminescence (CL), multi-bubble sonoluminescence (MBSL), single-bubble sonoluminescence (SBSL), and laser-induced bubble luminescence (LIBL). The previous two papers were published in this journal during 2017 [1] [2] . The basis of this model is a nonequilibrium characteristic radiation under first order phase transitions that since 2010 has been called the PeTa (Perel’man-Tatartchenko) effect [3] . It should be noted that even 10 years ago we proposed to consider the PeTa effect as the basis of MBSL [4] [5] [6] . But then it was done without a detailed analysis and concerned only infrared radiation under MBSL [7] . Later, a first iteration of the model was developed in detail [1] . The model explained the main experimental results of CL/MBSL/SBSL. Recently, the model has been improved [2], and we have shown that it is able to explain additional features of phenomena under consideration. This is especially true of LIBL, in which vapour bubbles are formed in the liquid due to a short laser pulse. Interesting peculiarities of the LIBL spectrum in water were explained.
In this paper, we interpret the spectra of the LIBL in cryogenic liquids. In addition, we continue to improve our model. We show that all of the similar physical effects under consideration, CL/MBSL/SBSL/LIBL, can be generalized as the phenomenon that we call “Vapour bubble luminescence” (VBL). The essence of the model is as follows: when there is a local decrease in pressure or an increase of temperature in a tiny volume of the liquid, one or several bubbles filled with vapour will appear. Subsequently, very rapid increase in pressure or a decrease in temperature in the same volume of liquid leads to supersaturation of the vapour inside the bubble. The instantaneous condensation of the vapour with the emission of condensation energy (this is the PeTa effect) results in a sharp decrease in pressure and collapse of the bubble due to the pressure drop accompanied by a shock wave in a liquid. The VBL model explains all experimental data concerning CL/MBSL/SBSL/LIBL phenomena.
We also propose to design a cavity-free pulsed laser on the basis of CL/MBSL/SBSL.
2. LIBL in Cryogenic Liquids
The emission spectra of CL/MBSL/SBSL/LIBL in water, acids and aqueous solutions of various substances do not differ much in any way [1] [2] . But the spectra of cryogenic liquids differ significantly from that observed for liquids listed above [8] . Therefore, we confine ourselves to an analysis of the spectra for water, carried out in our second paper [2] . At the same time, let us use the experimental data presented in reference [8] for the analysis of LIBL in cryogenic liquids. These authors, along with the study of LIBL in water, carried out an investigation of this phenomenon in liquid nitrogen (Figure 1) and argon. The spectrum of the LIBL in argon obtained in reference [8] is shown in Figure 2. The authors
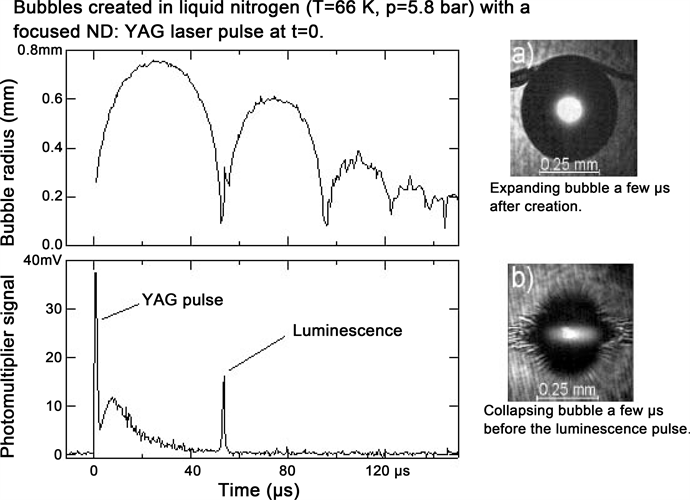
Figure 1. LIBL in liquid nitrogen (from [8] ).
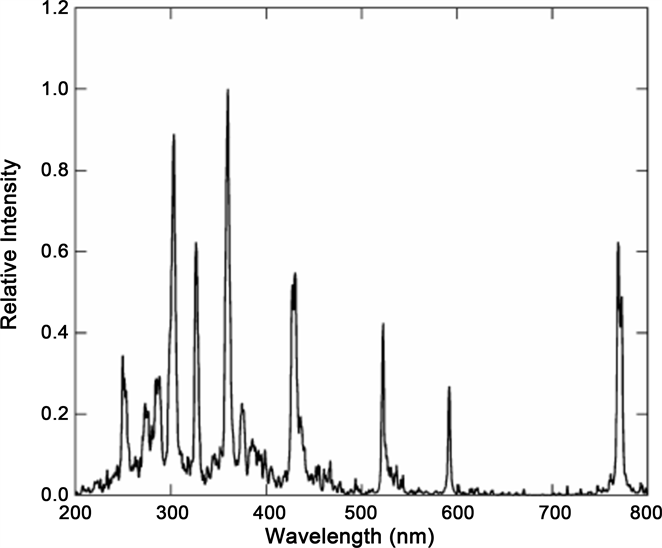
Figure 2. Spectrum of the LIBL in liquid argon at 87 K, 4.5 bars of pressure (from [8] ).
explain the banded spectrum by the emission of excited chromium atoms, which are trapped in the liquid because of cavitations. Surprisingly, the authors did not verify this hypothesis of cavitation by repeating the same experiment in another liquid medium. In addition, they did not compare spectra of LIBL in liquid argon and nitrogen. But in any case, we have to be grateful for the publication of their interesting experimental results.
2.1. LIBL Process Analysis
Experimental parameters: temperature T = 66 K, external pressure Pe = 580 kPa. Inside the bubble, the Laplace pressure PL = 2 σ/R is added to the external pressure. Here σ is the surface tension of the liquid nitrogen, and R is the radius of a bubble. Let us calculate PL for the initial and final dimensions of the bubble at a little higher temperature 77 K for which σ = 8.5 × 10⁻³ N/m. At point 1: R1 = 0.75 mm and PL1 = 2σ/R1≈ 23 Pa. At point 2: R2 = 0.1 mm and PL2 = 2σ/R2 ≈ 170 Pa. It means that a full pressure P at point 1: P1 ≈ 580.023 кPa, and at point 2: P2 ≈ 580.170 кPa. In fact, the temperature can be higher or below than 77 K. So, the actual pressure PL can be more or can be less than the calculated one. But in any case, the Laplace pressure PL is a small addition to the pressure P in our system, and like analysis in our previous paper [2], here we can neglect the Laplace pressure and use the isobaric PeTa model.
As given in paper [2], we assume that point 1 is an equilibrium point. This means that the equilibrium pressure of nitrogen at this point is equal to the external pressure. Then the temperature inside the bubble at this point should be 96 K. From here, one can calculate the mass of the gas in the bubble. The density of gaseous nitrogen at this temperature is 3.451 кg м−3. The radius of the bubble is 0.75 mm. From this, it follows that the mass of the gas in the bubble M1 is = 6.1 × 10⁻⁶ g, that corresponds to 1.3 × 10¹⁷ molecules.
As we have shown in our paper [2], due to the rapid decrease in the size of the bubble, practically all these molecules must condense with the emission of PeTa radiation. Let us recall that according to our calculations in [2], 1.5 × 10¹⁵ molecules of water vapour condensed under the LIBL in water. Hence, under LIBL in liquid nitrogen, the number of photons should be two orders of magnitude larger. This explains why, as noted in reference [8], under LIBL in liquid nitrogen, two orders of magnitude more photons than those under LIBL in water (1010 and 108, respectively) are recorded. Obviously, the number of recorded photons is much smaller than the number of calculated molecules, because a significant portion of the molecules is clustered together, and many photons are absorbed by the liquid and the walls of the vessel.
2.2. Spectrum Analysis
We proceed from the assumption that chromium has nothing to do with the spectrum, and the spectrum (Figure 2) represents the real LIBL in liquid argon.
2.2.1. Identification of Bands
As usual, in the PeTa model, each band is attributed to the radiation of the specified clusters. In accordance with Formula (5) from paper [2], the wavelength λ of radiation for a cluster from M atoms/molecules with n photon emission follows:
(1)
Here, the energy of the phase transition for one atom/molecule is denoted Λ, and the bound energy of the atoms/molecules in clusters is ΓM.
Let us write out the coordinates of all the bands from Figure 2: = 0.77 μm, = 0.58 μm, = 0.53μm, = 0.44 μm, = 0.37 μm, = 0.36 μm, = 0.32 μm, = 0.30 μm, = 0.29 μm, = 0.28 μm, = 0.26 μm.
For Argon, Λ = 6.27 kJ/mole, and roughly, for big M, ΓM can be assumed ≈ 0.75 Λ ≈ 4.7 kJ/mole [9] .
Under this assumption and for n = 1, from Formula (1) we obtain the number of argon atoms in each cluster responsible for the corresponding bands: M1 = 99, M2 = 132, M3 = 144, M4 = 174, M5 = 207, M6 = 212, M7 = 239, M8 = 255, M9 = 264, M10 = 273, M11 = 294. Because we used a very rough approximation for ГM, these figures can be considered purely approximate.
Based on direct experiments and calculations [10] [11] [12], let us try to understand, whether it is possible to state that the existence of such clusters in argon is possible.
2.2.2. Clusters in Argon at Cryogenic Temperatures
A feature of the cluster structure of argon inside the bubble formed by the laser is the possibility of the existence of both ordinary clusters and cluster ions, because the high energy of the laser beam leads to ionization of the argon atoms. We have already discussed the effect of cluster ions on the LIBL spectrum in water [2] . Here a brief description of clusters and cluster ions in inert gases based on references [10] [11] [12] follows. A cluster ion is an ion consisting of an atomic ion and associated gas atoms. Such ions are present, for example, in a low-temperature plasma at medium with high gas pressures or in condensation processes in a Wilson chamber.
The binding energy of particles in clusters is usually very small (not exceeding several eV), therefore large clusters can exist for a considerable time only at sufficiently low temperatures. Clusters are formed in the gas as a result of triple collisions of particles. Therefore, to create clusters, a sufficiently high pressure of the gas is necessary. Let us note that both of these requirements are met in our case.
We have already described the existence of a big magic number M = 21 for protonated water vapour [2] . The stability of this ion corresponds to the formation of a clathrate with an H3O+ ion in the middle and 20 water molecules around it. Helium clusters have magic numbers M = 7, 10, 14, 30 for both isotopes and M = 23 for the He4 isotope. The magic numbers for neon clusters are M = 13, 21, 55, 75. For clusters of krypton M = 14, 16, 19, 22, 27, 29, 75, 87. For xenon clusters, M = 13, 16, 19, 25, 55, 71, 87, 147. The most investigated argon clusters have M = 14, 16, 19, 21, 23, 27. In accordance with the Formula (1), the radiation bands corresponding to these magic numbers are located in a rather far infrared region and are absorbed by the liquid and the walls of the vessel. Measurements show that for a system of bound argon atoms the magic numbers exist up to the number of atoms in the particle M ~ 500, i.e. the cluster itself can contain up to several hundreds of atoms.
The structure of a large cluster is determined primarily by the interaction of the nearest neighbours. Proceeding from these positions, we see that the case of the interaction of atoms with a closed electron the shell (atoms of an inert gas) has the greatest stability structure with a dense packing of atoms. With regard to binding energy ΓM, it should be noted that while the Ar dimer has a binding energy 12 meV, bulk argon has a sublimation energy of 80 meV and magic number clusters M = 13 and M = 19 have intermediate sublimation energies of approximately 60 meV.
The system under consideration is complicated by the possibility of formation of multiple charged cluster ions. If the cluster ion contains a small number of atoms in its composition, then such formation is unstable and, due to the Coulomb repulsion of the fragments, breaks up into parts. Therefore, there is a critical number Mc of atoms or molecules in a cluster ion, in which the multiply-charged cluster ions are stable. The critical number of Mc atoms in a doubly-charged and multiply-charged cluster ion can be determined from the considerations that at this value of the number of atoms the binding energy of a single ion coincides with the energy of the Coulomb interaction with other simple ions in the cluster. For instance, in argon, if the number of atoms corresponding to the existence of a singly charged ion is 91, for a doubly charged ion it is equal to 225.
Thus, our very brief review of the literature data on the existence of various clusters in inert gases shows that the set of clusters responsible for the LIBL spectrum obtained in our calculations is reasonable. Moreover, if we could know exactly the binding energy of atoms in clusters, LIBL would be a useful tool for cluster structures study.
3. CL/MBSL/SBSL/LIBL Display on the Nonequilibrium Liquid/Vapour Phase Diagram
In this section, we present all the investigated processes CL/MBSL/SBSL/LIBL on the solid-liquid-vapour phase diagram. This concept allows us to clearly understand the unified physical nature of these processes.
3.1. Equilibrium and a Non-Equilibrium Phase Diagrams for Vapour/Liquid/Solid Phases
Figure 3 shows an equilibrium and non-equilibrium phase diagrams for vapour/liquid/solid phases. It is characterized by the presence of additional non-equilibrium boundaries between the liquid-vapour, solid-liquid and solid-vapour phases. In Figure 3, they have dashed lines of the same colours. The equilibrium phase diagram for a given substance is permanent. It is constructed for idealized conditions of phase transitions when the rate of transition from one phase to another is infinitesimal. In contrast to the equilibrium diagram, the non-equilibrium diagram varies depending on: the direction of the phase transition (from the
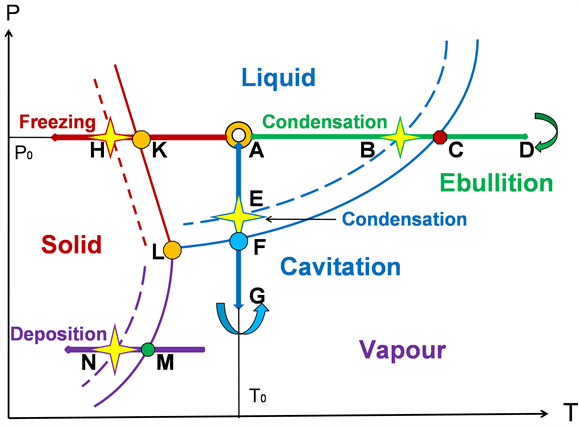
Figure 3. Nonequilibrium phase diagram for solid-liquid-vapor phases.
more condensed phase to the less condensed one or vice versa), the phase transition rate and the phase transition conditions (amount of matter, the presence of new phase nuclei, etc.). In Figure 3, a schematic non-equilibrium phase diagram is presented for the case of transitions from less condensed phases to more condensed ones: liquid-solid, vapour-liquid, and vapour-solid. Here, in comparison with the equilibrium phase diagram, the boundaries of the phase transitions are shifted toward more condensed phases. This is an illustration of the well-known experimental fact: At a large speed, the phase transitions from less condensed phases to a more condensed one, vapour-liquid, liquid-solid or vapour-solid, occur when the less condensed phases are supersaturated. The most known example of this phenomenon is a supercooling of small drops of water in hail clouds up to −40˚C. This means that the water-ice transition does not occur at point K, but at point H (Figure 3), and the distance between K and H points for these crystallization conditions is 40˚C.
3.2. Vapour Bubble Luminescence VBL
Then the description of the VBL phenomenon follows: Let us consider a very small volume of liquid at temperature T0 and pressure P0 which correspond to the figurative point A in the phase diagram (Figure 3).
3.2.1. Temperature Increase, LIBL Illustration
Let under the action of a local short-term heat source in the small volume around figurative point A, the temperature rise sharply. Such heat sources are, for example, a concentrated laser beam which leads to the LIBL or electric arc discharge that gives the similar effect. The thermodynamic state of the volume under consideration will then correspond to the horizontal movement of the figurative point to the right. When the figurative point reaches position C, a vapour bubble should appear in this volume of the liquid. The appearance of a bubble under a boiling of liquid is a rather complex physical process. In particular, this is due to pressure. Indeed, the horizontal motion of the figurative point corresponds to the isobaric process. In our previous paper [2] and in Section 2 of this paper, we have shown that this approach is applicable to LIBL, when the diameter of the bubble is tenths of a millimetre. However, when a bubble is nucleated, its size is very small, and the Laplace pressure inside the bubble is large. In this case, the isobaric approximation is inapplicable. We, however, will ignore the process of nucleation, because for us only the further behavior of a large volume bubble is essential. Let the position of the figurative point D corresponds to the situation when the energy source is exhausted, and the bubble has reached its maximum size. It is very important that the figurative point here changes its direction of movement. For a short time, the speed of its movement is zero. Therefore, the thermodynamic conditions inside the bubble here will be in equilibrium. In our previous paper [2] and in Section 2 of this paper, in the study of LIBL, this corresponds to a ~1 mm bubble size and a vapour temperature of ~120˚C for water vapour or ~96 K for nitrogen inside the bubble. For VBL in water, it is essential that, in addition to the vapour, there is a small amount of gas inside the bubble, previously dissolved in the liquid. For the spectrum of the subsequent luminescence, it is very important that several gases contribute to the formation of clusters in the vapour. Then, under the action of the heat sink to the external environment, the bubble begins to cool. At this stage, if the cooling rate is high enough, the behaviour of the vapour resembles the behaviour of an ideal gas. Its pressure decreases, and under the influence of external pressure, the bubble size decreases. This isobaric process corresponds to the movement of the figurative point to the left from point D to point C. A necessary condition for such a system behaviour is a very high cooling rate at which the rate of change of the linear dimensions of the bubble must be at least 0.5 m/s. As it was shown in our papers [1] and [2], under this condition, the vapour will not have time to condense on the inner surface of the bubble at the point C. When the figurative point passes to the left of the point C and appears in the zone of equilibrium existence of the liquid, a substance inside the bubble will not be a liquid, but the compressed supercooled vapour.
At an elevated pressure, in supersaturated vapour (figurative point B), three processes occur: First, the vapour molecules are predisposed to form clusters, and most likely this occurs. Second, molecules/clusters become excited compared to the bulk liquid molecules. Third, the density of molecules/clusters in the vapour increases, and in conformity with Dicke [13], when the threshold value of this density is reached, there is an interaction of molecules and clusters through the collective radiation field. We obtain the classical situation in which PeTa radiation occurs. It is at this moment that there is an instant condensation of the vapour inside the bubble with the emission of the phase-transition energy (the result is a flash). There is a decrease in pressure, followed by the collapse of the bubble as a result of the instant pressure drop, and the subsequent formation of a shock wave.
3.2.2. Pressure Decrease, CL/MBSL/SBSL Illustration
Let under the action of a stretching mechanical wave propagating in a liquid, the pressure in the small volume around figurative point A decreases rapidly. Such mechanical wave can be, for example, an ultrasonic wave, which leads to the SL effect. At a constant temperature, the thermodynamic state of the volume under consideration will then correspond to the vertical downward movement of the figurative point. When the figurative point reaches position F, vapor bubbles should appear in this volume of the liquid. The further behaviour of the bubbles corresponds to the vertical motion of the figurative point and completely repeats the previous case if the rise and fall of temperature we replace, respectively, with the decrease and increase in pressure. The position of the figurative point G will be equivalent to the position of D, of point F―to point C, of point E―to point B. Thus, the main event―a flash with the release of condensation energy will occur at the figurative point E.
3.2.3. More Complex Cases of CL/SBSL/MBSL/LIBL
It is quite obvious from the phase diagram (Figure 3) that the processes of CL/SBSL/MBSL need not necessarily occur in isothermal conditions, and the process of LIBL―in isobaric ones. It is possible to imagine a situation where simultaneous changes in temperature and in pressure take place in the volume under consideration. This case will correspond to a more complex trajectory of the movement of the figurative point. Obviously, to realize the phenomenon of VBL, this trajectory has to correspond to the fulfilment of two conditions: 1) When a point moves in both forward and reverse directions, the trajectory must cross the phase boundary of the liquid-vapour between the triple and critical points; 2) The speed of the reverse movement of the figurative point must be high enough to eliminate the equilibrium condensation of vapour on the walls of the bubble. These conditions give us the limits of the values in which the temperature and pressure can be changed under VBL. Obviously, this information will be very useful in further improving our model.
It can be concluded that the term VBL, proposed by us, fully corresponds to the described mechanism of CL/SBSL/MBSL/LIBL.
4. Other Examples of the PeTa Radiation on the Phase Diagram
In Figure 3, figurative points H and N present two other cases of phase transitions accompanied by the PeTa radiation. This allows us to present a general picture of the possible cases of PeTa radiation and the position of VBL in it.
4.1. Liquid-Solid Transition
With a relatively rapid crystallization of the molten substances, the PeTa effect is observed if these substances are transparent to PeTa radiation. In the phase diagram of Figure 3, this process corresponds to a horizontal movement of the figurative point A to the left. If the cooling process is rather slow (this corresponds to the equilibrium phase diagram), when the figurative point reaches the boundary of the liquid-solid transition (point K), the liquid simply freezes, and the PeTa effect is absent. If the cooling process is fast enough, after reaching point K, the cooled substance remains liquid, but super-cooled.
We have already described this phenomenon: in the process of formation of hail in the clouds, small drops of water in the clouds can be super-cooled up to 40˚C. In our experiments, when crystallizing sapphire with the emission of PeTa radiation, super-cooling temperature reached 65˚C. Our experiments on the observation of the PeTa effect during the crystallization of sapphire and 7 alkali-halide crystals are described in papers [14] [15] [16] [17], and we present here very impressive results of other researchers from papers [18] [19] [20] who described recording of the IR emission under crystallization from the melt of substances with low (less than 60˚C) melting points Tm: sodium thiosulphate pentahydrate (STSP), 2-methyl-2-propanol (2M2P), and 4-n alkyl-4 cyanofenil (4A4C). In comparison with other above-mentioned substances, low melting points relieved recording of non-equilibrium radiation because of the absence of intensive Plank’s background. The influence of crystallization and cooling regimes on integral IR radiation of the compounds was investigated. The melting points Tm and molar latent melting heat Lm, respectively, for these substances, are: 48.5˚С, 23.4 kJ/mol―for STSP; 25.5˚С, 6.8 kJ/mol―for 2M2P; and 57˚С, 5.3 kJ/mol―for 4A4C. Integral radiation was recorded with a cryogenic detector FSG-22-3A2 of high sensitivity (500 V/W) in the range of 2.5 - 10.0 μm. With respect to Formula (1), the maximum of the one-photon PeTa radiation corresponds to: = 5.1 μm―for STSP; = 17.7 μm―for 2M2P, and = 22.6 μm―for 4A4C. A priori, it is clear that with FSG detector only during crystallization of STSP, the authors had a chance of the PeTa radiation recording, if there is no higher harmonics for other two substances. In reality, and so it turned out that only for STSP the PeTa radiation was found.
Fortunately, crystal and melt of STSP are rather transparent in the range near 5.1 μm―expected maximum of the PeTa radiation. The substances were melted in a cylindrical aluminium cuvette of 27 mm diameter with thin walls. A volume of every specimen was 8 cm3. Thus, the thickness of a melt layer was 14 mm. Crystallization began from the bottom of the cuvettes that was touching water kept at regulated temperature. Figure 4 presents time dependence of integral flow P of IR radiation from the surface of the STSP specimen during melting (a', B', and σ') and crystallization (a, B, and σ) for different temperature ranges (а, а'―between 7˚С and 63˚С; B, B'―between 13˚С and 60˚С; σ, σ'―heating of the melt to 61˚С with subsequent super-cooling up to 15˚С). The curves a', B', and σ' of integral intensity during heating of the specimens as well as the curve “a” of integral intensity during cooling of the specimens from 63˚С do not have any peculiarities. On the other hand, rather intensive nonequilibrium IR radiation was recorded under crystallization of STSP melt from the temperature 60 ˚С (curve σ) and, especially, from the melt super-cooled on 15˚С (curve B). No similar effect was found during crystallization of 2M2P, and 4A4C specimens.
To clarify a shape of the infrared peak, differential measurements were carried out. For this, two identical cuvettes with STSP substances were used, but a surface of the specimen in one of the cuvettes was covered with a thin blackened copper foil. Both specimens were melted and crystallized in the same regime identical to the curve B (Figure 4). The integral flow of the blackened specimen was subtracted from the integral flow of the ordinary specimen. Time dependence of a resulting differential flow δP is presented on Figure 5. It is interesting
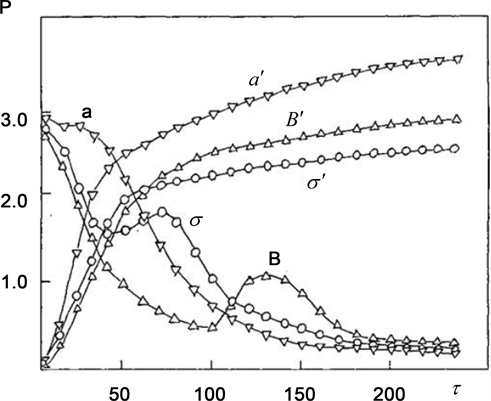
Figure 4. Integral flux P (10−3 W cm−2) of IR radiation versus time τ (seconds) from the sample surface during the melting and crystallization of STSP under changing cooling and heating conditions: a (∇) and a' (∇) is cooling and heating between 7 and 63˚C, σ (ᴑ) and σ' (ᴑ) is cooling and heating between 13 and 60˚C, B' (Δ)―heating to 61˚C, B (Δ)―cooling with supercooling of the melt on 15˚C.
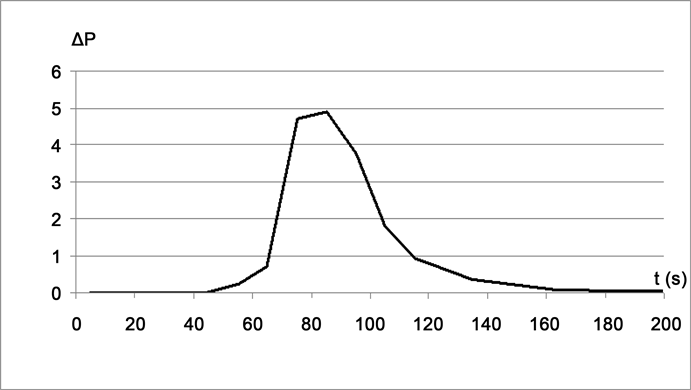
Figure 5. PeTa radiation from the crystallizing sample of STSP: δP (W m−2) versus t (seconds).
to note that the shape of the radiation peak (Figure 5) is similar to the peak of the PeTa radiation from crystallizing sapphire [14] : the intensity is sharply increased and is slowly abated. A time dependence of the temperature of the surface of STSP specimen during crystallization was measured. It was an ordinary dependence for crystallization of super-cooled melt. At the moment of the temperature increase when crystallization had been finished the intensity of the PeTa radiation was equal to zero.
4.2. Vapour-Solid Transition
At equilibrium pressure, the vapour is in dynamic equilibrium with the surface of the solid. If the vapour pressure is above equilibrium, the vapour will be deposited on the surface of the solid. Under small supersaturation, the process passes slowly and the liberated heat of deposition is removed by thermal conductivity (figurative point M on Figure 5). But if the supersaturation is large, deposition occurs quickly, and the heat of deposition is removed by the PeTa radiation (figurative point N in Figure 3). In our previous paper [2], we described our experiments on recording PeTa radiation in the precipitation of water vapor contained in air on the surface of cooled by liquid nitrogen ice. Integral radiation intensity increased with decreasing surface temperature.
5. Cavity-Free Pulsed Laser on the Basis of CL/MBSL/SBSL
PeTa model states that in the processes considered here, SL/MBSL/SBSL/LIBLE, the vapor is in the supercooled state inside the bubble before the flash. All atoms/molecules and clusters are united in a single system by the electromagnetic field of interaction. During the flash, the excitation energy of all particles of the cloud is instantaneously released. We described in detail all these processes in our previous paper [2] based on the analogy with super-radiation. Now we compare this process with laser radiation. It is obvious that in many respects, our system is similar to a cavity-free pulsed laser. The difference lies in the fact that the radiation is nonmonochromatic and incoherent because the system contains several types of excited particles that emit simultaneously. But the aggregate of homogeneous particles emits monochromatic and coherent radiation.
Imagine a system of SL/MBSL/SBSL in which only molecules/atoms of vapour are contained, and there are no clusters. In fact, such a system will be a natural cavity-free laser. For all possible liquids, this radiation will be in a relatively far IR region and, consequently, will be absorbed by the liquid. But it is possible to form bubbles near walls of the vessel that is transparent for this range of radiation, or make an ultrasonic horn from a transparent material and, thus, to obtain a working laser. Furthermore, the SL in molten metals was observed through the transparent horn [21] . We have already mentioned about the possibility of making a laser based on the PeTa effect [22] . In the case of CL/MBSL/SBSL, nature itself provides such an opportunity. From this point of view, all other cases of CL/MBSL/SBSL/LIBL can be interpreted as the simultaneous emission of several cavity-free pulsed lasers. The number of these lasers is equal to the number of types of particles (atoms/molecules and clusters) participating in the radiation.
It is obvious that in all considered cases of PeTa radiation―melt crystallization and vapour deposition, the recorded IR radiation peaks consist of a set of pulses similar to CL/SBSL/MBSL/LIBL.
6. Conclusions
In this paper, we continue the development of the PeTa model for CL/SBSL/MBSL/LIBL:
1) Based on this model, LIBL in cryogenic liquids is analysed. For each of the bands of the LIBL spectrum in liquid argon, a cluster responsible for its emission is calculated.
2) All the investigated processes CL/MBSL/SBSL/LIBL are presented on the solid-liquid-vapour phase diagram. This concept―VBL (vapour bubble luminescence) allows us to clearly understand the unified physical nature of these processes.
3) Other 2 cases of PeTa radiation (under the crystallization of melts and under vapour deposition) are also presented in this phase diagram. This allows us to clearly understand the place of CL/MBSL/SBSL/LIBL in the general picture of PeTa radiation.
4) We show that in many respects the systems under investigations, CL/MBSL/SBSL/LIBL, are similar to cavity-free pulsed lasers. The difference lies in the fact that the radiation is nonmonochromatic and incoherent. But the aggregate of homogeneous particles emits monochromatic and coherent radiation. If we exclude the formation of clusters in the system, we will get a natural cavity-free pulsed laser.
5) The design of such a laser is proposed.
Cite this paper
Tatartchenko, V.A. (2018) Sonoluminescence as the PeTa Radiation, Part Three. Optics and Photonics Journal, 8, 187-200. https://doi.org/10.4236/opj.2018.86017
References
- 1. Tatartchenko, V.A. (2017) Sonoluminescence as the PeTa Radiation. Optics and Photonics Journal, 7, 27-55. https://doi.org/10.4236/opj.2017.72004
- 2. Tatartchenko, V.A. (2017) Sonoluminescence as the PeTa Radiation, Part Two. Optics and Photonics Journal, 7, 197-220. https://doi.org/10.4236/opj.2017.711019
- 3. Ravilous, K. (2010) Cloud Power. New Scientist, 208, 38-41. https://doi.org/10.1016/S0262-4079(10)62951-X
- 4. Perel’man, M.E. and Tatartchenko, V.A. (2007) Phase Transitions of the First Kind as Radiation Processes. 1-17. https://arxiv.org/ftp/arxiv/papers/0711/0711.3570.pdf
- 5. Perel’man, M.E. and Tatartchenko, V.A. (2008) Phase Transitions of the First Kind as Radiation Processes. Physics Letters A, 372, 2480-2483. https://doi.org/10.1016/j.physleta.2007.11.056
- 6. Tatartchenko, V.A. (2009) Some Peculiarities of First Order Phase Transitions. Reviews on Advanced Materials Science, 20, 58-69.
- 7. Ayad, M. (1971) Electromagnetic Radiation during Ultrasonic Cavitation. Infrared Physics, 11, 249. https://doi.org/10.1016/0020-0891(71)90027-3
- 8. Baghdassarian, O., Chu, H.C., Tabbert, B. and Williams, G.A. (2001) Spectrum of Luminescence from Laser-Induced Bubbles in Water and Cryogenic Liquids. CAV2001: Fourth International Symposium on Cavitation, Pasadena, 20-23 June 2001, 1-7.
- 9. Yeletsky, A.V. and Smirnov, B.M. (1989) Properties of Cluster Ions. Soviet Physics Uspehi, 159, 45-78. https://doi.org/10.3367/UFNr.0159.198909b.0045
- 10. Ding, A. and Hesslich, J. (1983) The Abundance of Ar and Kr Microclusters Generated by Supersonic Expansion. Chemical Physics Letters, 94, 54-57. https://doi.org/10.1016/0009-2614(83)87209-1
- 11. Northby, J.A. (1987) Structure and Binding of Lennard-Jones Clusters: 13 ≤ N ≤ 147. The Journal of Chemical Physics, 87, 6166. https://doi.org/10.1063/1.453492
- 12. Roy, L. (2002) Johnston Atomic and Molecular Clusters. Taylor and Francis, London, NY.
- 13. Dicke, R.H. (1954) Coherence in Spontaneous Radiation Processes. Physical Review, 93, 99-110. https://doi.org/10.1103/PhysRev.93.99
- 14. Tatarchenko, V.A. and Umarov, L.M. (1980) Infrared Radiation Accompanying the Crystallization of Sapphire. Soviet Physics, Crystallography, 25, 748-749.
- 15. Tatarchenko, V.A. (1979) Appearance of Distinguishing Features in Emission Spectra during Crystallization of Substances Transparent in the IR Region. Soviet Physics, Crystallography, 24, 238-239.
- 16. Umarov, L.M. and Tatarchenko, V.A. (1984) Differential Spectra of Crystallization Radiation of Alkali-Metal Halides. Soviet Physics, Crystallography, 29, 670-673.
- 17. Tatartchenko, V.A. (2008) Characteristic IR Radiation Accompanying Crystallization and Window of Transparency for It. Journal of Crystal Growth, 310, 525-529. https://doi.org/10.1016/j.jcrysgro.2007.11.155
- 18. Dragun, V.L. and Stetyukevich, N.I. (1999) The Influence of Crystallization and Melting on the IR Radiation Matter Properties within the Temperature Range from 300 to 330 K. Proceedings of the National Academy of Sciences of Belarus, Series of Physical-Technical Sciences, 4, 134-136. (In Russian)
- 19. Dragun, V.L. and Stetyukevich, N.I. (2000) IR Emission Characteristics of Crystalline Hydrates in Melting and Crystallization. In: Proceedings of 4th Minsk International Forum on Heat & Mass Exchange, Vol. 2, Academy of Sciences of Belarus, Minsk, 121-124. (In Russian)
- 20. Dragun, V.L., Stetyukevich, N.I., Khil’ko, M.V. and Vasetskiy, V.A. (2004) Effect of Heat Transfer Conditions on the IR-Radiation in the Processes of Crystallization and Melting. In: Proceedings of 5th Minsk International Forum on Heat & Mass Exchange, Vol. 2, Academy of Sciences of Belarus, Minsk, 181-188. (In Russian)
- 21. Troia, A. and Ripa, D.M. (2013) Sonoluminescence in Liquid Metals. The Journal of Physical Chemistry C, 117, 5578-5583. https://doi.org/10.1021/jp311335m
- 22. Tatartchenko, V.A. (2009) Infrared Laser Based on the Principle of Melt Crystallization or Vapor Condensation. Why Not? Optics & Laser Technology, 41, 949-952. https://doi.org/10.1016/j.optlastec.2009.04.001