Optics and Photonics Journal
Vol.4 No.6(2014), Article ID:47049,7 pages
DOI:10.4236/opj.2014.46014
Holographic Imaging of Argon Plasma Images
Abdallah Mohamed Hamed, Mohamed Aly Saudy
Physics Department, Faculty of Science, Ain Shams University, Cairo, Egypt
Email: amhamed73@hotmail.com
Copyright © 2014 by authors and Scientific Research Publishing Inc.
This work is licensed under the Creative Commons Attribution International License (CC BY).
http://creativecommons.org/licenses/by/4.0/


Received 20 April 2014; revised 22 May 2014; accepted 16 June 2014
ABSTRACT
A coding and decoding process of argon plasma images using digital holography is proposed. The digital Fourier holography is applied to two images of matrix dimensions 512 × 512 pixels. The decoded images are improved using wiener filtering techniques. We have constructed three basic color images of the original image which is useful to extract the thermal distribution of the plasma image. Also, the profiles of the reconstructed images are checked showing better smooth profiles using wiener filter. The Mat-lab code is applied in the operation of image processing using Fourier techniques.
Keywords:Polychromatic Image Processing of Plasma Images, Fourier Holography, Wiener Filtering

1. Introduction
It is known that the input power and gas flow rate play a major role in controlling the plasma jet temperature, velocity and electron number density of the plasma jet [1] . An increase in input power considerably increased the electron number density while the gas flow rate did not show any significant effect. The Electron number density of the plasma jet, the corresponding temperature and the degree of ionization were determined using stark broadening of the Ar I (430.010 nm) line, the atomic Boltzmann plot method and the Saha equation, respectively [2] . A new visible-spectroscopy diagnostic exploits ion-beam-excited ArI transitions to measure the time-resolved plasma electron density (1015 cm−3 - 1016 cm−3) and temperature (1 - 2 eV) during the initial breakdown phase [2] . Stark broadening and line intensity ratios are used as diagnostics after the plasma forms. Also, the plasma properties of a DC pseudo-discharge have been discussed in helium as a working gas [3] .
Normally, vacuum or rare gases such as argon and helium are used to prevent electrode erosion. In a recent work, the arc length of plasma was measured using image processing on arc length pictures taken with a highspeed video camera. Thereby, the lengths and positions of the arc are determined over time [4] .
An improved reconstruction from the Fourier hologram using a spatial light modulator (SLM) was investigated. The method is based on applying a digital pre-filtering of the SLM’s encoded distribution to compensate the signal distortion caused by the SLM’s finite pixel size [5] .
In this paper, processing of the plasma images using Fourier holograms [6] -[15] for the sake of coding and decoding the image. Improved reconstructed plasma images are obtained using Wiener filtering. Profiles of the reconstructed images in both cases before filtering and after filtering are investigated.
2. Holographic Analysis
The argon plasma image is recorded numerically as a Fourier hologram using Mat Lab code as follows: Firstly, a color diffuser of the same dimensions like the rescaled plasma colored image of dimensions 512 × 512 pixels is constructed numerically. Secondly, the multiplication of both the plasma colored image and the colored diffuser is Fourier transformed numerically to get the holographic color interference image. This hologram is the convolution product of the Fourier transform of the colored plasma image and the colored speckle pattern. It is known that the colored speckle distribution is the Fourier transform of the colored diffuser function. Thirdly, the inverse Fourier transform is operated upon the described colored hologram to get the reconstructed colored images of plasma.
The two Fourier transform operations are summarized as follows:
1st step (recording amplitude and phase of the color hologram)
The complex amplitude of the colored image is analytically represented as:
 (1)
(1)
The colored image is numerically written as follows:
 (2)
(2)
where the continuous variables (x, y) are replaced by numerical values as follows:
x = m ∆x and y = n ∆y;

The above colored image is decomposed into the three principal components red, green, and blue.
The monochromatic components are written as follows:
 (3)
(3)
The digital colored diffuser is written as follows:
 (4)
(4)
where rand is a random value between 0 and 1 and
 is the amplitude weighting factor. If the image has square dimensions of 2 cm height
and 2 cm width and the diffuser has the same dimensions, then Dx = Dy = 18 μm.
is the amplitude weighting factor. If the image has square dimensions of 2 cm height
and 2 cm width and the diffuser has the same dimensions, then Dx = Dy = 18 μm.
The complex amplitude of the Fourier hologram is obtained by operating the FFT upon the multiplication product of the two matrices represented in Equation (2) and Equation (4).
Hence, the complex amplitude of the hologram
 is represented as follows:
 (5)
(5)
where (u, v) are the spatial coordinates in the Fourier plane and * is a symbol for the convolution product.
2nd step (reconstruction process of inverse Fourier transform)
 (6)
(6)
where (x', y') represent the Cartesian coordinates in the imaging plane or the reconstruction plane for the wavelength l corresponding to the polychromatic illumination. In the particular case of monochromatic illumination, the colored holographic and the reconstruction images are independent on the wavelength and we get Equation (5) and Equation (6) as:
 (7)
(7)
 (8)
(8)
The holographic image represented by Equation (7), and the reconstruction image
Equation (8) are valid for monochromatic illumination. The numerical reconstruction
images are of maximum dimensions at
 and
and
 for the matrix of dimensions 1024 × 1024 pixels.
3. Results and Discussion
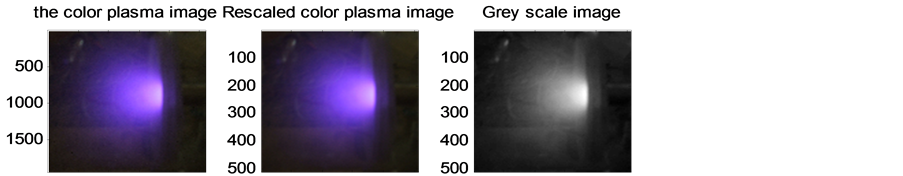
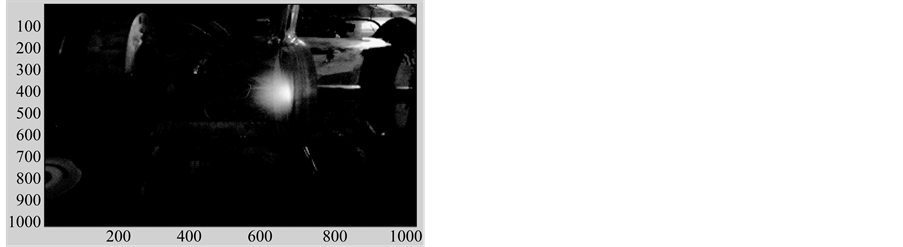
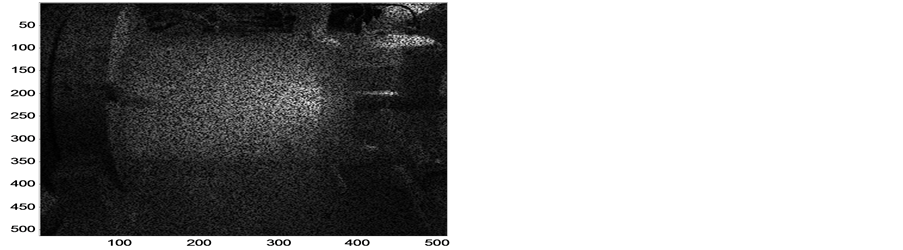
The colored plasma image photographed at current 5A in the Laboratory, by a CCD camera has dimension of 1900 × 2500 pixels is shown in Figure 1(a) and rescaled at dimensions of 512 × 512 pixels which is used in the polychromatic processing and coding is shown as in Figure 1(b). A gray scale Plasma image of argon plasma of dimensions 512 × 512 pixels is shown in Figure 1(c) is also used for monochromatic processing.
The monochromatic components of the colored plasma image shown in Figure 1(b) are represented as shown in Figure 2(a) for the red color, Figure 2(b) for the green color, and Figure 2(c) for the blue color. These principal components of colors namely red, green, and blue form all colored images with different proportions of colors which present in the image. The white image is formed from the following combinations as follows:
Z = 0.299R + 0.587G + 0.114B (9)
where “R” refers the red spectral component, “G” refers to the green component, while “B” stands for the blue spectral component of the color.
It is shown, referring to Figure 2(a), Figure 2(b), Figure 2(c), that the central region to the right is darker than the other regions which means that all colors may be present in this region. The colored regions appeared in all images showing spectrum variation from the red passing through sharp yellow region to green band. It is shown that the band of each colored region is shifted towards the left for the blue color image as shown in Figure 2(c) which is attributed to the magnification ratio of wavelengths.
 500 1000 1500 2000 2500
100 200 300 400 500 100 200 300 400 500 (a) (b) (c)
500 1000 1500 2000 2500
100 200 300 400 500 100 200 300 400 500 (a) (b) (c)
Figure 1.In the left, the original colored photo of the Argon plasma of dimensions 2500 × 1900 pixels is shown, in the middle is the rescaled image of dimensions 512 × 512 pixels, while in the right is the gray scale image of the dimensions 512 × 512 pixels.
 (a) (b) (c)
Figure 2. The rescaled plasma images for the red, green, and blue components of the colored image.
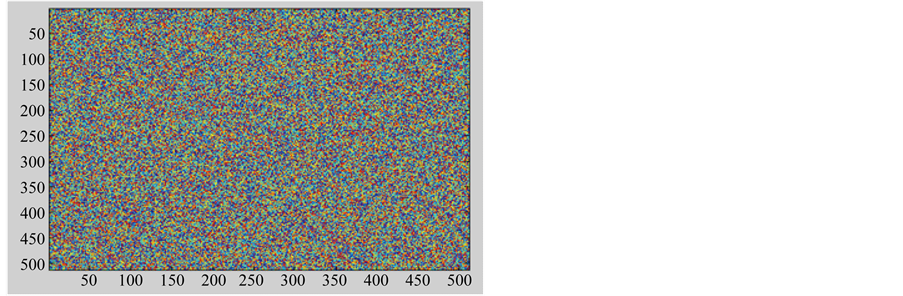
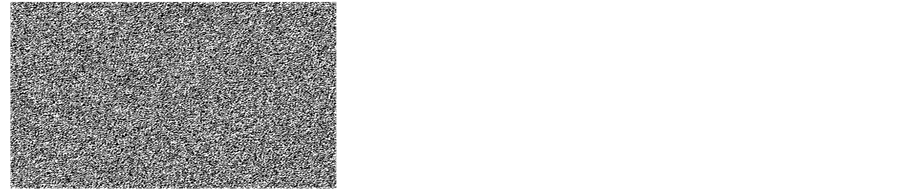
The coding and decoding processes are outlined as in Figures 3-6. The color diffuser used for the hologram recording is numerically plotted as in Figure 3(a) and the gray scale diffuser is shown in Figure 3(b). Before the recording of the Fourier hologram, the plasma image is coherently multiplied by the complex amplitude of the diffuser as shown in Figure 4(a) for the red component of the image and Figure 4(b) for the gray scale image.
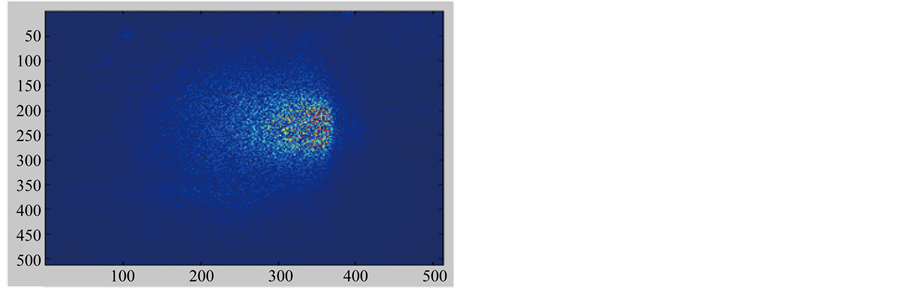
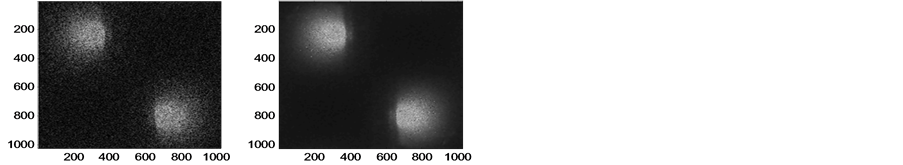
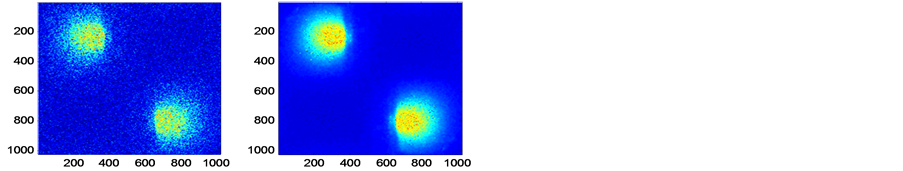
Hence, the Fourier hologram is obtained by operating the Fourier transform upon the above multiplication as shown in Figure 5. The Figure 5(a) is the Fourier hologram for the red component of the image while Figure 5(b) is the hologram for the gray scale image. The reconstruction process will give two conjugate red images are shown in Figure 6(a) and gray scale images are shown in Figure 6(b). They are obtained by operating the inverse Fourier transform upon the complex amplitude of the hologram. It should be noted that the intensity axis is rescaled for all images to be 512 × 512 pixels and Mat Lab code is written for all processes of plasma images photographed in the laboratory by CCD camera. It is clear that the conjugate reconstruction images will give a matrix two times the dimension of the hologram matrix, namely 1024 × 1024 pixels. Improved images using a sequence of wiener filters are shown on the Figures 6(a), (b). It is shown that the background noise appeared in the reconstructed images is suppressed in the filtered images.
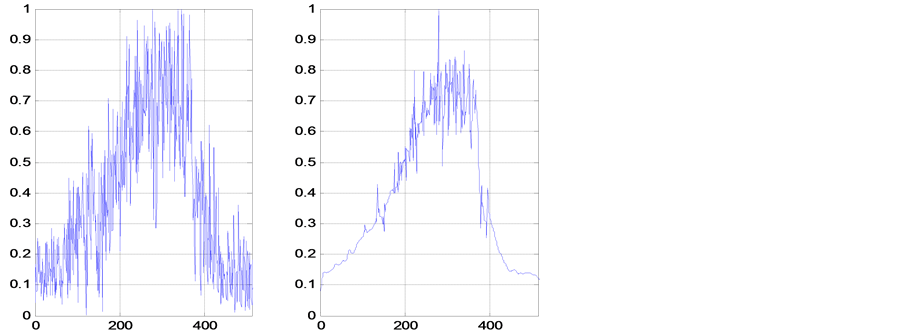
Referring to the Figure 6(b) and its corresponding profile shape shown in Figure 7(b) the noise is nearly removed from the image in the right image as compared with ordinary reconstruction with a noise for the image shown in the left.
Another reconstruction process for the argon plasma image taken at current 2.5A obtained from the hologram is shown in Figures 8(a)-(e). In Figure 8(d) reconstructed images are shown without filtration and with filtra-
 (a)
(a)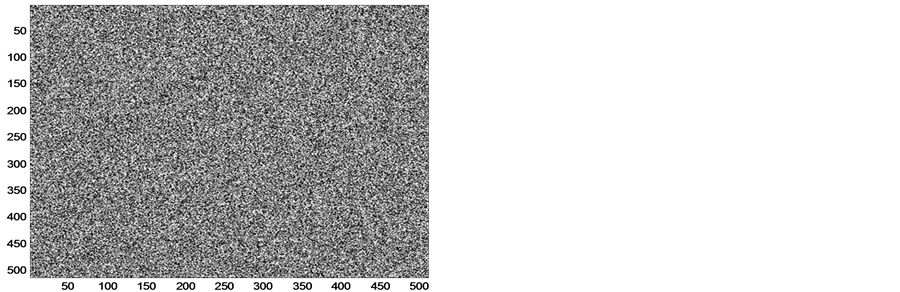 (b)
(b)
Figure 3. (a) The color diffuser used for the hologram recording. (b) The gray scale diffuser used for the hologram recording.
 (a)
(a)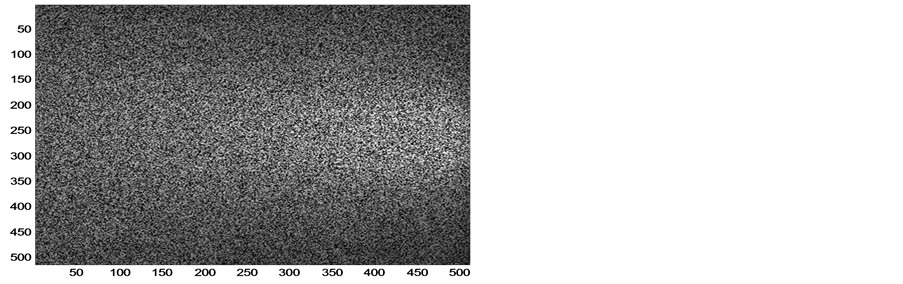 (b)
(b)
Figure 4. (a) Coherent multiplication of complex amplitude of the diffuser and the plasma image for red image shown in Figure 2(a); (b) Coherent multiplication of complex amplitude of the diffuser and the plasma gray scale image shown in Figure 1(c).
 (a)
(a)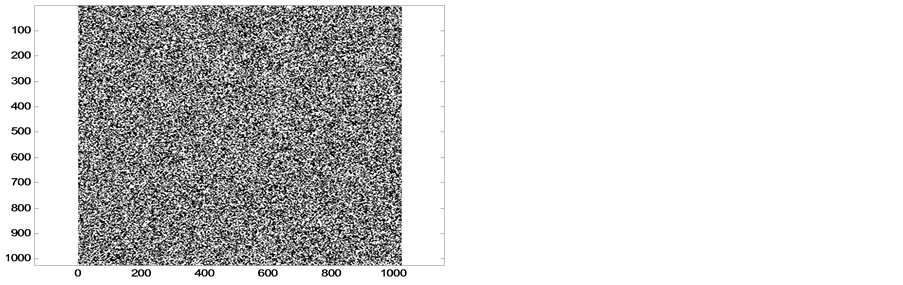 (b)
(b)
Figure 5. (a): The Fourier hologram of the red component of the plasma image of dimensions 1024 × 1024 pixels. (b) The Fourier hologram of the gray scale plasma image of dimensions 1024 × 1024 pixels.
 (i) (ii) (i) (ii) (a) (b)
Figure 6. (a) Reconstruction process giving two conjugate red plasma images: (i) Before filtration; (ii) after using Wiener filtration; (b) Reconstruction process giving two conjugate gray scale plasma images: (i) Before filtration; (ii) after using Wiener filtration.
 (a) (b)
Figure 7. In the left, the profile of the reconstructed plasma image is shown in the left side of Figure 6(b) without applying the Wiener filters. A random noise is covering the whole image. In the right, the profile of the reconstructed plasma image is shown in the right side of Figure 6(b) after applying the Wiener filters. The random noise is minimized over the whole image. The two shapes are taken at the same section at 256 pixels.
tion for polychromatic images. While in Figure 8(e) the reconstructed images are for the gray scale image. It is shown that the image contrast is improved when applying the wiener filter and the noise distortions are again removed from the whole image. The profile of the reconstructed image in absence of filter is shown in Figure 9(a) showing a great noise as compared with the filtered smooth image shown in Figure 8(e) and its corres-
 (a) (b)
 (c)
(c)
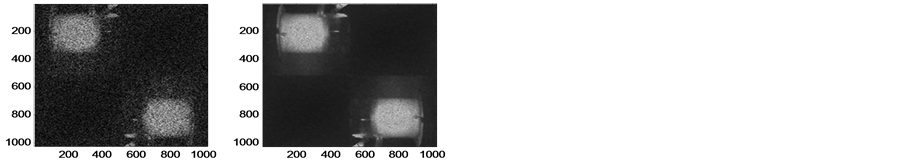
 (i) (ii) (i) (ii) (d) (e)
Figure 8. (a) Argon plasma image taken at different current 2.5 A. (b) Coherent multiplication of the Argon plasma image and a diffuser; (c) The Fourier hologram of the diffused Argon plasma image; (d): Reconstruction process giving two conjugate red plasma images: (i) Before filtration (ii) after using Wiener filtration; (e) Reconstruction process giving two conjugate gray scale plasma images: (i) Before filtration (ii) after using Wiener filtration.
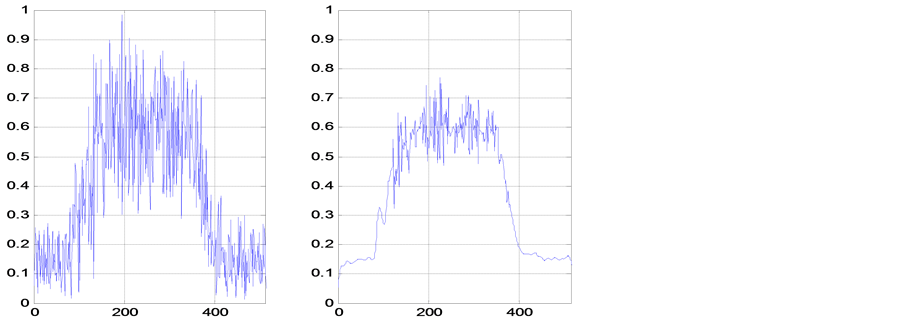
Figure 9. In the left, the profile of the reconstructed plasma image is shown in the left side of Figure 8(e) without applying the Wiener filters. A random noise is covering the whole image. In the right, the profile of the 2nd reconstructed plasma image shown in the right side of Figure 8(e) after applying the Wiener filters. A random noise is minimized over the whole image. The two profiles are taken at the same section at 256 pixels.
ponding profile at 256 pixels.
4. Conclusion
The processing of argon plasma images using Fourier holograms is presented for the first time. The wiener filtration is applied to the reconstructed images in order to improve the images and suppress the background additive noise. Hence, the reconstructed plasma images are improved after using the wiener filter. Also, the spectral red, green, and blue basic components of the colored image have distributions in the image proportional to the amount of the color present in the image. The intensity distribution in the image is proportional to the thermal distribution of the plasma.
References
- Yugeswaran, S. and Selvarajan, V. (2006) Electron Number Density Measurement on a DC Argon Plasma Jet by Stark Broadening of Ar I Spectral Line. Vacuum, 81, 347-352.
- Bailey, J.E., Chung, H.K., et al. (1999) Spectroscopic Measurements of Argon Plasma Formation by a High-Intensity Lithium Ion Beam. Physical Review Letters, 82, 739-742. http://dx.doi.org/10.1103/PhysRevLett.82.739
- Saudy, M.A., Eatah, A.I. and Masoud, M.M. (2005) Characteristics of Dc Pseudo-Electric (Virtual Cathode) Discharge in Helium Gas. Fizika A, 14, 225-232.
- Iwao, T., Nemoto, A., Yumoto, M. and Inaba, T. (2005) Plasma Image Processing of High Speed Arc Movement in a Rail-Gun. IEEE Transactions on Plasma Science, 33, 430-431. http://dx.doi.org/10.1109/TPS.2005.845292
- Agour, M., Falldorf, C. and von Kopylow, C. (2010) Digital Pre-filtering Approach to Improve Optical Reconstructed Wavefields in Opto-Electronic Holography. Journal of Optics, 12, 1-7.
- Goodmann, J.W. (2005) Introduction to Fourier Optics and Holography. 3rd Edition, Roberts & Company Publishers, Greenwood Village.
- Hamed, A.M. (1983) Polychromatic Image Processing Using Thick Holographic Multiplexed Filter. Optica Applicata, X111, 205-213.
- Bracewell, R.N. (1978) Fourier Transform and Its Applications, Chap. 18. McGraw-Hill, New York.
- Macgregor, A.E. (1992) Computer generated holograms from dot matrix and laser printers. American Journal of Physics, 60, 839-846. http://dx.doi.org/10.1119/1.17067
- Trester, S. (1996) Computer Simulated Holography and Computer Generated Holograms. American Journal of Physics, 64, 472-476. http://dx.doi.org/10.1119/1.18194
- Pedrini, G., Schedin, S. and Tiziani, H.J. (1999) Lensless Digital Holographic Interferometry for Measurement of Large Objects. Optics Communications, 171, 29-36. http://dx.doi.org/10.1016/S0030-4018(99)00486-1
- Wagner, C., Seebacher, S., Osten, W. and Jüptner, W. (1999) Digital Recording and Numerical Reconstruction of Lensless Fourier Holograms in Optical Metrology. Applied Optics, 38, 4812-4820. http://dx.doi.org/10.1364/AO.38.004812
- Bovik, A.C. and Acton, S.T. (2000) Basic Linear Filtering with Application to Image Enhancement. In: Bovik, A.C., Ed., Handbook of Image and Video Processing, Academic Press, San Diego.
- Agour, M., Kolenovic, E., Falldorf, C. and von Kopylow, C. (2009) Suppression of Higher Diffraction Orders and Intensity Improvement of Optically Reconstructed Holograms from a Spatial Light Modulator. Journal of Optics A: Pure and Applied Optics, 11, Article ID: 105405. http://dx.doi.org/10.1088/1464-4258/11/10/105405
- Hamed, A.M. (2011) Scanning Holography Using a Modulated Linear Pupil: Simulation. Optics and Photonics Journal, 1, 52-58.