Journal of Tuberculosis Research
Vol.2 No.1(2014), Article ID:44052,14 pages DOI:10.4236/jtr.2014.21003
Modeling Severity of Tuberculosis as a Multiple Cause of Death in South Africa
Ntonghanwah Forcheh1, Keamogetse Setlhare 1, Alphonse K. A. Amey2
1Department of Statistics, University of Botswana, Gaborone, Botswana
2Department of Applied Sciences, BIUST, Palapye, Botswana
Email: Forchenn@mopipi.ub.bw, Setlhark@mopipi.ub.bw, ameya@biust.ac.bw
Copyright © 2014 by authors and Scientific Research Publishing Inc.
This work is licensed under the Creative Commons Attribution International License (CC BY).
http://creativecommons.org/licenses/by/4.0/


Received 11 December 2013; revised 15 January 2014; accepted 24 January 2014
ABSTRACT
The multiple cause of death (MCOD) analysis is used to account for the full contribution of TB as a cause of death to South African mortality in 2008 that were coded using ICD10. Following a review of MCOD methods, a sufficient set of variables for use in MCOD and a new method of quantifying the severity of each cause of death are proposed. The results show that a total of 86,818 (14.3% of all deaths) were TB related, and within all deaths due to natural underlying causes, 86,373 (16.1%) were TB related. Furthermore, 42,581 (7.9%) were due to TB only, 6.0% had TB as an underlying cause along with other contributory causes and 2.0% had TB as a contributory cause. TB was mentioned as the underlying cause of death in 74,863 certificates or 13.9% of deaths due to natural underlying causes. Further analysis using multinomial baseline logit models, reveals that the relative odds of death in any demographic group compared with death in the baseline categories depend on the severity level of TB considered. It is proposed that the severity measure should be adopted when studying the contribution of all main causes of death to total mortality.
Keywords:Contributory Cause of Death; Multinomial Logit Baseline Model; South African MCOD

1. Introduction
A great deal of research has been conducted on causes of death, and, in particular, the prevalence of specific causes of death in different populations and cohorts. Understanding which causes of death are most prevalent in a given population cohort is important in resource allocation for prevention and treatment. Mortality data play a major role in vital statistics and may provide more reliable information on morbidity conditions at local, national and regional levels than morbidity data. As observed in a 1989 editorial in the American Journal of Public Health [1] , mortality data are also useful in identifying health problems and to monitor health programs due to lack of comparable morbidity data at sub-national level.
In Southern Africa, TB, pneumonia and ill-defined conditions have dominated the major causes of mortality and morbidity for decades, and from the mid-1990s, these were joined by HIV/AIDS. The World Health Organization [2] highlights the severity of TB and HIV by stating that Tuberculosis (TB) is second only to HIV/AIDS as the greatest killer worldwide due to a single infectious agent, and that 8.8million people fell ill with TB and 1.4 million died from TB in 2010, while about 10 million children were orphaned as a result of TB deaths among parents. Although the reliability of these “facts” is highly debatable, they still provide an indication of the severity of these two diseases as causes of death. The WHO further observes that HIV and TB form a lethal combination, each speeding the other’s progress. The need to continue to conduct research that focuses on these deadly killers whenever good quality data become available has therefore, not diminished by the volume of past research.
The WHO [2] has recommended that if the death registration data collected in vital registration systems are coded according to the International Statistical Classification of Diseases (ICD-10), then they provide the best source of data on measuring TB mortality. The WHO further observes that unlike HIV/AIDS that is always coded as the underlying cause of death when it is present, TB may be listed as one of the associated causes of deaths in vital registration systems but not recorded as the underlying cause of death. Since national statistics usually only consider the underlying cause of death [2] -[4] , they usually understate the number of deaths in which TB is a contributing cause. The South African multiple causes of death data set that are used in this paper, are coded using ICD-10 and hence provide a fairly reliable data set.
The objective of this study is to analyze TB mortality as a multiple cause of death phenomena using the 2008 South African multiple cause of death data. Specifically we seek to (1) compare the prevalence of TB as an underlying cause of death to TB as a multiple cause of death; (2) establish as to whether severity of TB as multiple cause of death differs in different socio-demographic groups compared to TB as an underlying cause of death.
2. Literature Review
Jansson et al. (1997) [5] analysed multiple cause of death data by computing the ratio of the number of times a condition has been registered as the underlying cause of death divided by the number of times it has been mentioned anywhere on a death certificate, for all the conditions investigated. They termed this ratio, “underlying cause proportion”. Treloar [6] insisted that the practice of tabulation of deaths by specific cause be extended to cover all causes mentioned on the death certificate. Treloar suggested the replacement of the concept of specific causes of death with a more realistic concept such as “terminal morbidity conditions” and that the traditional death rates computed using the underlying cause concept be replaced with a new class of rates that would define the relative frequency with which diagnosed diseases of sufficient importance appeared among those deceased. Erhardt [7] recommended that the prevalence of any cause of death should be analysed using the number of deaths in which that cause appears as an underlying cause (UC) as well as using the number of deaths in which the cause is mentioned, whether as underlying or not.
Using the United States mortality data for 1955 [8] , tabulated for selected diseases, the number of deaths for which each disease was coded as underlying and as contributory cause of death as well as the percentage of death certificates with which the disease was coded as underlying. They found that an average of 1.9 conditions were listed on each certificate and interpreted this as a measure of additional diagnostic information gained over use of single (underlying) cause of death. They also used the number underlying causes as a percentage of total (mentions) as a measure of information lost for each cause when only a single cause is reported. They further proposed the use of two sets of tabulation to report mortality data. The first, being a table that showed two frequencies for each diagnostic category, namely the number of certificates in which it is underlying (traditional table) and the number of certificates in which it is an associated or contributory cause—and not underlying. The second table should be used to describe the medical circumstances surrounding deaths, especially from chronic or degenerative diseases, and should indicate the frequency with which this group of diseases entered the death certificate.
Guralnick [3] undertook an exploratory study using data of all the deaths that occurred in the U.S. in 1955. She reported the total number of conditions coded on death certificates for all the 1,527,691 deaths reported for that year. Guralnick [3] further obtained the distribution of both the number of deaths and the total number of conditions coded using ICD 6 over the number of causes coded on the certificates. The distribution of the total number of deaths by total conditions coded per death certificate was also obtained for different race, gender and age cohorts. For selected main causes of death, the ratio of the total number of times that each cause was mentioned (A) to the number of times it appeared as an underlying cause (B), was found to range from 2.2 for asthma to 22.8 for malnutrition.
Speizer et al. [9] , used data coded from a one-third sample of death certificates in Massachusetts from January to June 1969. Following from Guralnick approach [3] , they obtained tables of frequencies for the number of underlying (U), number of mentioned and total number of times (T = U + C) that each of the selected causes of death appeared on the sampled death certificates as well as the ratio of U/T. The main cause of interest was cirrhosis and its associated causes. They found results to be consistent with those from a sample from the 1955 USA national data. Despite the demonstrated value of the multiple cause of death analysis, Speizer et al. cautioned that the value of such analysis in other diseases needed further assessment given the cost of generating multiple causes of death data from death certificates.
Wong et al. (1978) [10] suggested that a matrix of primary or underlying causes (UC)of death by contributory causes (CCs) could be used to give an overall picture of mortality patterns and that this matrix could serve as a scheme to identify disease combinations and facilitate the examination of proportional mortality ratios (PWR) by cause of death. Within each matrix, the ratio of the diagonal entry to the sum of the diagonal elements is equivalent to a PWR when no adjustment has been made for age.
White et al. (1989) [11] conducted a study of multiple cause of death in California between 1955 and 1980 using the number of times a specified cause is mentioned as underlying cause (UC), the number times it is mentioned as contributing cause (CC) and the total number of times it is mentioned (UC + CC) as a cause of death. They concluded that multiple causes of death data can provide further information on the prevalence of a fatal disease in a population and its relative role in contributing to mortality, and can also provide new information on diseases that contribute to deaths, which was not previously available in population-based studies of single cause of death.
Rushton [12] analysed the multiple cause of death data from death certificates of 35000 men employed for at least one year between 1-Jan 1950 and 31-Dec 1975 at eight oil refineries in the United Kingdom. The distribution of deaths at each refinery by the number of causes mentioned on each death certificate was used to compare mortality at the different sites. The prevalence of different causes of death were compared using the number of times each cause was mentioned as underlying (UC), the number of death certificates with each cause mentioned as contributory (CC), the total number of times a cause was coded (mentioned) on the death certificate (TC = UC + CC), the total number of conditions on the certificate with disease group as underlying and the ratio of TC:UC.
Data from the Italian National Vital Statistics Death Registry for 2001 was analysed for multiple cause of death by Frova, et al. [13] . The study was mainly descriptive in analysis, computing the average number of associated causes, and the ratio between the frequencies of a disease as underlying cause to the number of times the same disease occurs on death certificates. Cluster analysis was performed to provide a full picture on the most relevant relations between underlying and associated causes. The Multiple logistic regression model were performed on some underlying causes that the cluster analysis highlighted as strongly discriminating in identifying the group to estimate adjusted and interaction odds ratios for some diseases.
The Australian Bureau of Statistics [14] presents several methods that have been used in the literature (notably by Stallard, [15] ) to analyze multiple cause of death (MCOD) data. In order to compare the prevalence of selected diseases in the population, they used frequencies of the (i) number of times the specified cause occurs on death records (which they term “multiple causes”), (ii) number of deaths with any mention of specified cause of death (MC) and (iii) number of deaths where a specified cause is underlying (UC). They also computed the ratios of (iv) “multiple cause” to underlying cause; (v) “mentioned cause” to underlying cause and of (vi) “observed to expected joint frequency”. The first 2 ratios were used to determine the importance of multiple cause of death analysis over underlying cause analysis for selected diseases. The last ratio was used to measure the extent of the association between pairs of causes. The significance of the association was tested using Pearson chi-squared test of association for 2 × 2 tables.
3. Materials and Methods
3.1. Data Coding and Transformation
The format of the South African 2008 Multiple Cause of death data set is the same as that for 2006 and 2007 described in [16] . A full description is also available from Stat SA (2008) [17] .
This paper adopts a multiple cause of death methodology in studying TB deaths in South Africa where multiple cause of death refers to death in which two or more causes of death are listed on the certificate whether or not the distinction between underlying cause, immediate and associated causes has been well ascertained. Even so, this definition is incomplete. In ICD-10, causes of morbidity and mortality are coded using a letter and 4 digit numbers and are divided into main groups, broad groups, the broad and specific causes. The SA Data set reports causes of death using a letter and 2 digits, i.e. dropping the last 2 digits. The data set also specified the main group to which each underlying cause belongs to.
Main groups include infectious and parasitic diseases; neoplasm; diseases of the blood and immune mechanism; diseases of the nervous system; pregnancy, childbirth and puerperium. Broad groups are subsets of main groups, and correspond to what the general public understands as a cause of the death. For example, the main group of “certain infectious and parasitic diseases” that corresponds to ICD-10 codes A00-B99, is sub-divided into some 19 broad groups that include: intestinal infectious diseases (A00-A09); Tuberculosis (A15-A19, B90, U52, U52); Viral hepatitis (B15-B19); Human immunodeficiency virus [HIV] disease (B20-B24) and Sequelae of infectious and parasitic diseases (B90-B94). The distinction between these 3 categories of “causes of death” i.e. main groups, broad groups and specific causes is not usually made in the literature. Yet, as shown in the methodology, it is very important in understanding the coding and analysis of multiple causes of death data.
The data set includes the following background of the deceased when known: gender, age, marital status, province of birth, province of death, place of death, province of residence, education, usual occupation, type of business/industry, smoking status, month and year of death and whether autopsy was carried out on the deceased. From these, place of death, gender, age group, marital status, smoking status, method of death certification, type of work and education were included in the models. Occupation and others were not included because of a high percentage of missing values. It was desirable to include racial classification since certain causes of morbidity and mortality are known to differ by racial groups [18] but this information was not captured in the electronic data.
3.2. The Multiple Causes of Death Measurements/Indicators
The traditional single cause of death analysis focuses on the extent to which a specified cause contributes to mortality as a single, usually underlying cause of death. As can be observed from the reviewed literature, several ways of quantifying multiple cause of death essentially seek ways of accounting for the additional contribution of each cause of death when it is coded as contributory cause only. The following variables have thus been used in multiple causes of death analyses in the reviewed literature:
1) UC—Whether condition is the underlying cause or not 2) TC—Total times the condition is mentioned as a contributory cause 3) TA—Total number of conditions mentioned 4) MC—Whether the condition is a cause of death or not (mentioned as CC, UC or both)
5) CC—Whether the condition is mentioned as a contributory cause only 6) TM—Number of times the condition is mentioned either as UC, CC or both (this applies to cause groups only).
7) TO—Number conditions mentioned either as UC, CC or both, other than the condition of interest.
8) AM—Total number of conditions mention when condition of interest is UC.
We suggest the inclusion of a new variable to measure the severity of a given disease group to a specific mortality defined as:
9) Severity—Extend the condition of interest is a cause of death with categories given as: 0-not a cause, 1-contibutory cause only, 2-an UC with other associate causes, 3-condition is the only cause.
We define three variables which we refer to as the sufficient variable set for studying the contribution of a particular disease group to mortality under the multiple cause of death framework. Further, we show that each of the above 9 indicators of multiple cause of death can be expressed as a function of this sufficient set. Finally, we determine these variables for TB. The sufficient variable set comprises of:
(a) Total number of all conditions mentioned on the certificate (TNCM). This variable is computed whether the specified cause is mentioned or not. We denote it as 
(b) The specified cause is the underlying cause (UC) of death (Yes/No). We denote this as UC or  where
where  if specified cause is the underlying cause and 0-otherwise.
(c) Total number of times the specified cause group is mentioned as a contributory (TC) cause. We denote this as TC or 
The remaining variables reviewed above are computed from these three variables as shown.
(d) Number of times a specified cause is mentioned (TM) on a certificate .
.
(e) The specified cause is mentioned (MC) on certificate (Yes/No). This variable has been used in most of the literature as the definition of multiple cause of death and denoted by MC. We denote it by . Hence,
 . Where
  evaluates to 1 if true and 0 if false.
(f) The specified cause is a contributory cause (CC) only. This variable has been used in the literature as the definition for contributory or associate cause of death and denoted by CC. We denote it by . Thus if the disease group is the underlying cause of death, then
  even if other members of the group are listed as associated causes. Hence
  where
where  evaluates to 1 if true and 0 if false.
(g) Number of other conditions mentioned on certificate (TO). The other conditions could be mentioned as UC, CC or both. We denote this as  where
where .
.
(h) Total number of conditions mentioned when specified condition is the UC—if ,
,  This variable needs not be explicitly computed since a cross tabulation of
  and
and  will provide the required information.
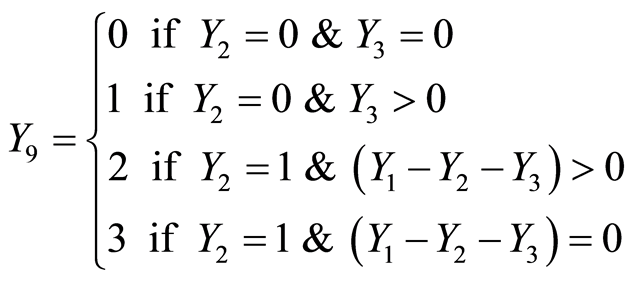
(i) Severity of specified condition towards death with categories coded as 0-if specified condition is not mentioned; 1—if it is mentioned as an associate cause only, 2—if it is mentioned as an underlying cause, along with other causes as associated causes, and 3—if it is the only cause group mentioned. We call this as “the severity of specified cause” and denote it as  where
where
The range of values of  and
and  depends on the total number of conditions coded from each certificate. For the South African data set, they each range from 0 to 5.
3.3. Modelling Severity of Tuberculosis as a Cause of Death
Severity of TB is defined as “Extent to which TB contributed to death”. This is an ordinal variable with categories given as: 0—not a cause of death (no contribution), 1—an associate cause of death (associate cause only); 2—an underlying cause with other associated causes; 3—The only cause of death mentioned.
Analysis of the cumulative frequencies of severity should enable us to assess the gains made in analysing cause of death from a multiple cause framework against the use of a single underlying cause of death framework. As discussed in the extensive literature on analysis of ordinal response variables [19] -[21] ,  could be modelled using one or more of the four models: the baseline category logit (BL) model, the cumulative logit (CL), adjacent category logit (AL) or the continuation ratio (CR) models.
The baseline and cumulative odds models are particularly useful as both enable us to directly compare the contribution of multiple cause of death over the single underlying cause. The baseline logit (BL) for the severity of TB given a vector of predictor variables  is defined by:

When using multinomial logit tool to fit the baseline model in SPSS, the baseline or reference category is taken to be the last category, and hence the SPSS notation is adopted here rather than that of Power and Xie [20] . The corresponding logits are obtained from  as
as , with the constraint that
 , hence
In our case elements of the vector of predictor variables,  are all categorical, and hence can only be entered into the models as dummy variables, each having its own reference group. For example, the first variableGender is entered using a single dummy variable (
 for male and 1 for female). The reference category is thus female. The contribution of gender in model
  is thus given by
 . The odd ratio,
  gives the relative odds of observing category
  rather than baseline category for males over females. For factor
  with
with  categories, the coefficient of the
  th dummy factor in model 1 is
  and
and  gives relative odds of a person in the
  th category dying with no TB present compared to a person in category k dying when only TB is present. Furthermore in model 2,
  gives the odds of a person in the
  th category dying when TB is present as a contributory cause only, compared with a person in category k dying when only TB is present. Finally in model 3,
  gives the odds of a person in the
  th category dying when TB is present as underlying along with other contributory cause, compared with a person in category K dying when only TB is present. The profile of odds;
 ,
,  and
and  provide a measure of the differential impact of severity of TB as a cause of death to a person in the
  th category of factor
  relative to a person in its K category. A graph of these odds against the category should be very useful.
4. Results
4.1. Preliminary Findings
A total of 606699 deaths were registered in South Africa in 2008. Of these, 539,123 (88.9%) were listed as due to natural underlying causes, 8.7% were due to non-natural underlying causes i.e. suicide, murder, etc. while the remaining 14,626 (2.4%) were still births. Of these total deaths, 364,349 (60.1%) were attributed to a single cause of death, while 26.7%, 9.9%, 2.7% and 0.7% of all deaths were attributed to 2, 3, 4 and 5 causes respectively. Among the 539,123 deaths due to natural causes, 305,842 (56.7%) were attributed to a single cause and a further 28.8%, 10.8%, 3.0% and 0.8% were attributed to 2, 3, 4 and 5 causes respectively.
A total of 86,818 (14.3% of all deaths) were TB related, and within all deaths due to natural underlying causes, 86,373 (16.1%) were TB related. Furthermore, 42,581 (7.9%) were due to TB only (severity level 3) and a further 32,282 (6.0%) had TB as an underlying cause along with other contributory causes (severity level 2). Hence TB was mentioned as the underlying cause of death in 74,863 certificates or 13.9% of deaths due to natural underlying causes.
TB was mentioned as a contributory cause in 11,955 certificates in which other causes were underlying (severity level 1). The distribution of the 74,863 deaths where TB was the underlying cause by specific type of TB was as follows: respiratory TB (84.1%), miliary TB (7.3%), TB of the nervous system (4.8%), multi-drug resistant TB (2.7%), and extensively drug resistant tuberculosis (1.0%) respectively. Table 1 shows the percentage of deaths due to TB as underlying cause compared to Natural underlying deaths by the Total Causes mentioned. The distribution of number of deaths in which TB was the underlying cause by the number of causes listed was very similar to the distribution of deaths in which all natural causes were listed as underlying cause. For example, 56.0% of the certificates in which TB was the underlying cause were attributed to a single cause and 29.9% were attributed to 2 causes compared with 56.7% and 28.8% respectively.
Figure 1 shows the distribution of all deaths and deaths due to natural underlying causes by gender. TB was the only cause of death in 7.6% of all male deaths compared to 6.4% of all female deaths. Considering only deaths due to natural underlying causes, TB was the only cause of death in 9.1% of male deaths compared to 6.8% of female deaths, and was not a cause of death at all in 82.0% percent of male deaths compared with 85.7% of female deaths. Hence TB was more severe among males than females.
Among deaths with TB as the underlying cause, the age group 0 - 4 years tend to have the most conditions coded followed by age group 5 - 14 years. The other age groups had similar number of conditions coded when TB was underlying. For example, when TB is underlying, 39.9% of deaths among 0 - 4 years were attributable to one condition while 28.4% to 3 or more conditions. The corresponding percentages for age group 5 - 14 years were 48.7% and 20.8% respectively. For older age groups, the percentage of deaths attributed to a single condition ranged from 55.8% to 60.5% with no pattern, while the percentage of deaths attributed to 3 or more conditions ranged from 13.6% to 13.8%.
4.2. Association between Severity of Tuberculosis and Background Characteristics
Table 2 shows the distribution of severity of TB by various background characteristics of the deceased. The bivariate association between severity of TB and each of the 8 factors shown in the table were highly significant (p

Table 1. Percent distribution of deaths by number of causes listed and age.
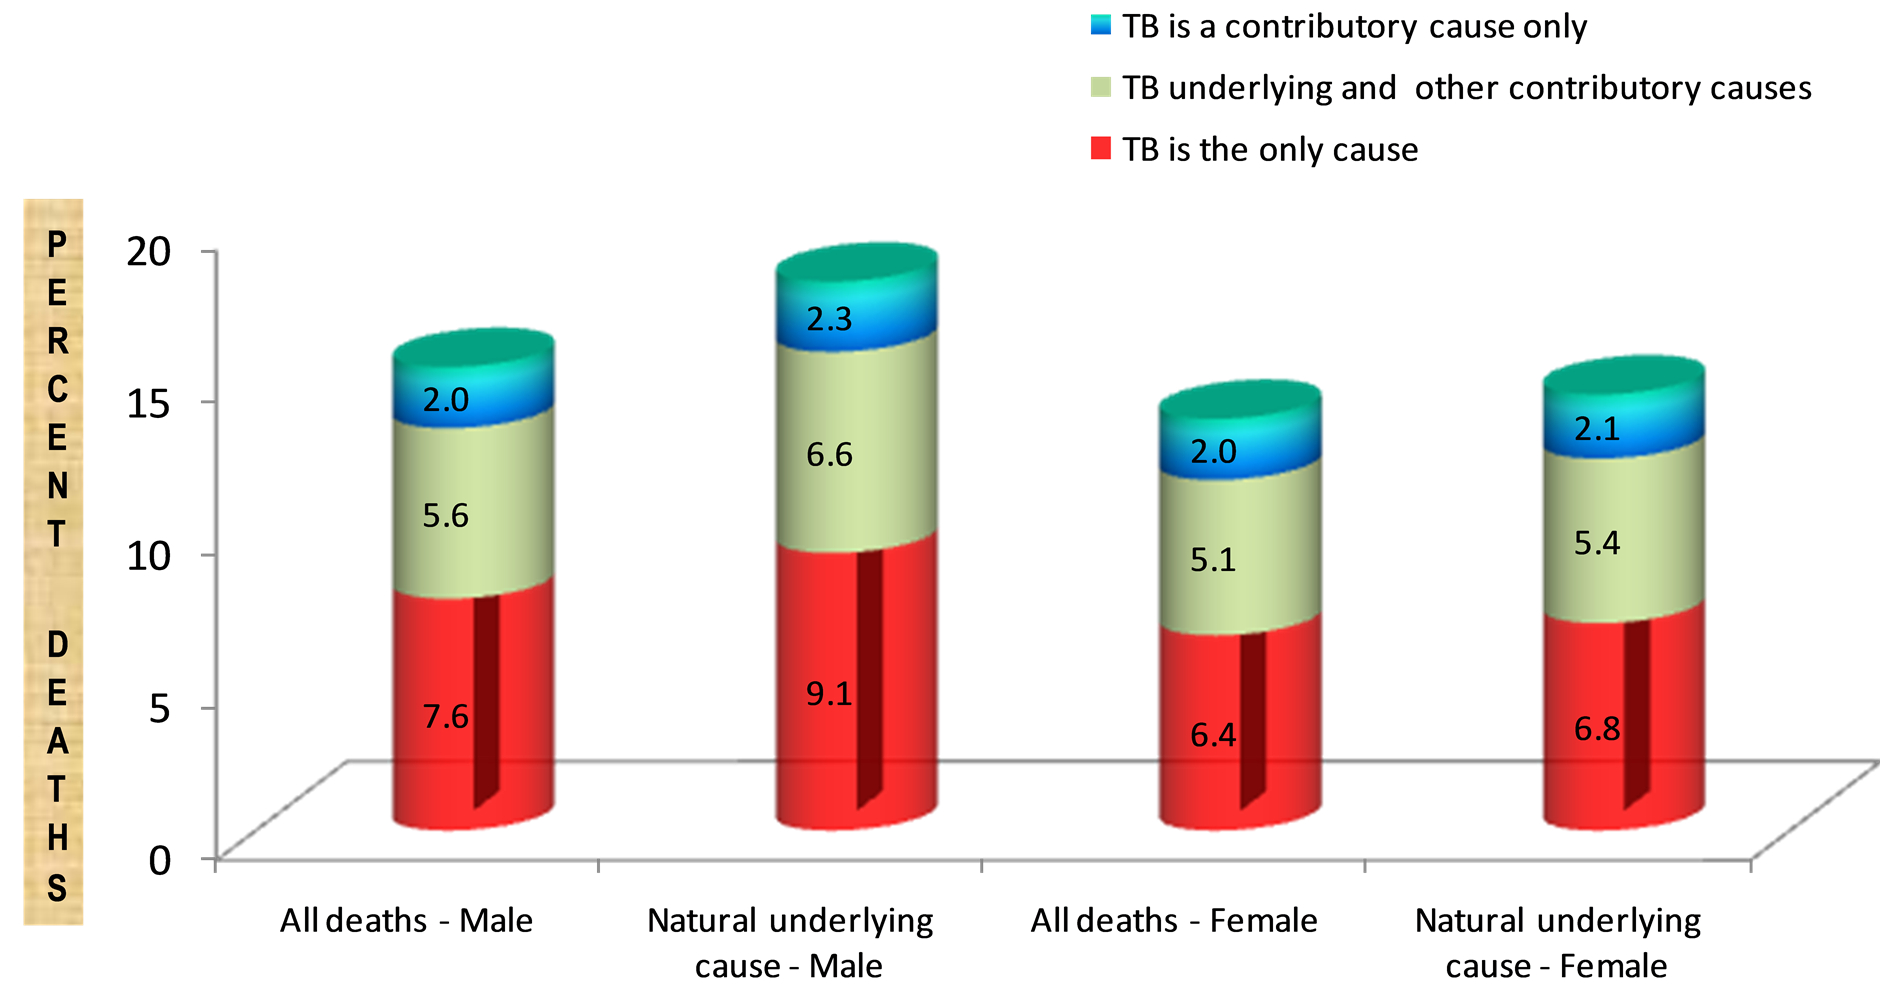
Figure 1. Severity of TB by type of death and gender of deceased.
Table 2. Percent distribution of 2008 South African deaths due to natural causes by TB severity for different socio-demographic and background characteristics of the decease.
< 0.001).
As shown in Table 2, the age group 25 - 49 years is the most affected by TB deaths, with 24.8% having TB listed as a cause of death, 21.2% having TB as the underlying cause, and 12.0% having TB as the only cause of death. This contrasts with the under-fives (0 - 4 year) and those aged 65years or older in which 97.5% and 96.3% of deaths respectively are not TB related. Thus severity of TB increases up to age group 25 - 49 and then decreases.
Considering the educational level of the deceased, TB is most severe among those with primary education, followed by those with secondary education, and is least severe among those with no education and those with university education. For example, 18.4% of deaths among those with primary education are TB related, compare with 17.9%, 9.6% and 6.2% among those with secondary, university and no education respectively. On the other hand, TB is the only cause of death in 3.0%, 4.1%, 8.7%, and 9.5%, of deaths among those with no education, university, secondary and primary education respectively.
With respect to marital status, deceased who were single were most severely affected by TB while those divorced or widowed were the least affected. For example, 16.8% of deaths among those who are single are TB related, with TB being the only cause in 8.2% of these deaths. Among those who are married, 11.5% of deaths are TB related and TB is the only cause in 5.6% of them. By contrast relatively few (6.4%) of deaths among those divorced or widowed were TB related.
The severity of TB was very similar for most types of work except for those in those who are not economically active and those in office work. TB related deaths accounted for between 16-18% among most types of work but only 4.2% among those who are not economically active and 10.8% among office workers.
TB related deaths accounted for 18.1% among smokers compared to 11.5% of deaths among non-smokers. Furthermore, TB was the only cause in 9.4% of deaths among smokers compared to 5.6% of deaths among nonsmokers.
4.3. Multinomial Model for TB Deaths
As discussed in the methodology, the baseline model comprised of three models each comparing the probability of dying given the stated severity of TB present with probability of dying from the TB as the only cause (the baseline/reference category). The summary results are shown in Table 3.
The first model compared the probability of dying from causes unrelated to TB with probability of dying from TB only, given the 8 background characteristics of the deceased discussed in the preceding section. Model 2 compared probability of dying when TB is a contributory cause along with a different cause as underlying to probability of dying when TB is the only cause, while model 3 was used to compare the probability of dying when TB is the underlying cause but other causes are present as contributory, with probability of dying when TB was the only cause of death. The results showed that all the 8 factors were significant predictors in the models, albeit to varying degrees in the different models.
In each model, the reference category comprised being a female aged 65years or more with no former education, in addition to being single, a smoker who was not economically active and died in a hospital/nursing home with death ascertain by autopsy or a medical officer. The last line of each model in Table 3 gives the models odds-ratio against this baseline.
4.3.1. Gender
For males, the odds of TB not being the cause of death rather than being the only cause of death is 0.8 times the odds for females. The odds of TB being a contributory cause of death among males rather than being the only cause of death is 0.8 times the odds for females, while the odds of TB being the underlying cause along with other associate causes of death among males rather than TB being the only cause of death is 0.9 times the odds for females. Hence, as observed in the bivariate analysis the relative odds that TB is a more severe cause of death among males than among females.
4.3.2. Educational Level
The deceased with no formal education were used as the reference category for education attainment. For all models the odds increased with the level of education attainment. However, none of the odd ratios is statistically significant in model 2. In Model 1, the odds of a deceased with a university degree dying of cause unrelated to TB as opposed to dying of TB only were 2.1 times those of someone with no formal education. These odds decreased to 1.3 and 1.1 for those with secondary and primary education respectively. When comparing TB as an underlying cause with other associate causes versus TB as the only cause, the odds for deceased with university degrees were 1.3 times (p = 0.04) those for a deceased with no formal education, while those with secondary education were just 1.1 (p = 0.021) times and the odds for those with primary were 1.0 (p = 0.340).
4.3.3. Age
Figure 2 shows the relative odds for different age groups in each of the multinomial (baseline) models. For 0 - 4years, the odds of TB not being the cause of death rather than being the only cause of death is 2.8 times the odds
Table 3. Multinomial (Baseline) model for predicting severity of TB* using background factors.
*Reference Category is “TB is only cause of death”; **Excluding cases with missing sex and age.
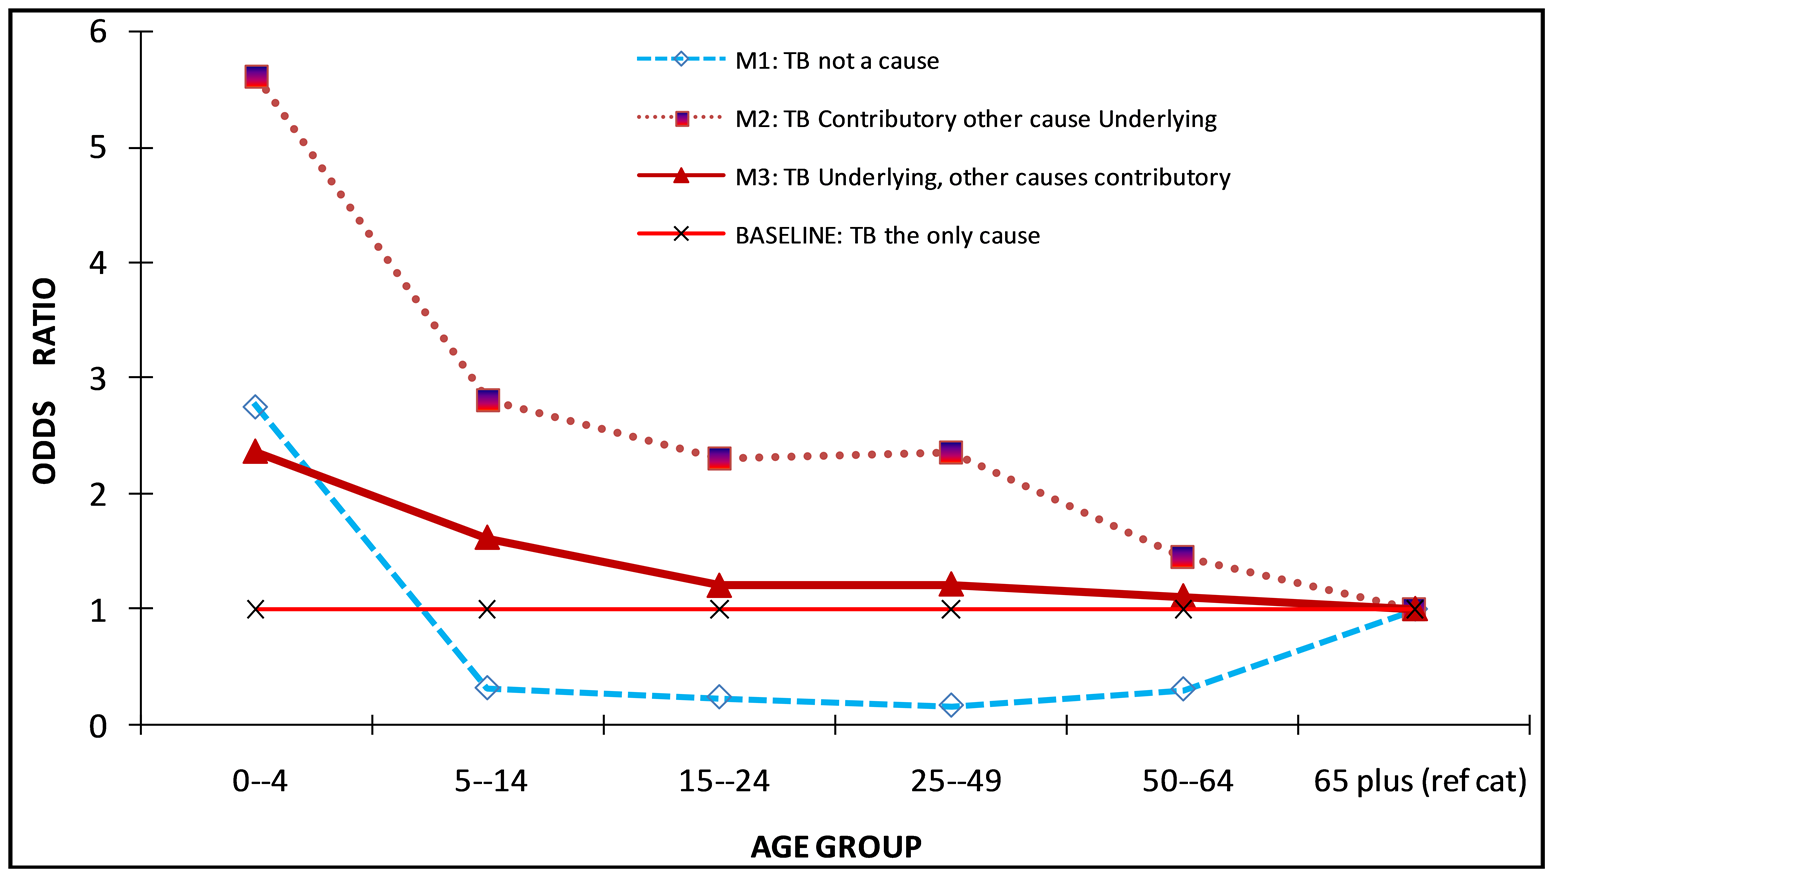
Figure 2. Odds ratio for different level of severity of TB by age groups.
for the 65+ age group. The odds for the other age groups range from 0.2 to 0.3 times the odds for the 65+ age group, i.e. the other groups are less likely to have no TB as opposed to have TB as the only cause of death.
When comparing TB as a contributory cause versus TB as the only cause, the odds for different age groups compared to 65 yrs plus range from 1.5 (50 - 64 yrs) to 5.6 (0 - 4 yrs), decreasing with increase in age. This means that the younger age groups are more likely to have TB as a contributory cause rather as the only cause compared to those aged 65 years and above. When comparing deaths with TB as underlying cause versus deaths with TB as the only cause, the odds were found to be steadily decreasing with age. The odds for the youngest group(age 0 - 4) are 2.4 times the odds for those aged 65yrs or more while the odds for the age group 50 - 64 are just 1.1 times those for 65 years.
4.3.4. Marital Status
The analysis compared those with various marital statuses against those who were single. When comparing deaths with no TB versus deaths with TB as the only cause, the odds range from 1.1 for “unknown” to 1.7 for Divorced/Widowed. Those who are married are 1.5 times more likely than those who are single, to not have TB listed as a cause compared to TB listed as the only cause of death. Similarly the odds for those who are divorced/widowed compared to those singe are 1.7. When comparing TB as a contributory cause versus TB as the only cause, there were no significant differences between those who are married and those who are single, while those divorced/widowed were 1.2 times more likely than those single, to have TB as a contributory cause as opposed to TB as the only cause. Both married (odds = 1.1) and divorced/widowed (odds = 1.2) were significantly more likely than those single to have TB as an underlying cause along with other causes as contributory as opposed to TB as the only cause of death. Other odds were close to 1.
4.3.5. Smoking Status
The only significant difference (p = 0.038) between smokers and non-smokers was when comparing TB as contributory versus TB as the only cause of death. The odds of a non-smoker having TB as a contributory cause as opposed to TB as the only cause of death is 1.2 times the odds for a smoker.
4.3.6. Place of Death
The odds of not having TB listed against TB as the only cause of death ranged from 1.5 to 2.4. For Deaths occurring outside of the hospital or nursing homes, TB was more likely not to be listed as a cause than to be listed as the only cause of death. These odds were reversed when comparing TB as contributory cause with TB as the only cause (odds ranged from 0.2 to 0.8) and when comparing TB as underlying cause with other contributory causes with TB as the only cause of death (odds ranged from 0.4 to 0.8). Hence persons with TB were more likely to be listed as dying of TB only when they died at home or in emergency room or on arrival at hospital, than when they died in the hospital/nursing home.
4.3.7. Death Certification
For deaths not certified by autopsy or medical practitioner, the odds of not having TB as cause of death rather than having TB as the only cause of death is 0.7 times those for which cause was certified by autopsy or medical practitioner. Hence deaths were 26% less likely to be classified as having TB only as opposed to not having TB when certified by autopsy or medical practitioner than when not certified. The results were similar when comparing TB as CC with TB as the only cause (corresponding odds were 0.7) and when comparing TB as underlying with other contributory causes with TB as only cause (odds = 0.8).
4.3.8. Work
Those who were in various types of work were compared with those not economically active. The odds of not having TB listed against TB as the only cause of death were 0.6 for elementary occupations, 0.7 (technical), 0.6 (service workers) and 0.8 (office workers). TB was more likely not to be listed as a cause than to be listed as the only cause among those not economically active compare to those in some form of work. When comparing TB as a contributory cause versus TB as the only cause, the difference in the odds between those not economically active and those in some form of work were not significant except for technical workers (odds = 1.3, p-value = 0.014). Similarly when comparing TB as an underlying cause with other contributory causes versus TB as the only cause, only those in elementary occupations were significantly different (odds = 0.9, p-value = 0.048) from those not economically active.
5. Discussion
It has long been argued that death is often caused by several contributing conditions and that these conditions should be analysed when studying the contribution of specific causes of death to total mortatility. This paper contributes to the literature by presenting a comprehensive list of indicators that should be used in studying causes of death. The methods are illustrated using TB as the condition of interest due to the fact that TB has been and remains the leading cause of death in Southern Africa based on the underlying cause concept. In particular, an indicator of severity of TB as a cause of death is computed and used in multinomial logistic regression model to illustrate possible gains of multiple cause of death analysis.
The findings indicate that TB was mentioned as the only cause in 42581 deaths (7.9% of all natural UC), as UC with other causes as CC in 32282 deaths (6.0% of all natural underlying causes) as CC with other natural UC in 11874 deaths (2.2%) and as CC with non-natural UC in 81 deaths (0.1% of all non-natural underlying causes). Thus multiple cause of death analysis allowed us to identify the additional 11955 (2.0% of all deaths) in which TB contributed to death but was not the underlying cause. Furthermore among deaths in which TB was the underlying cause, MCOD analysis also allowed us separate these into those in which TB was the only cause (56.9%) and those in which there were other associated causes (43.1%). Using this in-depth MCOD classification, bivariate analyses revealed that these distinctions are important in investigating the association between TB deaths and individual background characteristics such as age, gender, marital status, etc. For example, TB was much more likely to be an underlying cause of death among smokers (16.1%) as compared to non-smokers (10.0%). But when TB was the underlying cause, the likelihood of it being the only cause among smokers was essentially the same as among non-smokers.
This study further found that individual background demographics were good predictors of TB severity and were all significant at the 5% level of significance. For the multinomial logistic regression model with gender, age, and method of death certification as predictors, TB was found to be twice as severe among males compared to females. The proportion of deaths with TB mentioned were the same whether death was ascertain by autopsy or medical officer as when it was not certified. However, when death was certified by autopsy or qualified medical officer, TB was less likely to be classified as the underlying cause or as the only cause than when death was not certified by autopsy or qualified medical officer.
The age group 25 - 49 years is the most affected by TB deaths, with 24.8% having TB listed as a cause of death, 21.2% having TB as the underlying cause, and 12.0% having TB as the only cause of death. This contrasts with the under fives (0 - 4 years) and those aged 65years or older in which 97.5% and 96.3% of deaths respectively are not TB related. Thus severity of TB increases up to age group 25 - 49 and then decreases.
TB related deaths accounted for between 16% - 18% among most types of work but only 4.2% among those who are not economically active and 10.8% among office workers. TB was less likely to be listed as the only cause of death for those with university degree than those without. The deceased with no education had lower TB deaths.
6. Conclusions
This study has reviewed methods of analyzing multiple causes of death data that have been suggested in the literature for over 50 years and proposed the key variables that need to be computed to facilitate adoption of these methods. In particular, a sufficient set of three variables for each main cause of death has been proposed from which all other multiple cause of death indicators can be computed, and the formula for computing these has been provided. The use of a severity measure to capture the multiple cause of death nature of death has been shown to provide valuable in-depth information, without substantially increasing the complexity of the analysis and reporting.
The main difference between MCOD analysis and UC analysis has been to include the contribution of a given cause through its being listed as an associated cause with other causes as the UC. The gain could be small if a particular disease tends to be coded as UC whenever it is present. This is the case for example with HIV in the case of South Africa MCOD. If a particular cause tends to be coded as CC rather than UC when present with other causes, the gain could be substantial. Santos et al. (2003) reported that total reported TB related deaths practically doubled from 4.6/100 000 when using UC analysis to 8.9/100,000 when using both UC and CC. By contrast, the contribution of TB to total deaths in this study increased by 2.2% to 16.1% when contributory cause is included to the underlying cause.
This study has further revealed the importance of adopting the severity measure in analysing the contribution of diseases to total mortality. For example, it revealed that 44% of the 13.5% deaths in which TB was UC had other CC. Hence, although the use of UC analysis suggests that TB accounted for 13.9% of all natural deaths in SA in 2008, this paper shows that TB on its own accounted for 7.9% of deaths and the remaining 6.0% were in conjuction with other causes. We recommend that this variable be analysed for all main causes of death.
References
- Rosenberg, H.M. (1989) Improving Cause-of-Death Statistics. American Journal of Public Health, 79, 563-564. http://dx.doi.org/10.2105/AJPH.79.5.563
- WHO (2009) TB Impact Measurement Policy and Recommendations for How to Assess the Epidemiological Burden of TB and the Impact of TB Control. Stop TB Policy Paper No. 2, WHO/HTM/TB/2009.416.
- Guralnick, L. (1966) Some Problems in the Use of Multiple Cause of Death. Journal of Chronic Diseases, 19, 979-990. http://dx.doi.org/10.1016/0021-9681(66)90031-2
- Santo, A.H., Pinheiro, C.E. and Jordan, M.S. (2003) Multiple Cause of Death Related to Tuberculosis in the State of Sao Paulo, Brazil, 1998. Revista de Saude Publica, 37, 714-721. http://dx.doi.org/10.1590/S0034-89102003000600005
- Jansson, B., Johansson, L.A., Rosen N. and Svanstrom, L. (1997) National Adaptations of the ICD Rules for Classification—A Problem in the Evaluation of Cause-of-Death Trends. Journal of Clinical Epidemiology, 50, 367-375. http://dx.doi.org/10.1016/S0895-4356(96)00426-X
- Treloar, A.E. (1956) The Enigma of Cause of Death. Journal of the American Medical Association, 162, 1376-1379. http://dx.doi.org/10.1001/jama.1956.02970320024007
- Erhardt, C.L. (1958) What Is “the Cause of Death”. Journal of the American Medical Association, 168, 161-168. http://dx.doi.org/10.1001/jama.1958.03000020023005
- Dorn, H.F. and Moriyana, I.M.(1964) Uses and Significance of Multiple Cause Tabulations for Mortality Statistics. American Journal of Public Health, 59, 782-784.
- Speizer, F. E., Trey, C. and Parker, P. (1977) The Uses of Multiple Causes of Death Data to Clarify Changing Patterns of Cirrhosis Mortality in Massachusetts. American Journal of Public Health, 67, 333-336. http://dx.doi.org/10.2105/AJPH.67.4.333
- Wong, O., Rockette, H. E., Redmond, C.K. and Heid, M. (1978) Evaluation of Multiple Causes of Death in Occupational Mortality Studies. Journal of Chronic Diseases, 31, 183-193. http://dx.doi.org/10.1016/0021-9681(78)90033-4
- White, M.C., Selvin, S. and Merrill, D.W. (1989) A Study of Multiple Causes of Death in California: 1955 and 1980. Journal of Clinical Epidemiology, 42, 355-365. http://dx.doi.org/10.1016/0895-4356(89)90040-1
- Rushton, L. (1994) Use of Multiple Causes of Death in the Analysis of Occupational Cohorts—An Example from the Oil Industry. Occupational and Environmental Medicine, 51, 722-729. http://dx.doi.org/10.1136/oem.51.11.722
- Frova, L., Salvatore, M.A., Pappagallo, M. and Egidi, V. (2001) Multiple Cause of Death Approach to Analyse Mortality Patterns. http://www.pdf4free.com
- ABS—Australian Bureau of Statistics (2003) Multiple cause of death analysis 1997-2001. http://www.abs.gov.au/ausstats/abs@.nsf/956c382b0b05ba7d4a2568010004e173/0971aa07f3c12518ca256d6b0003b678! Open Document
- Stallard, E. (2002) Underlying and Multiple Cause Mortality at Advanced Ages: United States 1980-1998. North American Actuarial Journal, 6, 64-87.
- Amey, A.K.A., Forcheh, N. and Setlhare, K. (2012) Multiple Causes of Death Models for Human Immunodeficiency Virus/Acquired Immune Deficiency Syndrome and Related Mortality in South Africa in 2006 and 2007. Open Access Medical Statistics, 2, 1-13. http://dx.doi.org/10.2147/OAMS.S23627
- Statistics South Africa (2008) Mortality and Causes of Death from Death Notification, South Africa 2006. Statistics South Africa, Pretoria.
- Hooper, W.C., Holman, R.C., Clarke, M. J. and Chorba, T.L. (2001) Trends in Non-Hodgkin Lymphoma (NHL) and HIV Associated NHL Deaths in the United States. American Journal of Hematology, 66, 159-166. http://dx.doi.org/10.1002/1096-8652(200103)66:3<159::AID-AJH1039>3.0.CO;2-2
- Lawal, B. (2003) Categorical data analysis with SAS and SPSS: Applications. Lawrence Erlbaum Associates, London.
- Powers, D.A. and Xie, Y. (2000) Statistical Methods for Categorical Data. Academic Press, London.
- Agresti, A. (1990) Categorical Data Analysis. John Wiley and Sons, New York.