Geomaterials
Vol.4 No.3(2014), Article
ID:47807,13
pages
DOI:10.4236/gm.2014.43010
Gamma-Ray Spectrometry and Induced Polarization Studies for El Atshan-II Uranium Prospect Area, Central Eastern Desert, Egypt
Assran S. M. Assran1, Ragaa A. M. Elsayed1, Hosni H. Ghazala2, Hussein F. Abdelsalam1
1Nuclear Materials Authority, Cairo, Egypt
2Mansoura University, Mansoura, Egypt
Email: ragaa1@hotmail.com
Copyright © 2014 by authors and Scientific Research Publishing Inc.
This work is licensed under the Creative Commons Attribution International License (CC BY).
http://creativecommons.org/licenses/by/4.0/
![]()
![]()

Received 15 May 2014; revised 13 June 2014; accepted 13 July 2014
ABSTRACT
Gamma-ray spectrometry and induced polarization (IP) studies were carried out to determine the radioactive anomalous zones and to follow their lateral and vertical extensions in El Atshan-II uranium prospect area, central Eastern Desert, Egypt. This area and its surroundings are covered by different Precambrian basement rocks, which intruded by younger bostonite rock, andesite dykes and carbonate veins. Data of the gamma-ray spectrometry have been analyzed qualitatively and quantitatively by applying specific interpretation techniques. These data revealed a wide radioactivity range oscillating from 15.0 to 2362.0 Ur, 0.5 to 307.2 ppm, 0.1 to 55.1 ppm and 0.3 to 22.0% for the total count (Tc), equivalent uranium (eU), equivalent thorium (eTh) and potassium (K), respectively. The constructed radioelement concentration maps and eU-composite image of the study area showed that the anomalously high radioactivity levels are mainly associated with outcrops of the bostonite rock. The induced polarization data were mathematically inverted to produce the true resistivity and chargeability values of cross-sections below the surveyed lines traverse in the area. The resistivity values are varied both vertically and horizontally from 7.83 to more than 1042.0 ohm∙m, while the chargeability values are ranged from 0.195 to more than 204.0 mV/V, suggesting variation of the rocks facies and mineralizations. Integration of the resistivity and chargeability data indicates the presence of some mineralized zones, mainly associated with the bostonite rock, with depths varied from the near-surface to more than 70 m. Therefore, a core drilling is recommended at some stations along three selected profiles to a depth of 70 - 100 m to test the depth, structural model and grade of mineralization in the area.
Keywords:Gamma-Ray, Uranium, Thorium, Induced Polarization, Resistivity, Chargeability

1. Introduction
Exploration of the natural radioactive elements, especially uranium (U), has become an important target over the last few decades because of the demand for nuclear fuels. Therefore, gamma-ray surveys are widely used for the geological and geochemical mapping and exploration of the radioactive mineral resources [1] -[3] .
In Egypt, some areas in the Eastern Desert are of considerable geological interest in view of the presence of radioactive mineralizations associated with different types of the igneous rocks. El Atshan-II uranium prospect area which lies at the intersection of about 25˚50'35" lat. and 34˚06'35" Long., on the Red Sea Coast (Figure 1(a)), represents one of the important anomalously high radioactivity areas and is becoming a promising target for U exploration. The radioactive anomalies, with or without visible U mineralization, are mainly restricted within and around joints and fractures in the bostonite rock and sporadically along its upper and lower contacts with the older country rocks.
The bostonite is a Post-orogenic volcanic rock, widely distributed in the central Eastern Desert of Egypt and occurs mainly in the form of dykes and sills with length and thickness of about 0.5 - 1.5 km and 3 - 20 m, respectively. This volcanic rock is present in more than one generations where the Rb-Sr age ranges from 302 to 245 Ma, corresponding to Carboniferous to Early Permian age [4] , while an age of 74 Ma was reported by [5] . From the mineralogical point of view, bostonite represents one of the most important igneous rocks which host U and/or thorium (Th) minerals, and it can be divided into U-rich and Th-rich bostonite [5] . Therefore, the objectives of the present study are to identify the spatial distribution of the radioactive elements concentrations in El Atshan-II area by using the ground gamma-ray spectrometry survey, and apply the induced polarization (IP) method to follow the exposed surface radioactive anomalies and detect any possible extension for subsurface mineralizations, in addition to obtaining information about their lateral and vertical variations at depths.
2. Geologic Setting
Many authors have studied the geologic setting and described the rock alterations and mineralizations of El Atshan-II area and the surroundings [6] -[9] . Generally, El Atshan-II area is mainly covered by basement rocks of Late Precambrian age, represented by different varieties of the Hammamat sediments, intruded by quartz veins, bostonite, basic volcanic rocks and carbonate veins (Figure 1(b)).
1) Hammamat sediments
The Hammamat sediments are the oldest rock unit in the area. They are composed of clastic sediments, which are generally characterized by their molasse type, purple-red to brick-red and green to grayish colors. These sediments are regionally non-metamorphosed and form a thick succession of interbedded conglomerates, sandstone and slate.
2) Quartz veins
They are observed intruding through the various rock types of the Hammamat sediments. The quartz veins occur in different forms with variable dimensions, but generally they form small and thin veins and fracture-fillings extending in various directions.
3) Bostonite
Bostonite is hard and compact rock, fine to medium grained and buff in color. The weathered and altered bostonite exhibits reddish brown, yellowish brown or light grey color according to the alteration products which commonly include iron and manganese oxides, sometimes with carbonates and clayey materials. This rock has a wide distribution in the form of sills, gently inclined sheets and dykes as well as some small plugs or cone-like masses, invading the exposers for most of the different lithological units of older ages. According to [5] , the bostonite is essentially composed of alkali feldspars (85% - 95%) together with subordinate amounts of biotite and hornblende. Quartz, if present, does not exceed 5%. Epidote, zircon, sphene and hematite are the main accessory minerals. Generally, the bostonite alteration zones are accompanied by thin veinlets which consist of galena, sphalerite, chalcopyrite and, quite often, uranium minerals [10] [11] .
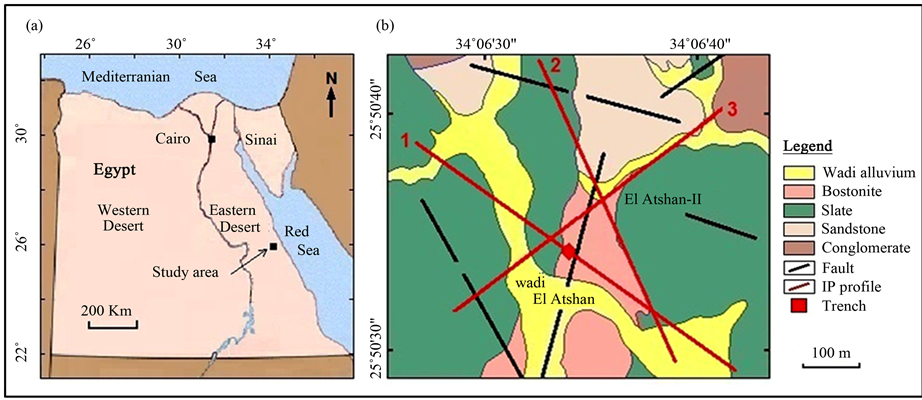
Figure 1. Location and geologic maps of El Atshan-II uranium prospect area, central Eastern Desert, Egypt.
4) Basic volcanic rocks
They form small dykes of andesitic composition and trachytic texture. They are thin and short dykes intruded in the Hammamat sediments, without clear cross relationship with the older bostonite rock.
3. Field Procedures and Measurements
3.1. Gamma-Ray Spectrometry
El Atshan-II U prospect area was subjected to systematic ground gamma-ray spectrometry measurements for the total gamma activity (total count, TC) and concentrations of the three radioactive elements equivalent uranium (eU), equivalent thorium (eTh) and potassium (K). The measurements were taken along nearly east-west profiles on a grid pattern of 20 m station separation by using a portable hand-held radiation spectrometer, model RS-230, with internal data storage and PC data retrieval, in addition to a system work with the GPS units. Finally, the different gamma-ray spectrometry measurements have been extracted in XYZ format and presented as color radioactivity maps and false-color eU-composite image, using Geosoft package [12] , and subjected to some statistical methods of analysis to enhance their qualitative and quantitative interpretations.
3.2. Induced Polarization
The induced polarization (IP) is a current-stimulated electrical phenomenon observed as a delayed voltage in the earth materials [13] . IP is important in the base metal exploration, because it depends on the surface area of the conductive mineral grains, rather than their connectivity and is therefore sensitive especially to disseminated mineralizations. It can be obtained with a standard four-electrode DC resistivity spread by interrupting the current abruptly. The voltage across the potential electrodes, generally, does not drop to zero instantaneously, but decays rather slowly after an initial large decrease from the original steady-stage value. This decay time is of one of order of seconds or even minutes. If the current is switched on again, the potential after a sudden initial increase build up over a similar time interval to the original DC amplitude. The decay voltage is measured as a function of time in various ways; this method is known as time-domain IP [14] .
Time domain induced polarization measurements (IP/resistivity) were conducted along three profiles, using the dipole-dipole array, with dipole lengths of 20 m and 40 m. The spacing between the transmitter and receiver dipole was from 1 - 6, that allows subsurface information to a considerable depth beneath the selected profiles. The data were collected using IRIS instrumentation, with a VIP 4000 transmitter, powered by a Honda 5 kW motor generator, and a six-channel receiver model ELREC-6. Such instrumentation provides relatively precise and consistent measurements, regardless of the hard nature of the different rocks in the study area. Finally, IP data were mathematically inverted to produce the true resistivity and chargeability values of cross-sections below the surveyed profiles traverses in the area.
4. Discussion and Interpretation
4.1. Gamma-Ray Spectrometry
4.1.1. Qualitative Interpretation
The Qualitative interpretation of the ground gamma-ray spectrometry survey data depends mainly upon the excellent correlation between the general pattern of the recorded measurements (represented by color maps of TC, eU, eTh and K, in addition to the ratio map of eU/eTh and eU/K) and the surface lithological and structural distribution of the surveyed area. Besides, the False-color composite images can also provide useful information regarding the identification of anomalous zones of enriched radioelements concentrations, especially uranium.
1) Total-count and radioelement maps
Visual examinations of the constructed TC, eU, eTh and K maps (Figure 2) could show—at a glance—that the distribution of the high radioactivity levels is highly controlled by the bostonite rock and its tributaries dissected the surveyed area (Figure 1(b)). Generally, both of the TC, eU and eTh map displayed a very wide range of radioactivity level, oscillating from about 15.0 to 2362.0 Ur, 0.5 to 307.2 ppm and 0.1 to 55.1 ppm, respectively. By comparison with the geologic map, this reflects different radioactivity levels within and between the different rock types in the area. Generally, each of the three maps can be divided into two main zones; the first is characterized by fairly high or anomalous radioactivity levels, mainly associated with the bostonite outcrops, while the second is characterized by low and overlap radioactivity levels within and between the conglomerate, sandstone, slate and wadi alluvium. On the other hand, the K map shows a relatively narrow range of concentrations (from 0.3% to 22%) allover the exposed rock units in the area. Despite this narrow range, there is some agreement with the previous TC, eU and eTh maps as concerning the highest and lowest levels and distribution of the anomalous radioactivity zones.
2) Radioelement ratio maps
The radioelement ratio maps of eU/eTh, eU/K and eTh/K are less affected by surface geometry, percentage of outcrop, inversion trapping of radon and various absorbers such as soil moisture and vegetation. Therefore, the ratio maps are particularly useful in interpretation of the ground gamma-ray spectrometry measurements since they are frequently more indicative of lithological units or geological-geochemical environments than the absolute intensity and concentration maps alone. From an exploration viewpoint, maps of eU/eTh and eU/K are diagnostic for identification of the anomalous U concentration zones [15] [16] .
Regarding the eU/eTh ratio map of the study area (Figure 2), it is noticed that the central and southern parts have higher eU/eTh values (reach to 6.65) than their surroundings, indicating U enrichment. These anomalous parts may have been formed due to the presence of solutions highly enriched with U, which has higher mobilization than Th. The eU/K ratio map (Figure 2), on the other hand, confirms most of the anomalous eU/eTh parts and shows very high values (reach to 35.0) at the central and southern parts of the surveyed area.
3) False-color eU-composite image
Examination of the high regions for U, U/Th, U/K indicates U enrichment over the other two natural radioelements Th and K. Accordingly, a false-color eU-composite image was constructed using red, green and blue color combination to represent the three parameters eU, eU/eTh and eU/K, respectively (Figure 3). This image is used to identify and outline the anomalous eU concentration zones which displayed as white light portions resulting from color mixture for the used parameters. As indicated from the image, the white light portions are mainly associated with the bostonite outcrops in the central, southern and southwestern parts of the study area. Scattered white portions of relatively smaller sizes are also found allover the area, suggesting near surface bostonite rocks covered by the Hammamat sediments. According to [17] , these regions can be interpreted as reflecting good geochemical environments favorable for the formations of U deposits and can, therefore, be used as exploration guides to search for additional surface and subsurface U mineralizations.
4.1.2. Quantitative Interpretation
The quantitative interpretation of the gamma-ray spectrometry data depends principally upon the fact that, the concentrations of the radioelements (eU, eTh and K) vary measurably and significantly with lithology [18] . In the present study, the quantitative analysis of the different gamma-ray spectrometry measurements is discussed on light of some simple statistical treatment to the original data without applying any transformation, in accordance with the recommendation given by [19] . The statistical parameters are represented by the calculated mean value (X), standard deviation (S), coefficient of variability (CV) as well as determination of the minimum and

Figure 2. Gamma-ray spectrometry maps showing the distribution of the total gamma activity and concentrations of the three radioactive elements eU, eTh and k as well as ratio of eU/eTh and eU/k for El Atshan-II uranium prospect area, central Eastern Desert, Egypt.
maximum values (range) for the different gamma-ray spectrometric variables (Table 1).
Examination of the calculated statistical parameters of the Tc, eU, eTh, K, eU/Th and eU/K showed more or less similar low values for the conglomerate, sandstone, slate and wadi alluvium (Table 1), which are considered as sedimentary rocks varieties. Generally, the recorded low concentrations of the three radioactive elements eU, eTh and K for these rocks were found to be very close to the normal tabulated ranges for the different sedimentary rocks [16] [20] [21] . Accordingly, these rocks are of inconsiderable significance in terms of exploration of the natural radioactive elements, especially uranium.
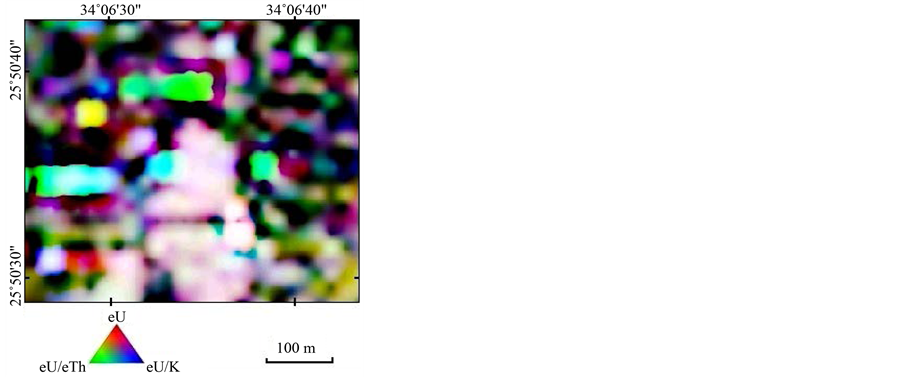
Figure 3. False-color eU-composite image of El Atshan-II uranium prospect area, central Eastern Desert, Egypt.

Table 1. Gamma-ray spectrometry data for the different rock units of El Atshan-II uranium prospect area, central Eastern Desert, Egypt.
Min. & Max.: minimum & maximum values; X: arithmetic mean; S: standard deviation; CV: coefficient of variability.
On the other hand, the bostonite rock is marked by very high radioactivity levels (averaging 973.8 Ur, 63.4 ppm, 21.4 ppm and 4.1% for the Tc, eU, eTh and K, respectively) and very high average values for both eU/Th and eU/K (3.39 and 19.5) than its equivalent igneous rocks. This indicates much additions of U from outer sources [22] . Besides, the bostonite rock recoded a fairly wide range for the TC (61.4 - 2362.0 Ur), eU (3.1 - 307.2 ppm), eTh (0.5 - 55.1 ppm) and K (0.9% - 22.0%). This wide range reflects a very high variability distribution for the radioelements concentrations within the bostonite and along its contacts with the country rocks, which is expected in view of the known post-magmatic hydrothermal processes and alterations which accompanied by U mineralization.
Coefficient of Variability (CV) Analysis
The quantitative interpretation efforts of gamma-ray spectrometry are directed towards explaining, classifying and setting priorities on the radioactive anomalies and locating favorable areas for U exploration. Saunders and Potts [23] concluded that, the calculated CV values of eU, eTh, and K for geologic map units are generally increase with increasing U potentiality.
In the study area, the percentages of CV values of the three radioactive elements (eU, eTh and K) were calculated for each of the different rock units (Table 1) and graphically illustrated as a bar chart (Figure 4). By examination of the table and bar chart, the following conclusions have been extracted:
1) Within all the different rock units in the study area, the higher CV values were related to eU and the lowest CV values were related to K, while eTh exhibits the intermediate values.
2) The conglomerate exhibits relatively higher CV values for the three radioelements than those of slate, sandstone and wadi alluvium.
3) The bostonite is considered the highest rock unit of its U variability and, consequently, potentiality due to its higher CV value which reaches about 129.5%.
4.2. Acquisition and Interpretation of IP Data
The IP field data of three selected profiles (Figure 1(b)) were tabulated and processed using the 2D resistivity and IP inversion RES2DINV program [24] , where true resistivity and chargeability models of inversion sections, with distances and depths, were generated. The inversion was carried out to the point at which the difference between consecutive RMS errors was less than 5% (RMS error values of less than 10% were regarded as acceptable). The resistivity and chargeability models of inversion sections, together with surface geology, are illustrated in Figure 5 to Figure 9.
4.2.1. Resistivity/Chargeability along Profile 1
This profile has a NW-SE direction and a total length of 540 m. It was conducted using dipole lengths of 20 m and 40 m, passing with the main excavated trench in the study area at station 260. This profile was selected to follow the near-surface radioactive anomalies, which were recorded at the trench and obviously appeared from the TC and eU maps (Figure 2).
For the sections of dipole lengths of 20 m (Figure 5), examination of the resistivity mode shows relatively high values (515.0 - ˃ 952.0 ohm∙m) centered at stations 100 and 480, corresponding to surface and subsurface highly resistive slate of the Hamammat sediments. Also, four zones can be distinguished from the resistivity model, which have relatively moderate values (~81.0 - 515.0 ohm∙m). These zones are extended laterally through stations 20 - 100, 120 - 240, 300 - 380 and 380 - 460, and vertically from the surface to depths of about 15 m, 30 m, 15 m and ˃35 m, respectively. On the other hand, two conductive zones are recorded on the resis-
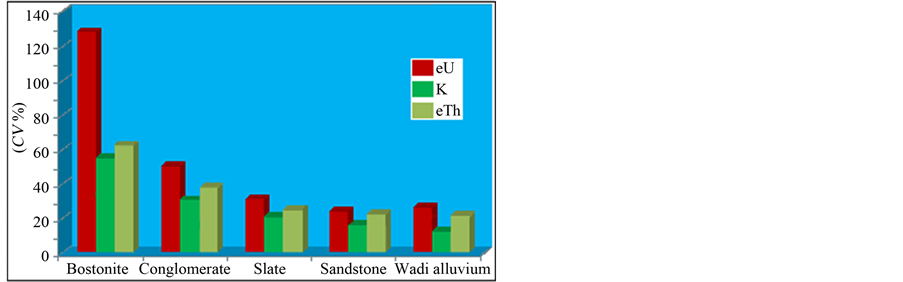
Figure 4. Vertical bar chart showing the CV percentages of eU, K and eTh for the different rock units of El Atshan-II uranium prospect area, central Eastern Desert, Egypt.
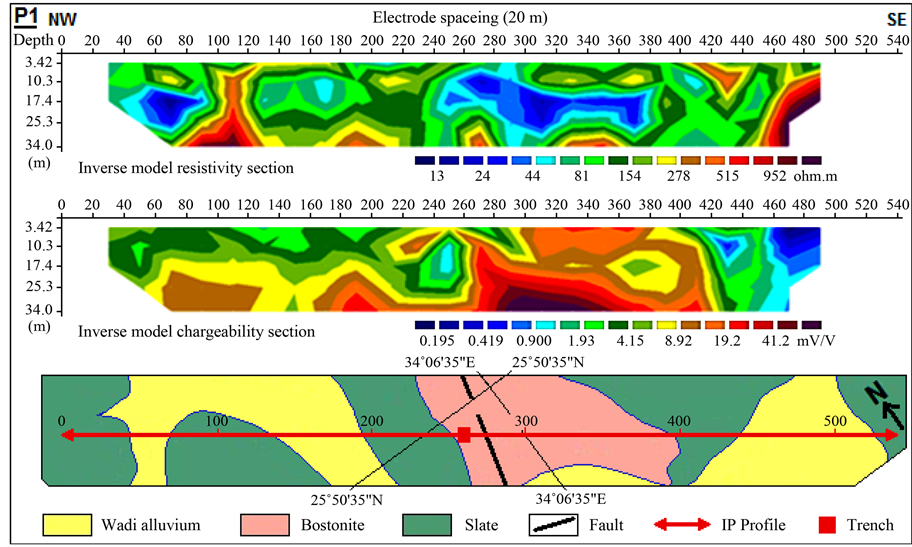
Figure 5. Dipole-dipole sections of the resistivity and chargeability, with the corresponding surface geology using a dipole spacing of 20 m along profile 1 in El Atshan-II uranium prospect area, central Eastern Desert, Egypt.
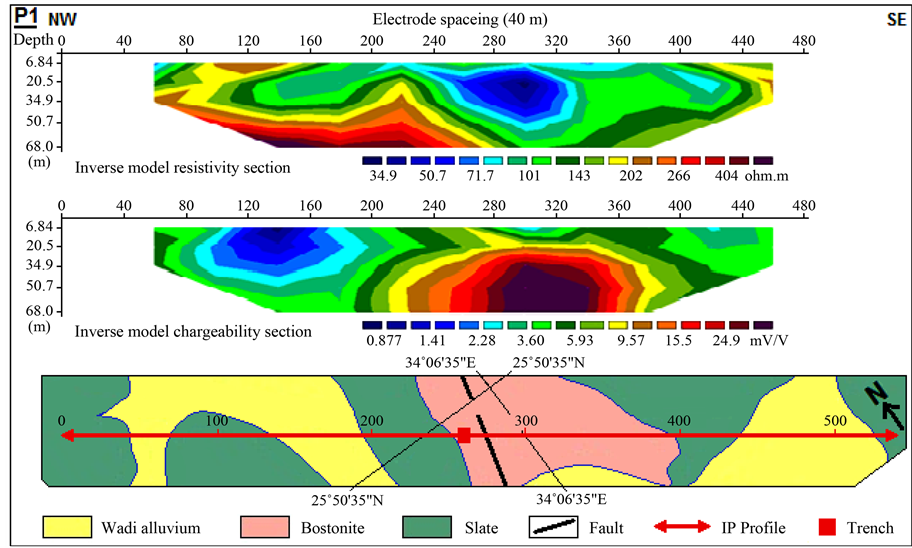
Figure 6. Dipole-dipole sections of the resistivity and chargeability, with the corresponding surface geology using a dipole spacing of 40 m along profile 1 in El Atshan-II uranium prospect area, central Eastern Desert, Egypt.
tivity model (blue color) of resistivity values less than 70.0 ohm∙m. The first is centered between stations 60 and 80, with a depth of about 30 m while the second is extended laterally through stations 240 - 380 and centered at station 300, with a depth varying from 10 to 30 m. By correlation with the chargeability model and the corres-
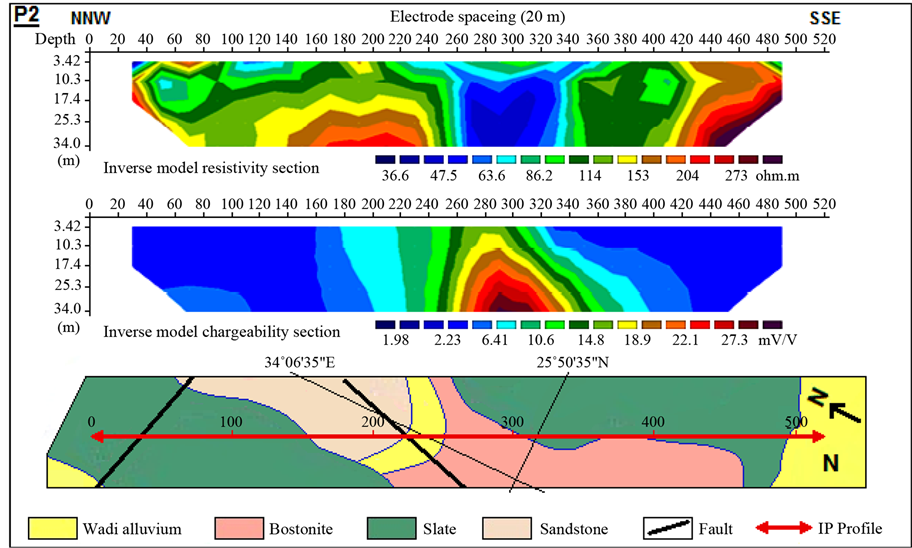
Figure 7. Dipole-dipole sections of the resistivity and chargeability, with the corresponding surface geology using a dipole spacing of 20 m along profile 2 in El Atshan-II uranium prospect area, central Eastern Desert, Egypt.
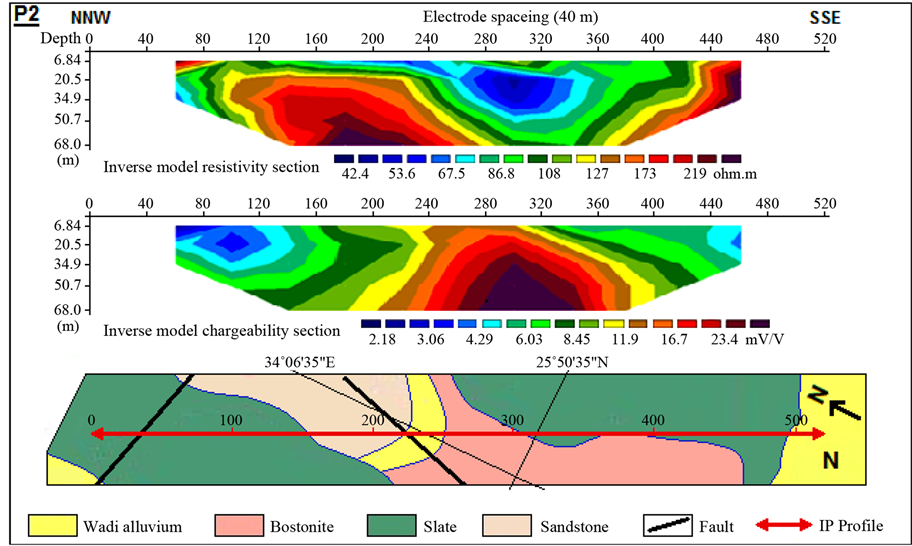
Figure 8. Dipole-dipole sections of the resistivity and chargeability, with the corresponding surface geology using a dipole spacing of 40 m along profile 2 in El Atshan-II uranium prospect area, central Eastern Desert, Egypt.
ponding surface geology, the first conductive zone corresponds to relatively low chargeability values, which suggests the presence of clay materials, while the second conductive zone corresponds to moderate chargeability values, suggesting that this zone is related to altered materials for bostonite rock [25] .
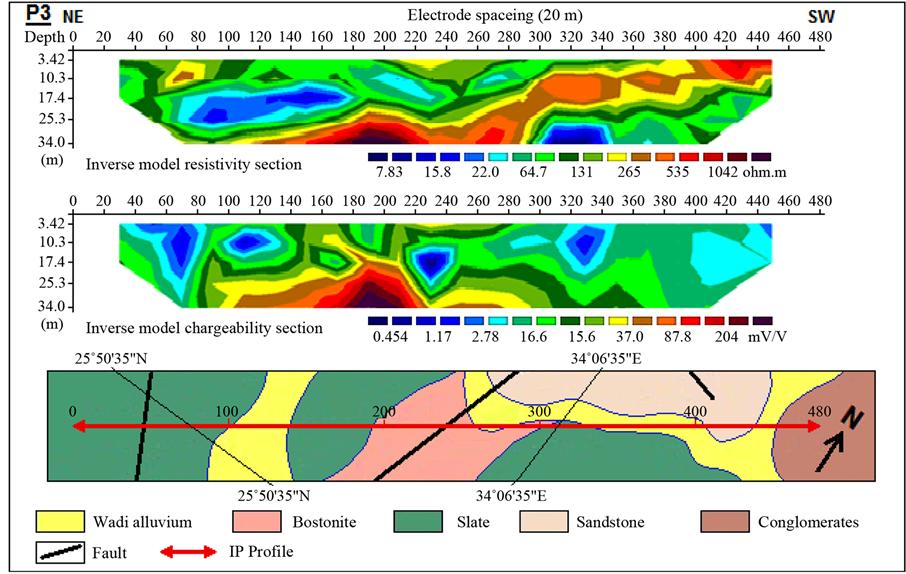
Figure 9. Dipole-dipole sections of the resistivity and chargeability, with the corresponding surface geology using a dipole spacing of 20 m along profile 3 in El Atshan-II uranium prospect area, central Eastern Desert, Egypt.
Regarding the chargeability model with a dipole length of 20 m (Figure 5), it displays a wide chargeability anomalous zone centered at station 300, with high chargeability values (˃41.0 mV/V), which starts from the near-surface and opening downwardly to more than 35 m depth. Also, the model shows another narrow zone, centered at station 180, with relatively high chargeability value (~18.0 mV/V) and starts from 25 m to more than 35 m depth. At the excavated trench of the bostonite rock (station 260), the chargeability model displays relatively high chargeability value (~18.0 mV/V) which increases with depth southwardly to reach more than 41.0 mV/V beneath station 300. This may reflects considerable surface and subsurface mineralizations beneath this locality [25] -[27] . Accordingly, a core drilling is recommended at station 260, with an angle of about 45˚ to the south.
To confirm the deduced results from the dipole length of 20 m and to follow the expected mineralization at more depths, IP measurements were conducted along the same profile with a dipole length of 40 m. The obtained inversion section models, with the surface geology (Figure 6) displayed the variations of resistivity and chargeability from the surface down to a depth of about 70 m. Examination of the resistivity model section reveals the presence of a conductive zone, with a low resistivity value (˂101.0 ohm∙m), centered between stations 280 and 320 and started from the near-surface to a depth of about 65 m. From correlation with the chargeability model, this zone corresponds to a strong chargeable zone, with chargeability value of ˃25.0 mV/V, which may reflect a considerable massive mineralization at depths varied from 30 m to more than 70 m. This zone is associated with bostonite rock and occurs close to the surface excavated trench at station 260. Therefore, a core drilling is recommended at station 320 to a depth of about 100 m to test the depth, thickness and grade of mineralization.
4.2.2. Resistivity/Chargeability along Profile 2
This line has a NNW-SSE direction and a total length of 520 m. It was performed close to the main excavated trench in the area, using dipole lengths of 20 m and 40 m to follow the observed radiometric anomalies to depths of about 35 m and 70 m, respectively.
For the dipole length of 20 m, examination of the constructed resistivity and chargeability models (Figure 7) exhibit two resistive zones, with resistivity values range from about 150.0 to more than 270.0 ohm∙m, extended laterally between stations 140 - 220 and 420 - 480 and vertically from the surface to more than 35 m depth. These zones are corresponded to low chargeability zones (chargeability < 6.4 mV/V) which are geologically associated with the high resistive slate and sandstone. Besides, a conductive zone is recorded on the resistivity model (resistivity < 63.0 ohm∙m) centered between stations 280 and 300, with a lateral extension started from station 240 to 360 and a depth varied from the near-surface to more than 35 m. It agrees well with a zone of high chargeability values (˃27.0 mV/V) centered at station 280 with a depth extended from the near-surface to more than 35 m. This zone is associated with a contact between the bostonite rock and slate, which may reflect metallic mineralization within altered materials.
On the other hand, the resistivity and chargeability models along profile 2 using a dipole length of 40 m displayed the variations from the surface down to a depth of about 70 m (Figure 8). They confirmed the deduced results from the dipole length of 20 m, where three zones of variable characters could be distinguished along this profile. Two of these zones are characterized by relatively moderate to high resistivity (85.0 - ˃ 219.0 ohm∙m) and low to moderate chargeability (2.18.0 - 11.9 mV/V), corresponding to the slate and sandstone. The third zone (stations 240 - 320) is represented by low to moderate resistivity (<85.0 ohm∙m) and moderate to high chargeability (11.9 - ˃ 23.4 mV/V). This zone extends from the near-surface down to a depth of more than 70 m. It is geologically associated with contact between the bostonite and slate and shows high radiometric values, suggesting a considerable surface and subsurface U-mineralization. Therefore, a core drilling is recommended at station 280 to a depth of about 100 m to test the depth, thickness and grade of mineralization.
4.2.3. Resistivity/Chargeability along Profile 3
This line was conducted using a dipole length of 20 m in a NE-SW direction with a total length of 480 m. The resistivity and chargeability models (Figure 9) exhibit large lateral and vertical variations allover this profile. A very wide resistivity range was recorded along the resistivity model (7.83 - 1042.0 ohm∙m) and its corresponding chargeability model (0.5 - 204.0 mV/V).
Examination of the resistivity model displayed two conductive zones, with resistivity values of less than 64.7 ohm∙m. The first is a wide zone extended laterally from station 60 to 280, with a depth ranges from 10 m to 25 m, while the second is a narrow and more conductive zone centered at station 320 and started from a depth of about 25 m to more than 35 m. By correlation with the chargeability model and the corresponding surface geology (Figure 9), the first and second conductive zones are corresponded to low and moderate chargeability values, respectively, which suggests the presence of clays or altered materials. On the other hand, the resistivity model displayed two different resistive zones. The first is extended between stations 300 and 440, with a depth ranges from the surface to about 15 m. This zone is marked by relatively high resistivity values (range from 265.0 to 535.0 ohm∙m) and low chargeability (around 2.0 mV/V), which is geologically associated with shallow resistive sandstone and slate. The second zone is marked by higher resistivity values (range from 265.0 to more than 1042.0 ohm∙m) and extended between stations 120 and 280, starting from about 20 m and opening downwardly to more than 35 m depth. This very high resistive zone agrees well with a zone of anomalously high chargeability values (range from 37.0 to more than 204.0 mV/V), centered between station 180 and 200, which suggests high contents of disseminated mineralization at this part [25] -[27] . Therefore, a core drilling is recommended at station 180 with an angle of 45˚ to the east.
5. Conclusions and Recommendations
The integration between Gamma-ray spectrometry and induced polarization studies for El Atshan-II uranium prospect area, central Eastern Desert, Egypt, enabled the identification of the concentration and spatial distribution of the three radioactive elements eU, eTh and K in the area, and obtaining information about the lateral and vertical variations for both the lithology and anomalously high radioactivity localities at different depths, reach about 70 m. In general, results of these studies can be outlined in the following conclusions:
1) The gamma-ray spectrometry data revealed that the study area has a wide radioactivity range, oscillating from 15 to 2362 Ur, 0.5 to 307.2 ppm, 0.1 to 55.1 ppm and 0.3% to 22.0% for the total count (Tc), equivalent uranium (eU), equivalent thorium (eTh) and potassium (K), respectively.
2) The different radioelement concentration maps and false-color eU-composite image showed that the anomalously high radioactivity parts are mainly associated with outcrops of the bostonite rock, which are recorded at the central, southern and southwestern parts of the study area.
3) There is a good correlation between the anomalously high radioactivity parts, as inferred from the ground gamma-ray spectrometry survey and the resistivity and chargeability anomalies in the study area.
Based on the result of gamma-ray and induced polarization surveys, the study area is of considerable significant in view of the surface and subsurface U exploration. Thus, a core drilling is highly recommended to a depth of about 100 m at stations 320, 280 and 180 along profiles 1, 2 and 3, respectively, to test the depth, thickness and grade of U mineralization in these localities.
Acknowledgements
The authors are deeply grateful to Prof. Dr. Hamdy I. E. Hassanein, Exploration Division, Nuclear Materials Authority, Egypt, for fruitful comments and review of the manuscript.
References
- Moxham, R.M. (1963) Natural Radioactivity in Washington Country, Maryland. Geophysics, 28, 262-272. http://dx.doi.org/10.1190/1.1439174
- Durrance, E.M. (1986) Radioactivity in Geology. Principles and Applications. Ellis Horwood Series in Geology, 441 p.
- International Atomic Energy Agency (IAEA) (2003) Guidelines for Radioelement Mapping Using Gamma ray Spectrometry Data. IAEA-TECDOC-1363, Vienna, 179 p.
- El Manharawy, M.S. (1972) Isotopic Ages and Origin of Some Uranium Bearing Volcanic Rocks in Egypt. M.Sc. Thesis, Cairo University, Egypt, 147 p.
- Mahdy, M.A., Salman, A.B. and Assaf, H.S. (1994) Bostonite Rocks as Additional Uranium Resources in Egypt. Second International Conference of the Geology of the Arab World, Cairo University, Egypt, 77-96.
- Abdel Gawad, A.M. (1964) Mineralogy, Geochemistry and Radioactivity of El Atshan Uranium Deposit, Eastern Desert, U.A.R. Internal Report, U.A.R. Atomic Energy Establishment, Cairo.
- Assaf, H.S. (1966) Ground Exploration and Geological Studies on Some Radioactive Occurrence in the Area South Qusseir. M.Sc. Thesis, Faculty of Science, Ain Shams University, Cairo, 85 p.
- El Kassas, I.A. (1969) Comparative Geological Investigations of the Radioactive Mineralization in the Central Eastern Desert, Egypt. M.Sc. Thesis, Faculty of Science, Ain Shams University, Cairo, 132 p.
- Bakhit, F.S. (1972) Geological Studies and Radiometric Investigation at Um Huyut-Kab El Abiad Area, Eastern Desert, Egypt. M.Sc. Thesis, Faculty of Science, Ain Shams University, Cairo, 132 p.
- Hussein, A.H. and El Kassas, I.A. (1972) Occurrences of Some Primary Uranium Mineralization at El Atshan Locality, Central Eastern Desert. Journal of Geology of the United Arab Republic, 14, 97-111.
- Hussein H.A. and Bakhit, F.S. (1988) Uranium-Bearing Alkaline Volcanics of North Wadi Kariem and Surroundings, Central Eastern Desert, Egypt. Mining Geology, 38, 39-48.
- Geosoft Inc. (2010) Geosoft Mapping and Processing System. Geosoft Inc., Toronto.
- Sharma, P.V. (1997) Environmental and Engineering Geophysics. Cambridge University Press, Cambridge, 1-475. http://dx.doi.org/10.1017/CBO9781139171168.002
- Telford, W.M., Geldart, L.P. and Sheriff, R.E. (1990) Applied Geophysics. 2nd Edition, Cambridge University Press, Cambridge, 770 p.
- Darnley, A.G. (1973) Airborne Gamma-Ray Techniques—Present and Future; Uranium Exploration Methods. International Atomic Energy Agency, Proceedings of a Panel, Vienna, 67-108.
- Boyle, R.W. (1982) Geochemical Prospecting for Thorium and Uranium Deposits. Elsevier, Amsterdam & New York, 498 p.
- Duval, J.S. (1983) Composite Color Images of Aerial Gamma-Ray Spectrometric Data. Geophysics, 48, 722-735.http://dx.doi.org/10.1190/1.1441502
- Darnely, A.G. and Ford, K.L. (1989) Regional Airborne Gamma-Ray Surveys, a Review. In: Garland, G.D., Ed., Proceedings of Exploration ‘87, 3rd Decennial International Conference on Geophysical and Geochemical Exploration for Minerals and Groundwater, Ontario Ministry of Northern Development and Mines, Ontario, 229-240.
- Sarma, D.D. and Koch, G.S. (1980) A Statistical Analysis of Exploration Geochemical Data for Uranium. Mathematical Geology, 12, 99-114.
- Adams, J.A.S., Osmand, J.K. and Rogers, J.J.W. (1956) The Geochemistry of Thorium and Uranium. In: Physics and Chemistry of the Earth, Pergamon Press, New York, 298-348.
- Clark, S.P., Peterman, Z.E. and Heier, K.S. (1966) Abundances of Uranium, Thorium and Potassium. Handbook of Physical Constant. Geological Society of America Memoirs, 97, 521-542.
- Rogers, J.J.W., Ghuma, M.A., Nagy, R.M., Greenberg, J.K. and Fullagar, P.D. (1978) Plutonism in Pan-African Belts and Geologic Evolution of Northeastern Africa. Earth and Planetary Science Letters, 39, 109-117.http://dx.doi.org/10.1016/0012-821X(78)90147-4
- Saunders, D.F. and Potts, M.J. (1976) Interpretation and Application of High Sensitivity Airborne Gamma Ray Spectrometric Data. In: Exploration for Uranium Ore Deposits. Proceedings Series, International Atomic Energy Agency, Vienna, 1976, 107-124.
- LoKe, M.H. (2003) RES2DINV-Rapid 2D Resistivity and IP Inversion Using the Least-Squares Method. Geotomo Software Manual, Malaysia.
- Allis, R. (1990) Geophysical Anomalies over Epithermal Systems. Journal of Geochemical Exploration, 36, 339-374.http://dx.doi.org/10.1016/0375-6742(90)90060-N
- Irvine, R.J. and Smith, M.J. (1990) Geophysical Exploration for Epithermal Gold Deposits. Journal of Geochemical Exploration, 36, 375-412. http://dx.doi.org/10.1016/0375-6742(90)90061-E
- White, R.M.S., Collins, S., Denne, R., Hee, R. and Brown, P. (2001) A New Survey Design for 3D IP Inversion Modeling at Copper Hill. Exploration Geophysics, 32, 152-155. http://dx.doi.org/10.1016/0375-6742(90)90061-E