American Journal of Operations Research
Vol.4 No.2(2014), Article ID:44150,18 pages DOI:10.4236/ajor.2014.42008
Invariance and Noises of Shannon Entropy for Information on Oxidative Activity of DNA in All Living Cells for Medical Diagnostics
Nikolay E. Galich
Department of Experimental Physics, Saint-Petersburg State Polytechnic University, Saint-Petersburg, Russia
Email: n.galich@mail.ru
Copyright © 2014 by author and Scientific Research Publishing Inc.
This work is licensed under the Creative Commons Attribution International License (CC BY).
http://creativecommons.org/licenses/by/4.0/


Received 31 October 2013; revised 30 November 2013; accepted 8 December 2013
ABSTRACT
We analyze oxidative activity of DNA due to fluorescence of chromosomes inside cells, using flow cytometry method with nanometer spatial resolution. Statistics of fluorescence is presented in histogram as frequency distributions of flashes in the dependence on their intensity and in distributions of Shannon entropy, which was defined on the base of normalized distribution of information in original histogram for frequency of flashes. We show that overall sum of entropy, i.e. total entropy E , for any histogram is invariant and has identical trends of changes all values of E(r) = lnr at reduction of histogram’ rank r. This invariance reflects informational homeostasis of chromosomes activity in multi-scale networks of entropy inside all cells in various samples of blood for DNA inside neutrophils, lymphocytes, inside all leukocytes of human and inside chicken erythrocytes for various dyes, colors and various excitations of fluorescence. Informational homeostasis of oxidative activity of 3D DNA in the full set of chromosomes inside living cells exists for any Shannon-Weaver index of biodiversity of cells, at any state of health different beings. Regulation perturbations in information activity DNA provides informational adaptability and vitality of cells at homeostasis support. Noises of entropy, during regulation of informational homeostasis, depend on the states of health in real time. The main structural reconstructions of chromosomal correlations, corresponding to self-regulation of homeostasis, occur in the most large-scale networks of entropy, for rank r<32. We show that stability of homeostasis is supported by activity of all 46 chromosomes inside cells. Patterns, hidden switching and branching in sequences of averages of Hölder and central moments for noises in regulation of homeostasis define new opportunities in diagnostics of health and immunity. All people and all aerobic beings have one overall homeostatic level for countdown of information activity of DNA inside cells. We noted very bad and dangerous properties of artificial cells with other levels of informational homeostasis for all aerobic beings in foods, medical treatment and in biotechnologies.
Keywords:Averages of Hölder for Noises of Shannon Entropy in Homeostasis Regulation of Total Shannon Entropy; Entropy and Information of DNA Activity in Cells; Information Entropy for Oxidizing Activity of DNA; Informational Homeostasis and Self-Regulation of DNA Activity in Cells; Noise of Information Entropy

1. Introduction
There are a variety of different features for large-scale oxidative activity of DNA that determine the body’s vital functions [1] . Waiver from smoothing, from an arbitrary replacing and change in sequence of transforms for scaling and wavelets, for intermediate calculations and statistical averaging, waiver from mixed using of a priori and a posteriori statistical hypotheses, etc., lead to the branching of correlations and give more detailed and meaningful results for coding and non-coding regions of DNA for full set of chromosomes inside cells, etc. [2] -[4] .
We are focused on the minimal presence, until deletion, any statistical hypotheses and assumptions in our nonlinear analysis of experiments for DNA activity in living cells. We don’t use the genomic data for all of humanity as a whole. We oriented on medical diagnostics of health status based on oxidative activity of DNA in cells for everyday clinical practice, for given person at given time. Oxidative activity of DNA is visualized in fluorescence. We analyze experimental data on DNA fluorescence in neutrophils of peripheral blood at biochemical reaction of oxidative burst [5] . This is high sensitive method for diagnosing many different and complex diseases, early diagnostics of illnesses, hidden diseases. Short list of clinical observations is given in [5] -[8] . DNA fluorescence presented in histograms, which are formed by flow cytometry method with spatial resolution of measurements at a few nanometers in the flow direction [9] [10] . Statistics of fluorescence is presented in histograms for normalized frequency distributions of fluorescence, i.e. normalized frequency of flashes P(I) as the functions of fluorescence intensity I for large populations of many ten thousands of cells, living in different parts of human body.
1.1. Experimental Features
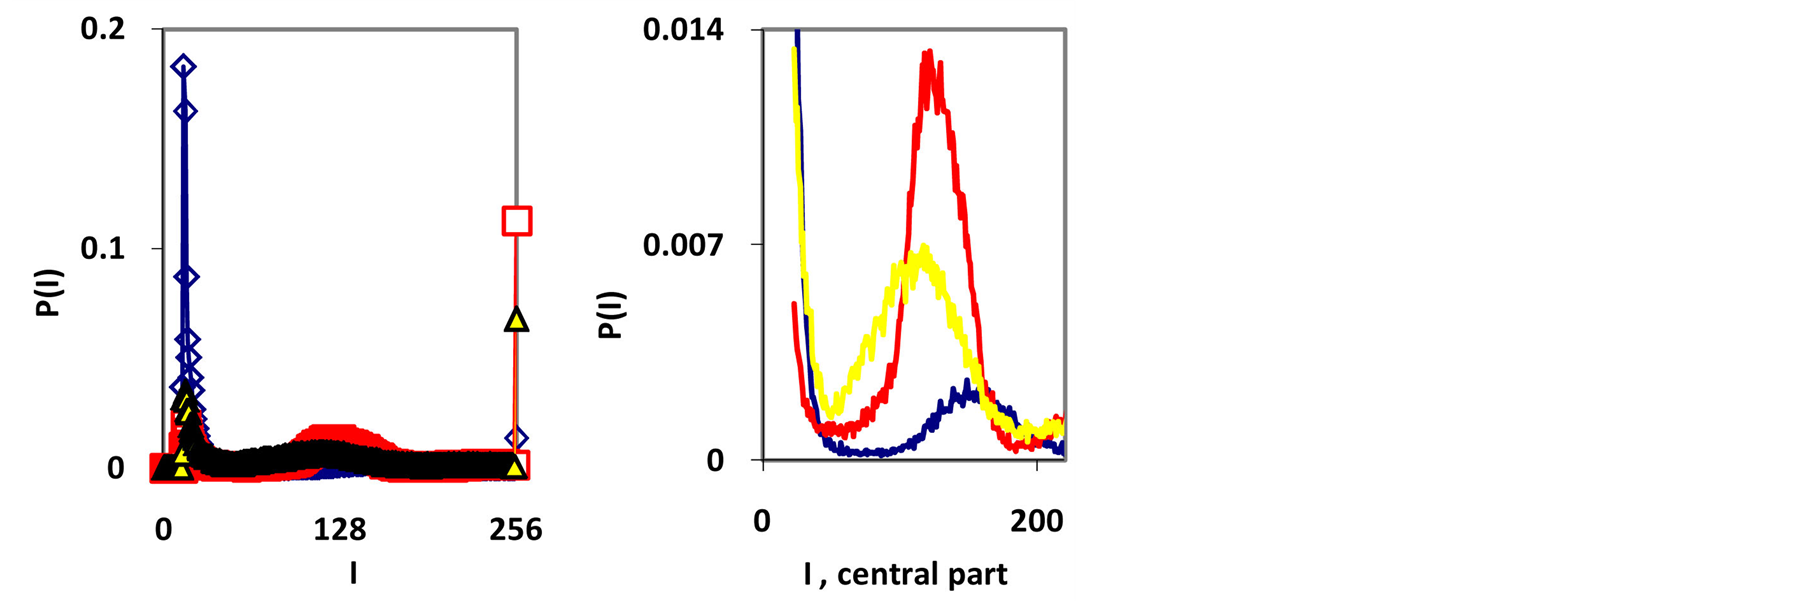
Typical examples of original histograms are shown in Figure 1 for a good health, bronchial asthma and oncology, as different illustrations of inflammations, autoimmune diseases and a positive immunity of a healthy man.
Immune system interconnected with different networks of diverse populations of young and old neutrophils in the human body such as networks of metabolic, geographical, ecological, information, genetics, migration and other processes during blood circulation. The fragments of nuclear and mitochondrial DNA with oxidants determine the basic place for localization of fluorescent dye, its distributions, intensity and statistics of fluorescence. These fragments may belong to the coding and non-coding portions of DNA. The heterogeneities of fluorescence varied chromosomes reflect genetic, special, individual features and immune response to the pathogenic actions. Detailed descriptions our experimental procedures for dyeing DNA by ethidium bromid were presented in [5] -[9] . These biochemical procedures are typical for small values of blood ~ 1... 2 ml. Red fluorescence of the cells with maximum wavelength ~600 nm is excited by a beam of argon laser with wavelength ~ 488 nm. Now we analyze only large-scale activity of DNA for 256 measuring channels of fluorescence intensity I. Accuracy and reproducibility of experimental results approximately equal to 2% that corresponds to the normal, usual levels of inevitable and fatal errors and fluctuations of physical and biological nature [5] . Three the original histograms are shown in Figure 1.
The inevitable noises of immune fluorescence, shown in Figure1b, are formed by the large-scale correlations at DNA activity in cells and represent an actual ‘terra incognita’, if we don’t use any forced smoothing. These noises differ by the structural peculiarities, up to the changes of positive and negative signs for wavelet spectra of noises at various states of health, as are in the cases with different gene expressions [8] .
Registration of fluorescence with flash duration ~10−9 - 10−8 s in the jet of blood flowing through the laser beam with velocity ~1 - 10 m/s provides measurement with spatial scales ~10−9 - 10−8 m in the flow direction [9] [10] . Registration of very small heterogeneities in fluorescing neutrophils, at few nanometers, allows detecting manifold new structural peculiarities of DNA activity in living cells, with full set of chromosomes, for all large-scale chromosomal and inter chromosomal correlations, for medical diagnostics. These small-scale pecu-
 (a) (b)
Figure 1. (a) Dependence for frequency of flashes P(I) on their intensity I(r = 256) for fluorescing DNA in neutrophils; (b) only central part of histogram (a); (a) The area under the final histograms of P (I) normalized to unit; rhombuses points correspond to bronchial asthma. Total number of flashes is N0 = 76 623; quadrate points correspond to the healthy donor. Common number of flashes is N0 = 40 109; triangle points correspond to the oncology disease. Common number of flashes is N0= 40 752.
liarities cannot be seen in the optical microscope. Each cell has chaotic Brownian motions and chaotic rotations during jet flow of blood through the laser beam at flow cytometry measurements. Thus, we analyze various experimental data for 3D-correlations of nuclear DNA in large populations ~104 - 105 of fluorescing cells with rather high spatial resolution in the flow direction. As well known real 3D-inner life of genome in various cells [11] [12] differs from the linear and the same schematic extrapolations for isolated DNA. Real 3D large-scale correlations of DNA activity in cells virtually not been studied.
1.2. Informational Features
Recently we had found very important empirical invariant for information nentropy, i.e. unified value of total Shannon entropy E(J), based on frequency distributions of information J(I) = −lnP(I), for fluorescing DNA inside human neutrophils in any samples of blood [9] [13] . This invariant defines the informational homeostasis due to oxidizing activity of DNA for full set of chromosomes in all living cells. This invariant defines a total zero level for countdown all chromosomal correlations for different health conditions of various persons in vivo and in medical treatment, in genomics, etc. [9] [13] . Thus, we have a clear idea about the choice the distributions of information entropy E(J(I)) as the main variables for comparison of various data on informational activity of DNA inside different cells.
Statistics of immunofluorescence is essentially non-Gaussian [7] -[9] . At present, we don't know clearly qualitative and quantitative criteria for comparison and accurate assessments different distributions of immunofluorescence. Unfortunately, there are exist various statistical instabilities for any local distributions of P(I) [6] -[9] . Therefore, the standard methods of statistical analysis here are not suitable, cannot be applicable and do not work [6] -[9] . We develop new approaches of nonlinear analysis to various unsolved problems such as biodiversity, structure, architecture, topology, stability and switching for large-scale DNA networks in living cells for medical diagnostics [7] -[10] [13] .
Now we concentrated on the noises and information transfer for DNA activity in cells. Oddly enough that is now fully absent any definition and account of real noises in the chemical reactions of DNA oxidation for stability and transmission of information in a living cell. Are not defined the functions and roles of these noises in the life and metabolic regulation inside cells, in chromosomal and inter-chromosomal correlations. Variability and regulation the dynamics of life, as and the level of noises, always are the base for definition the key position of reliability and transmission of any information in nature and technology, and in the evolution of people’s daily lives. How estimate quality of DNA communications, information and information entropy of DNA activity inside cells? What need for comparison of various data on informational activity of DNA in cell for given person in real time? How to determine structure of large-scale correlations of information activity of DNA in cells, level of information noises and switching of information transfer inside cells at different states of health?
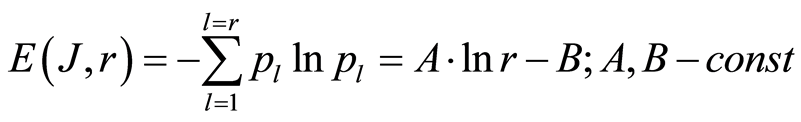
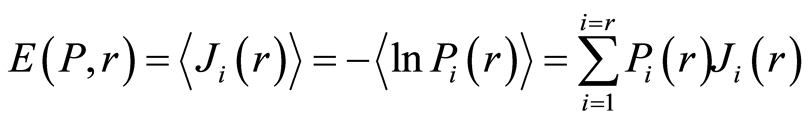
In the Part 2 of this article we define informational homeostasis as invariance of total Shannon entropy E(J, r), for information J at rank r inside all cells, i.e. as overall empirical rule of E(J, r) = lnr, for entropy E(J, r)) based on the normalized distribution of information J(I) = −lnP(I) for fluorescing DNA inside neutrophils (see equations (1), (2)).
In the Part 3 of the article we present experimental illustrations of informational homeostasis E(J, r) = lnr inside different cells in various samples of blood for DNA inside human neutrophils, lymphocytes, inside all leukocytes of human and inside chicken erythrocytes for various dyes, various colors and various excitations of fluorescence.
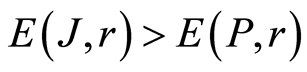
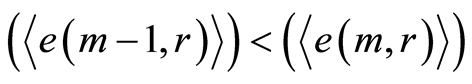
In the Part 4 of the article we show that total Shannon entropy for information on DNA activity, i.e. total Shannon entropy E(J, r) = lnr, always more than total Shannon entropy E(P, r) for DNA activity inside cells (Shannon-Weaver biodiversity of cells), i.e. Shannon Weaver biodiversity of cells E(P, r) < E(J, r) is less than biodiversity E(J, r) of information on DNA activity in homeostasis. Here also discussed main physical and information peculiarities of invariance of total Shannon entropy E(J, r) = lnr and possible origin of homeostasis.
In the Part 5 of this article we introduce deviations and noises near homeostatic level E(J, r) = lnr of total Shannon entropy E(J, r). Here define two approaches for description varied regulation of information homeostasis in the dependence on the states of health. We observed various changes in dynamics of decreasing and increasing the sequences of central moments and Holder’s averages for noises of Shannon entropy at different states of health. Switching of these averages from low to very high level reflect different pathology in the states of health. We show that regulation of homeostasis is ensured by common participation and correlations of all 46 chromosomes inside cells.
In the Part 6 of the article we present short conclusions. Here also present a question and discussions the role of information homeostasis for selection of a good and bad artificial life (artificial cells) in a good and bad biotechnologies from the point of view a homeostasis condition in cell life of human and all aerobic beings. Clear criteria of a bad and dangerous biotechnology connected with violation of homeostatic level of entropy E(J, r) = lnr and (or) existence other levels of homeostasis of information entropy for artificial cells inside human body, as in a good substrate.
2. Informational Homeostasis for Oxidative Activity of DNA inside Cells from Birth to Death; Three Examples for Neutrophils
Adequate and correct correlations for DNA activity in cells, without artificial assumptions and smoothing of any experimental data, must be interconnected with systematic investigations of Shannon’ entropies. Here Shannon; entropies define level of functional and informational constraints for DNA correlations inside cells and are used as the measures of sequences variability. Shannon’ entropies for one and the same experimental data depend on the choice of probabilistic measure based on original histograms for frequency of flashes P(I). Basic probabilistic measure may serve a frequency of flashes P(I) [6] -[8] [10] , frequency of standard deviations ~{P(I) -
}2 [14], frequency for distributions of information J = −LnP(I) [9] [10] [13] [14] , etc. Each probabilistic measure corresponds to own class of information, entropy, topology (fractals) and varied chromosomal networks for DNA activity inside cells [9] [10] [13] [14] .
Let us define distributions of Shannon entropy E(J(I)) based on information J(I) = LnP(I) for frequency flashes of fluorescence P(I). Let us consider the probability density . i.e. frequency distribution
  the number of flashes,
  , where
  is the number of measuring channel,
 ;
;  is the total number of flashes;
  is the number of flashes with the assigned intensity
 ; dimensionless intensity
  coincides with the number of measuring channel
 , i.e.
 ;
;  is the mean probability value; symbol
  denotes the statistical average for number flashes of fluorescence in all of r =
256 channels of intensity measurement. The mean value of  is equal to 1/256 for r = 256 channels of intensity measurement. Three examples of frequency distributions of
  for different donors with varied states of health are shown in Figure 1.
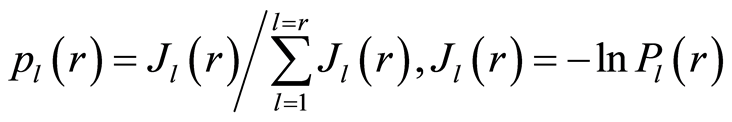
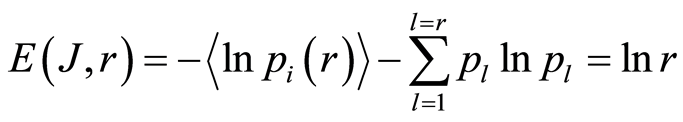
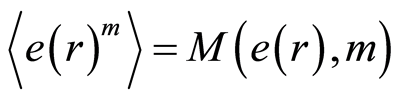
Distribution of information  defined as
 (1)
(1)
Let us consider normalized distribution of information
 (2)
(2)
as the probabilistic measure for frequency distributions of Shannon entropy 
 , (3)
, (3)
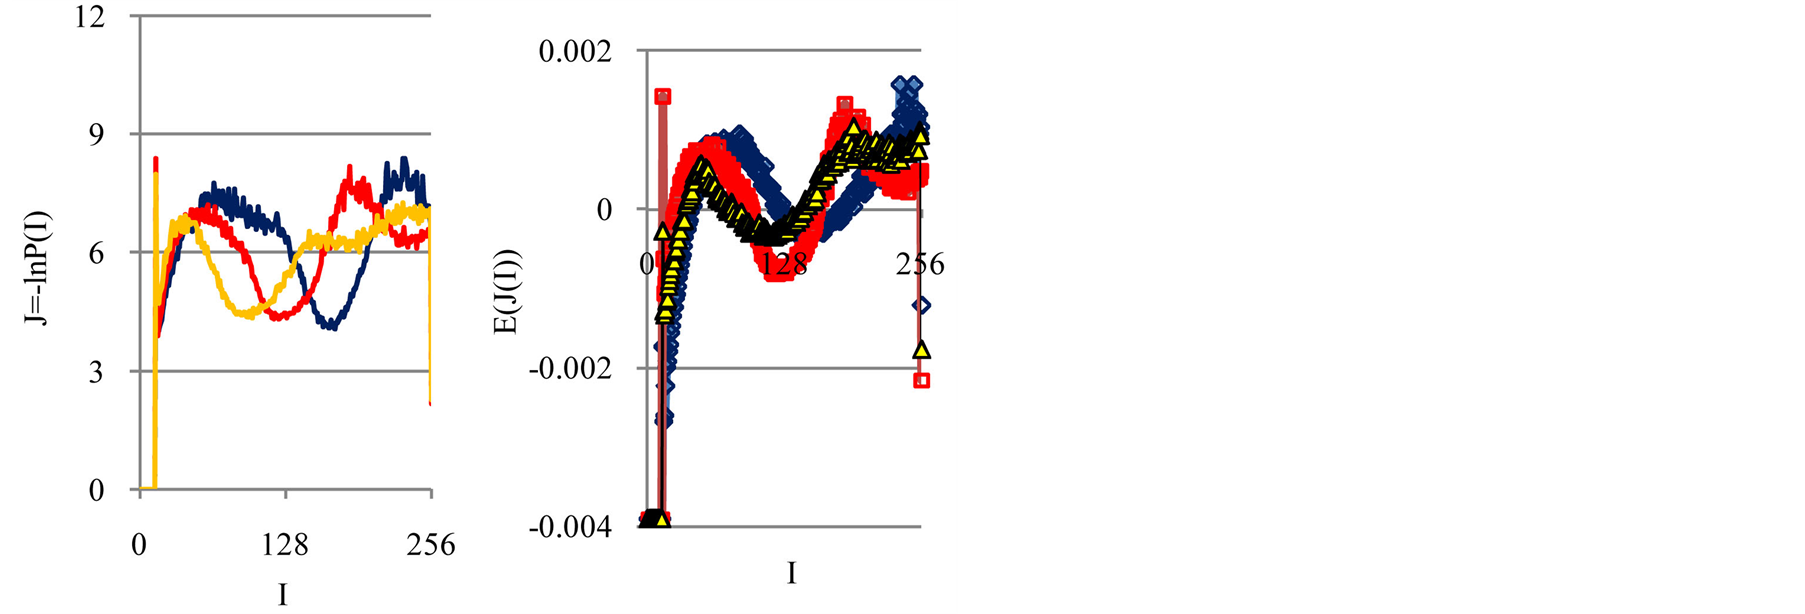
Three examples of frequency distributions of Shannon entropy , based on the frequency distributions of information
  in Figure 2(a), are shown in Figure 2(b).
In Figures 2(a) we see a very strong roughness and differences in information  over a wide range of changing the order of values J(I)from zero up to ten. Typical level of information is about J ~ 7. Maximal level of information noise reaches 20%. High level of noises instead of a smooth continuity for all local distributions of information
  reflects main natural properties of DNA activity, which provide main correlations in oxidative activity of DNA inside cells, in gene's networks, metabolism and cell viability. Any forced smoothing of experimental data here hampering any our attempts to adequate perception of real life DNA inside living cells.
Data analysis for all experiments has shown a conservation of identical values of total Shannon entropy in any cells
 , (4)
, (4)
Thus, total Shannon entropy E(J) is empirical invariant, for all neutrophils in all donors [5] [7] . Value of total entropy  depends on given rank r of histogram (see Figure 3 and equation (7)). Rank r is defined by the maximal number of measuring channels Imax = r. At rank r=256 all experimental data, for all donors give one and the same value of
  with standard deviation ~2%, within limits of typical for flow cytometry experimental errors ~2% at 256 measuring channels [1] [2] .
Decreasing rank r leads to decreasing the value of invariant , as it is shown in Figure 3 at different rank r. Other examples of informational homeostasis for different patients with various diseases had shown in [5] .
Here, as everywhere, are used different terms a rank r and range r for the same value of r. Range of histogram r interconnected with the selection of multistage clusters in networks with structure of bronchial tree; here range r coincides with the number of columns in a histogram or with the number of channels for measurements of fluorescence intensity at given maximal value of dimensionless intensity, i.e. r = Imax. In our experiments the number of channels is r = 256. Variations of range r, i.e. rank of histogram r, or variations the scale r, when r = Imax, provide the changes in irregularity and brokenness of frequency distribution of fluorescence for histograms of various rank r. Various examples decreasing of histograms rank r presented in [3] [5] [7] . Reduced distribution of information is . Normalized frequency of information
  during reduction of range r is
 , (5)
, (5)
Frequency distribution of entropy  for an arbitrary rank r is
 (6)
(6)
Total entropy  is invariant, identical for given r in all cells. Total entropy
  depends only on rank r, as it is shown in Figure 3. Dependence of
 ) on rank r in Figure 3 is logarithmic
 (7)
(7)
More detailed approximation of total entropy  is
is
 (a) (b)
Figure 2. (a) Logarithmic dependence LnP(I) for frequency of flashes P(I) on their intensity I(r = 256);The area under the initial histograms of P (I) normalized to unit; Original histograms for P(I) shown in Figure 1; (b) Normalized distributions of information entropy E(J(I)) in the dependence on fluorescence intensity I(r = 256); rhombuses correspond to bronchial asthma. Total number of flashes is N0 = 76 623; squares correspond to the healthy donor, N0 = 40 109; cross correspond to the oncology disease. Common number of flashes is N0= 40 752.
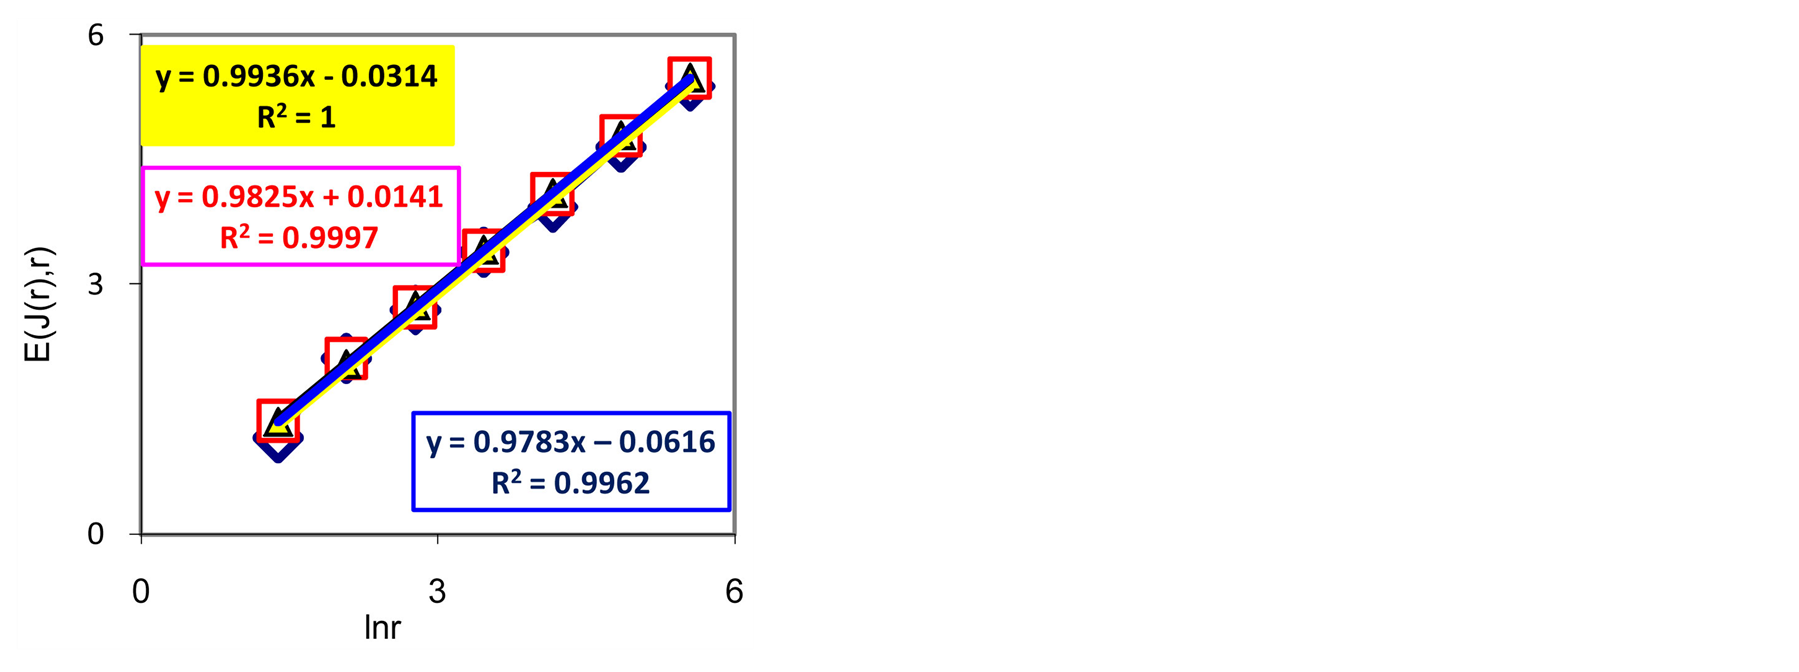
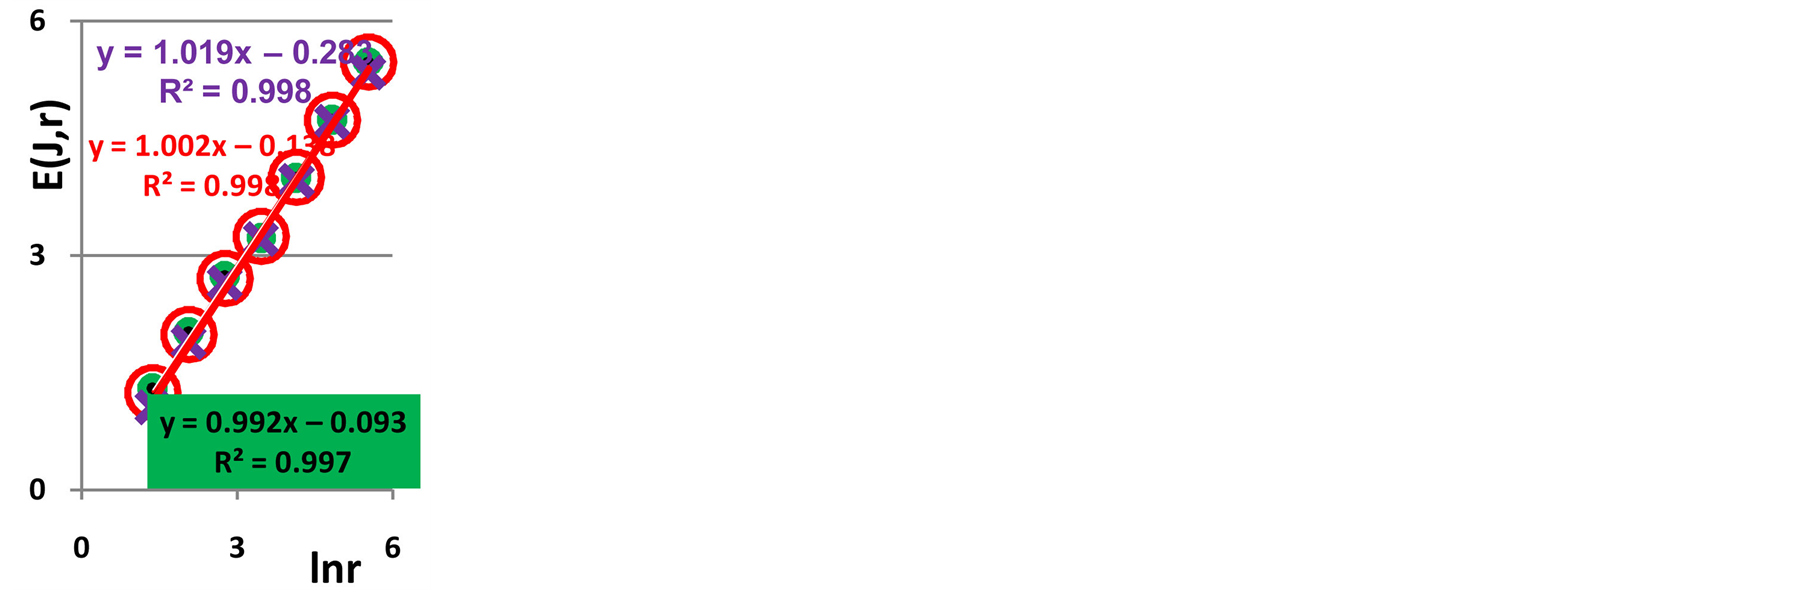
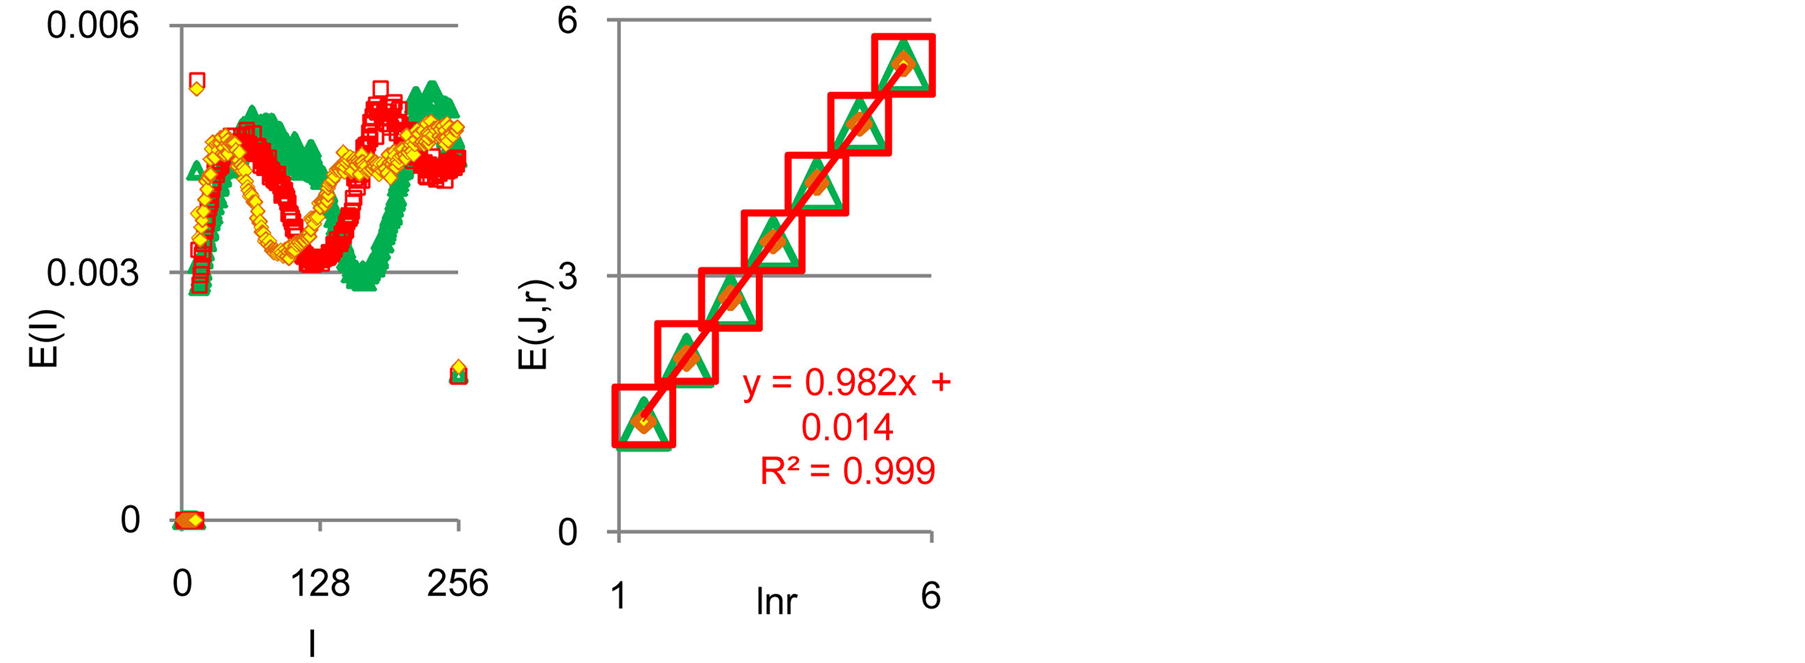
Figure 3. Dependence of total Shannon information entropy E(J, r) = lnr on logarithm of range r; initial histograms at range r = 256 shown in Figures 1(a) and 2(b).
 (8)
(8)
Experimental data analysis shows that typical variations different values of dimensionless parameters A and B in approximation (8) are A = 1.015 … 0.978 and B = 0.01… 0.21; maximal variations correspond to multiple diseases with the multiple allergies. Theoretical estimation gives single value of B = 0; for single channel measurements of fluorescence, as lower bound of values B, we have value of rank r = 1, probability of flashes p = 1, information J = 0, information entropy 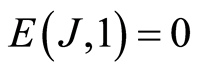 and, therefore, B = 0. Thus, the limits of estimations for value of A in equetion (8) is close to A=1 and for entropy E(J, r) is close to
 , as in equation (7). Range r here connected with selection of multistage clusters in DNA networks with given scale r, as in the bronchial tree [7] . The lower bound of range r from within of which is the fair logarithmic dependence
  here is r = 4. The upper bound of range r from within of which is the fair logarithmic dependence
  here is not defined. Maximum of theoretical limit of maximal magnitude r here depends on the number of nucleotides in DNA and its conformations inside cells.
Interesting to compare Shannon information entropy
 and Boltzmann entropy S = klnW. Range r characterizes maximal number of channels, i.e. the scale r or cluster size of informational networks, for registration of DNA activity. In perfected case of A = 1, for ideal approximation
 , we have
 ), as something similar to exponent of Gibbs, Arrhenius or time of Kramers at switching of bistability [15] .
Informational homeostasis of total Shannon entropy  for information on oxidative activity of DNA is observed in all cells of blood different old and young patients with various states of health and all the time. It means existence of informational homeostasis of DNA during all life time of cells from birth to death.
3. Informational Homeostasis E(r) = lnr for DNA Activity Exists Not Only in Neutrophils
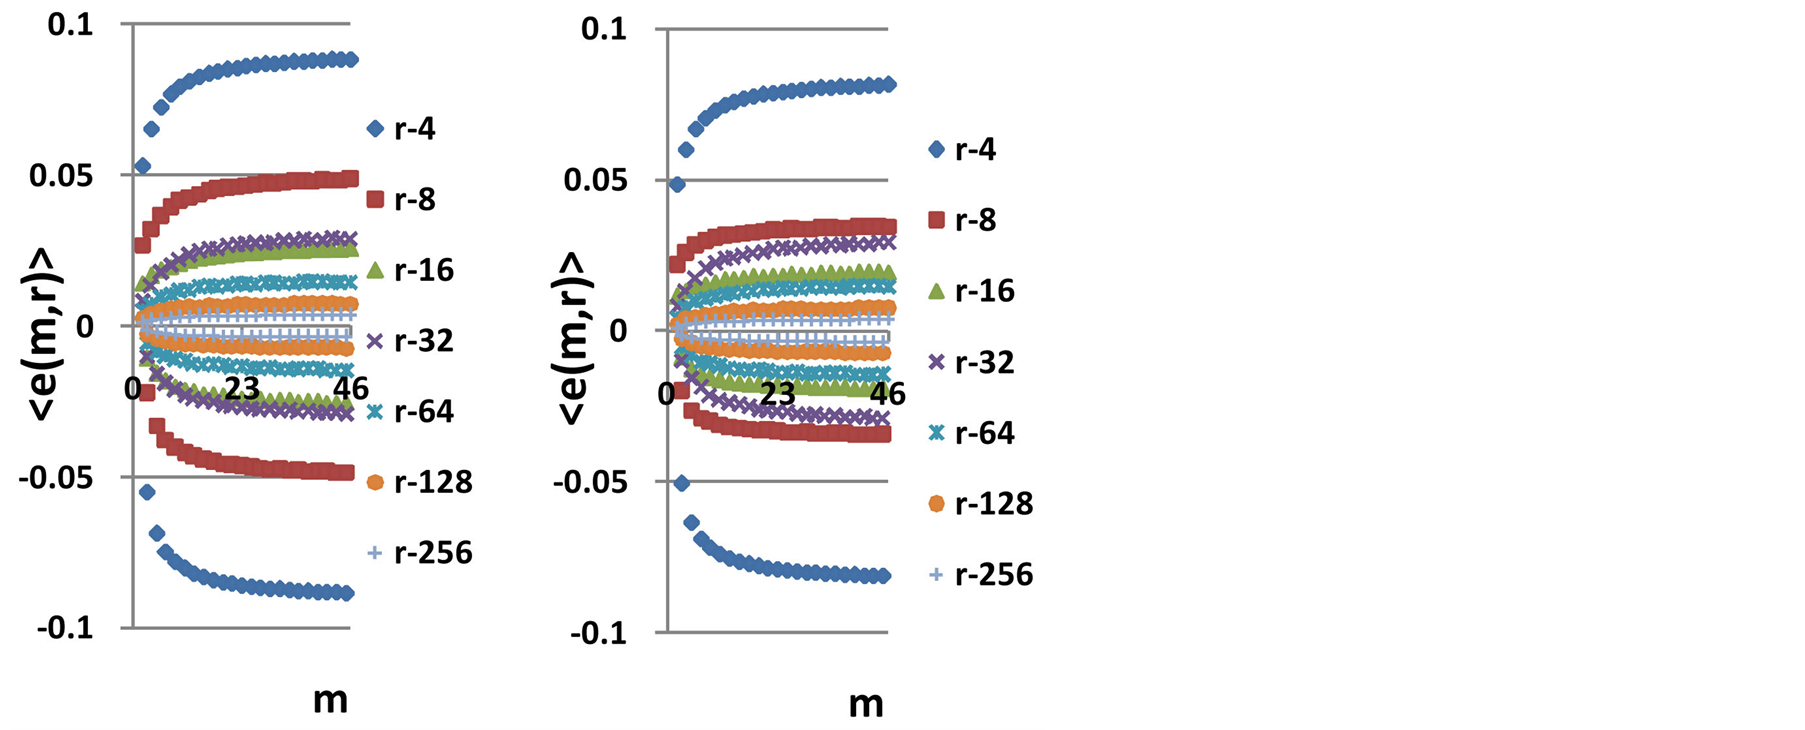
In Figures 4(d) and 5(d) shown that informational homeostasis exists for DNA inside human lymphocytes, in all leukocytes of human and inside chicken erythrocytes for various dyes, for green and red glow at different excitations of fluorescence by argon laser beam and light of mercury lamp.
Green (blue-green) fluorescence of DNA inside human lymphocytes at wavelength ~480 nm is ensured by small additive of Hoechst 33342 with concentration 2  to blood sample. Green fluorescence is initiated by ultraviolet radiation of mercury lamp at wavelength ~360 nm. The same conditions used for observations of green fluorescence of chicken erythrocytes. Various histograms for fluorescing chicken erythrocytes and human lymphocytes are shown in Figures 4.
Two exampels of red fluorescence of human leukocytes and human neutrophils are shown in Figures 5.
We used the additions of hydroethidine with concentration 150  for dyeing of all human leukocytes and individually of all neutrophils in the blood. Hydroethidine binds with fragments of nuclear DNA with oxidative activity and ensures strong red glow at fluorescence, which excited by Argon laser beam. Small additive of phorbol myristate acetate (PMA) with concentration
  to blood sample ensures the dominating intensive staining of the cell nuclei of neutrophils. At absence of phorbol myristate acetate is ensured dyeing of all human leukocytes. The same conditions were used for observations of red fluorescence of chicken erythrocytes.
We observe one and the same behavior of total Shannon entropy  in the dependence of range r for all DNA, in all cells, for all dyes, for green and red colors of fluorescence in Figures 4(d), 5(d). We may to propose that empirical law in equation (8) is the general law for all cells of all aerobic organisms.
In order to illustrate changeability of immunofluorescence for one and the same healthy donor during one year, in real time, let us consider histograms for fluorescence of neutrophils in Figure 6.
Distributions of entropy are shown in Figures 7.
Data analysis shown that logarithmic behavior in the dependence on range r is typical also for Shannon-Weaver biodiversity of neutrophils  at different values of C for various diseases [9] [10] . Let us define Shannon-Weaver biodiversity of fluorescing neutrophils. The function of
  can be considered as density of probability for frequency of flashes Pi. We can enter the information for the frequency distribution of flashes
 . In this case a statistical definition of Shannon entropy as average value of information
 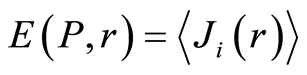 may to rewrite in the form
 (9)
(9)
Shannon entropy  for frequency distribution of flashes
  depends on the histogram's range r, which coincides with the maximal number of channels of intensity measurements at given range r. Information
  is defined by the flash probability
  of fluorescing neutrophils with specified intensity in the specified channel. Thus, fluorescence’ histogram visualizes the probability of existence of neutrophils with a specific oxidative activity of chromosomes in the given sample of blood. Therefore, Shannon entropy
  also characterizes the index of Shannon-Weaver
  [9] [10] for biological diversity of neutrophils. Distinctive features of neutrophils here are determined by variation of oxidizing activity of fluorescing DNA inside cells. Distinctions in neutrophil activity for oxygen metabolism and their ability to fluorescence interconnected with peculiarities of chromosomes structure and large-scale chromosomal correlations in the nuc-
 (a)
(a)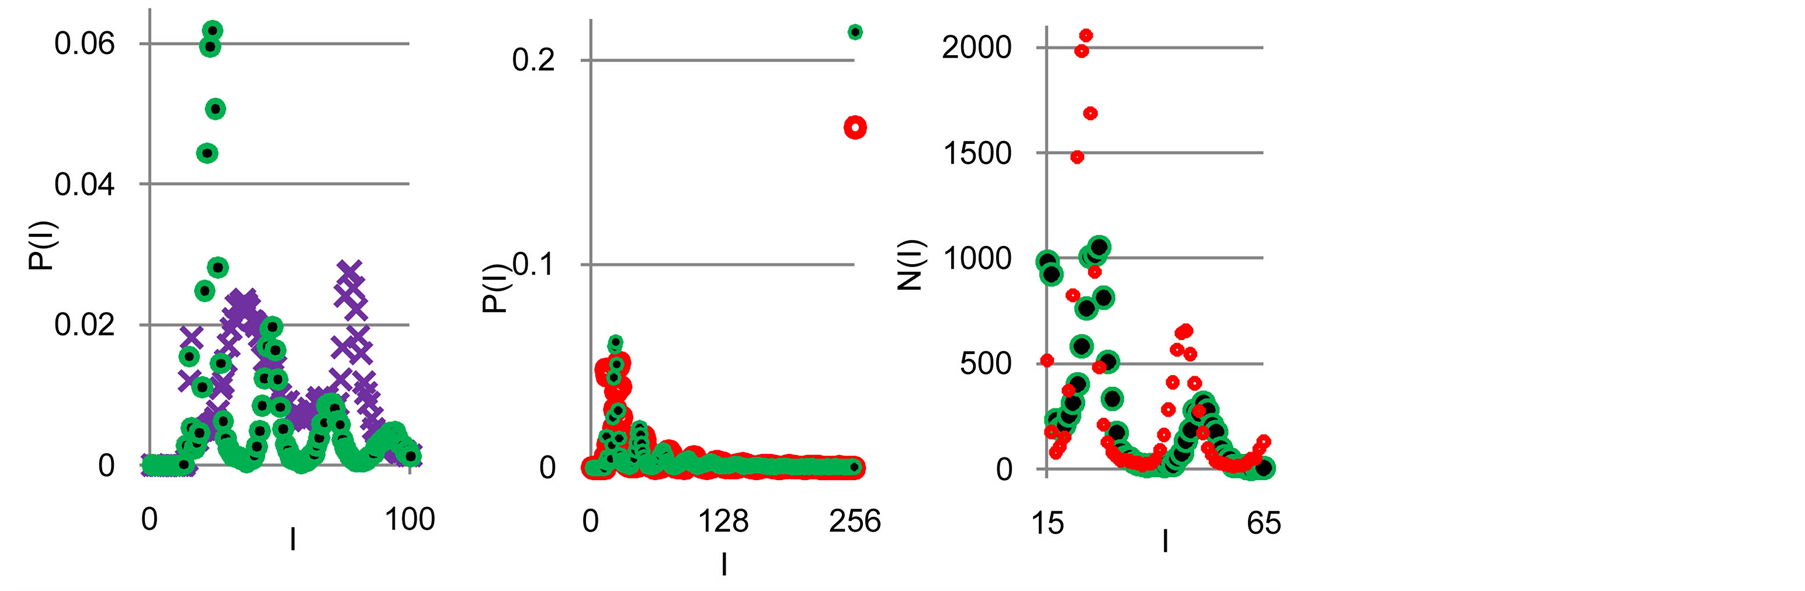 (b)
(b)
Figure 4. (a) Central part of histogram for green fluorescence of DNA (Hoechst 33342) for chicken erythrocytes (green points) and DNA in lymphocytes of healthy human (violet cross points). Total number of flashes N0 = 33 277 and N0 = 37 462; (b) and (c) Dependence for frequency of flashes P(I) on their intensity I(r = 256) at red fluorescence (ethidium bromide) and green fluorescence (Hoechst 33342) of chicken erythrocytes; (b) area under the final histograms of P (I) normalized to unit; red and green points correspond to red and green fluorescence of erythrocytes at total number of flashes N0 = 20363. and N0 = 33277; (c) central part for non-normalized distributions in (b); (d) Dependence of total Shannon entropy E(J,r) on range r for red and green fluorescence of chicken erythrocytes and human lymphocytes. Red points correspond to red fluorescence of chicken erythrocytes. Green fluorescence corresponds to green points for chicken erythrocytes and violet cross points for human lymphocytes.
 (a) (b) (c) (d)
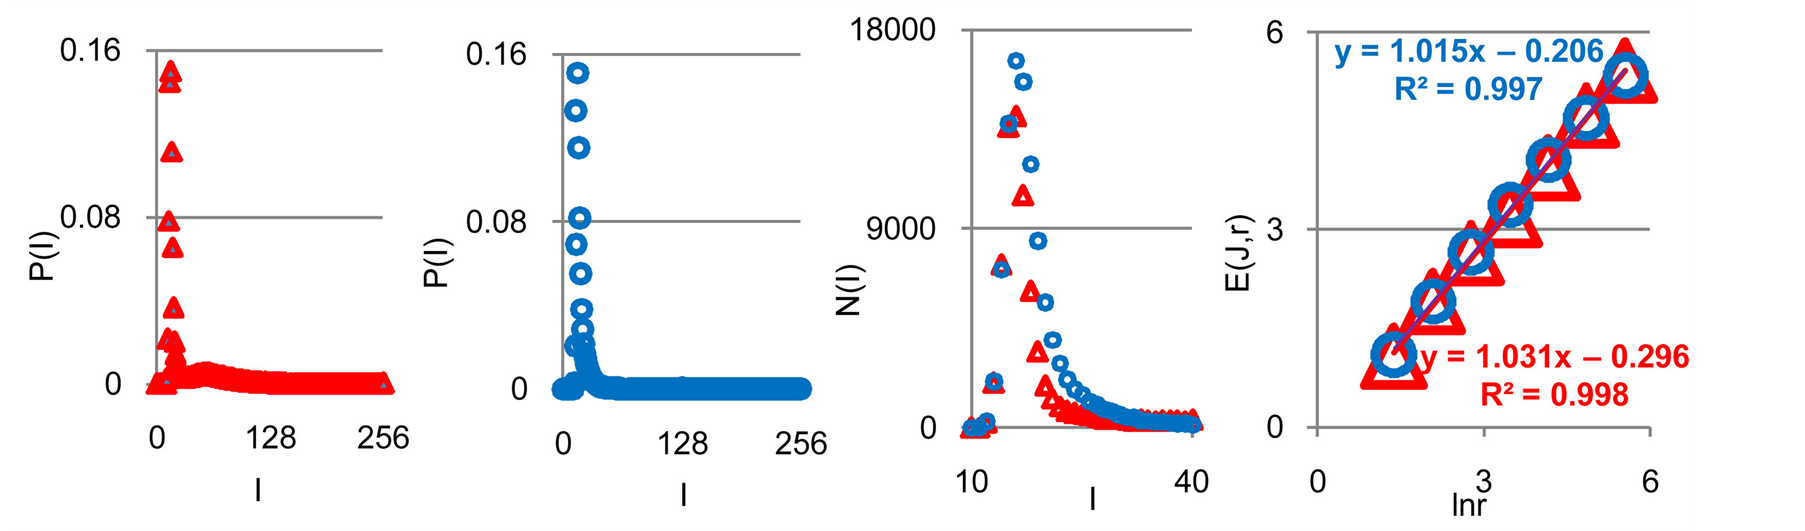
Figure 5. Normalized dependence for frequency of flashes P(I) on their intensity I(r = 256) at red fluorescence of DNA inside cells ((ethidium bromide); (a) fluorescence of neutrophils; (b) fluorescence of all leukocytes in the same blood sample; (a) and (b) area under the final histograms of P (I) normalized to unit; red and blue points correspond to neutrophils and leukocytes at total number of flashes N0 = 93 976 and N0 = 103 733; (c) Central parts in non-normalized distributions of fluorescence; (d) Dependence of total Shannon entropy E(J,r) on range r for red fluorescence of human neutrophils and all leukocytes in the blood of one and the same patient with complex of diseases, such as coronary heart disease, osteoarthritis, arthritis of all joints and multiple allergies.
leus of neutrophils. These correlations reflect various networks for distribution of ethidium bromide in chromosomes and coincide with networks of oxidative activity of fluorescing DNA. The same approach may be used for definition biodiversity of any fluorescing cells. Three illustrations of Shannon-Weaver biodiversity presented in Figure 8.
According to Figures 3, 4(d), 5(d), 7(b) invariant of Shannon entropy  in equation (7), based on information of DNA inside cells or biodiversity of information on DNA activity inside cells is
 . This invariant is always more than Shannon-Weaver biodiversity of cells
  in Figure 8, where dimensionless parameter C<1. Thus biodiversity of cells
  is less then biodiversity of information
  in cells
 (10)
(10)
 (a) (b)
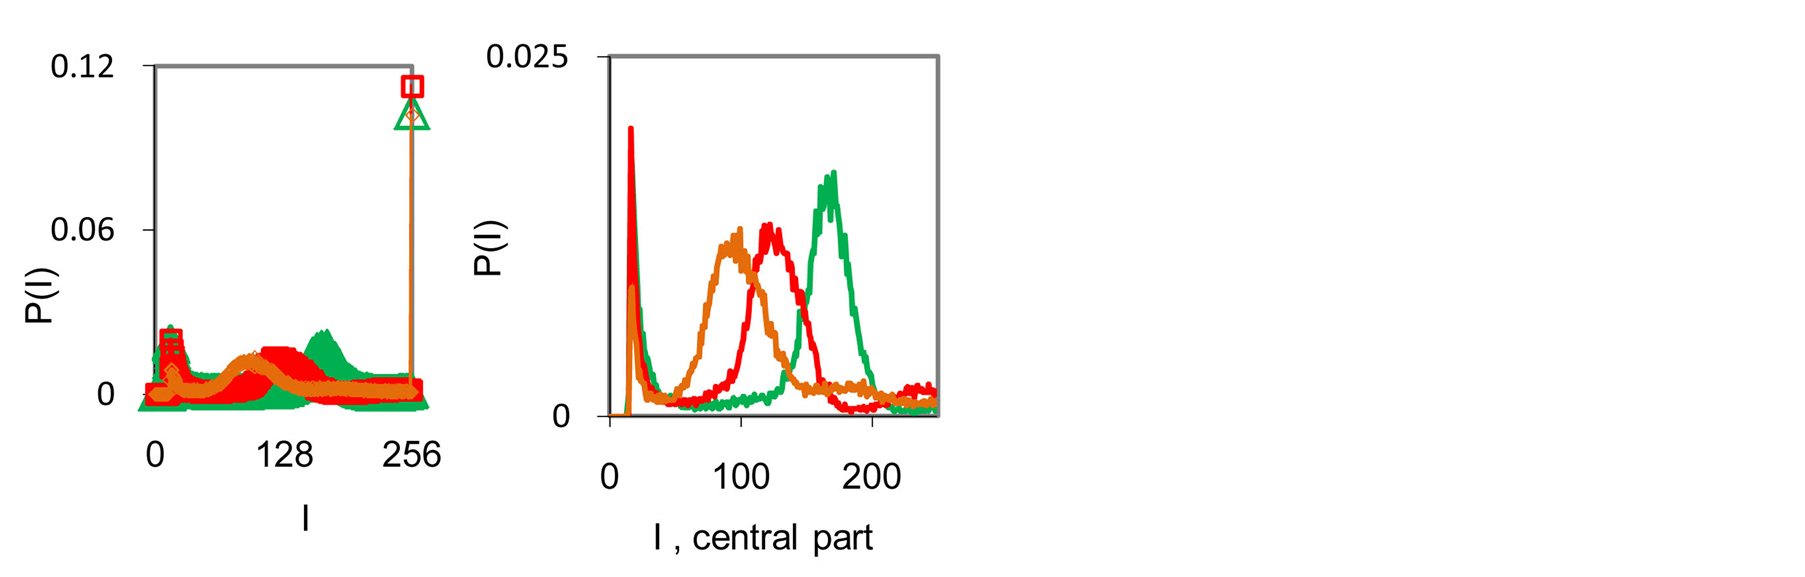
Figure 6. Dependence of normalized frequency distribution of flashes P (I) on their intensity I (a) and for clearest only central part of histogram (b) in the blood of one and the same invariably healthy, donor in different times. Triangle green points correspond to the total flashes number N0 = 30 832, analysis time is 19 July (first year); rhombus yellow points correspond to the total flashes number N0 = 38 758, analysis time is 11 July (next year); square red points correspond to the total flashes number N0 = 40 109, analysis time is 03 June, before 11 July, histogram range r = 256, as in Figure 1.
 (a) (b)
Figure 7. (a) Normalized distributions of information entropy E(J(I)) in the dependence on fluorescence intensity at rank r = 256; (b) Dependence of total Shannon information entropy E(J, r) = lnr on logarithm of range r; initial histograms at range r = 256; initial histogram shown in Figure 6.
The same inequality is observed for all distributions of fluorescence in Figures 1(a), 4(b), 5(c), 6(a). This inequality observed for all experiments on DNA fluorescence, for all cells, all dyes, all colors, etc. Thus, biodiversity of DNA in cells  is less than biodiversity of information
  for DNA activity inside cells. This empirical inequality gives a clear resource for evolution, adaptability to changing life conditions of cells, vitality of cells, development, possibilities of variations in DNA substrates and progress in biotechnology on the base of variations for one and the same DNA set inside cells.
The inequality (10) associated also with more high density packing of information entropy E(J, r) [17] than density packing of entropy E(P, r) [18] for oxidative activity of DNA in cells [18] . Here density of packing depends on fractal structure of given type of networks in cells. Fractal dimension D networks of entropy E(J(I), r) is higher fractal dimension networks of entropy E(P(I), r) [17] [18] . More high fractal dimension D and dominat-
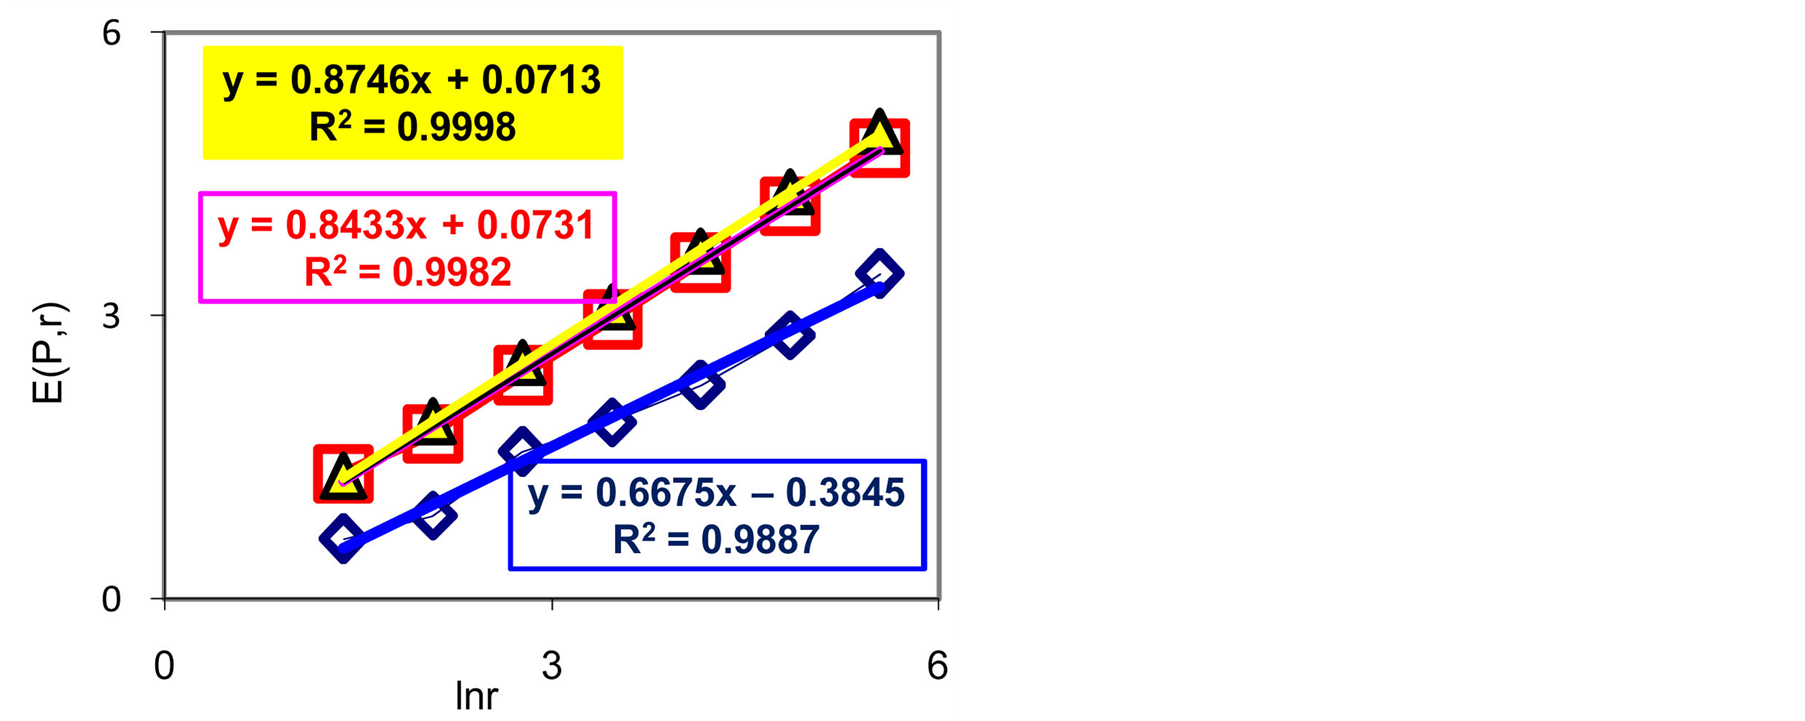
Figure 8. Dependences of Shannon-Weaver biodiversity E(P,r) of neutrophils on logarithm of range r; (a) three different donor with oncology, asthma and a good health; initial histograms see in Figure 1.
ing role of abnormal fractal dimensions D > 2 in networks of entropy  [17] define more less distance d~N1/D between N nodes, i.e. more densely fractal networks of information entropy E(J, r) in cells.
This inequality means that dense of packing of DNA activity inside cells is less than dense of parking for information on DNA activity, i.e. networks of DNA activity and networks for information of DNA activity have different topology, dynamical and structural properties in cells. Combined actions and interconnections of these networks produce regulation of informational homeostasis in any cell. Therefore, condition (10) defines informational adaptability and vitality of cells at informational homeostasis.
Invariance of total entropy  defines special role of distribution of Shannon entropy E(J(I)), as is for all functions, associated with the conservation laws, as the main dominant variable to describe the states and dynamics of informational activity of DNA in cells.
Informational invariant of  difficult to compare with the conservation laws of mass, energy, etc. Invariance of
  reflects the unchangeable measure or quantitative units of information entropy at certain scale r of correlations at DNA activity inside cells. Each range r corresponds to the certain constant values of entropy
  for all cells in varied aerobic organisms, i.e. defines the universality of entropy' scale (see sections 2, 3). We have no one and the same values of energy, mass, etc. for all beings, but we have overall, unified total information entropy E(J, r) for oxidative activity of DNA in all living cells at identical values of range r, i.e. at the identical scales r of clusters for Shannon entropy E(J, r).
Let us consider a question about physical nature of support of informational homeostasis inside cells. We have informational homeostasis and overall pattern , regardless of cell type, conditions of initiation and recording of fluorescence and individual features of DNA. This means existence of one, overall unified nature of physical processes to maintain informational homeostasis and very high efficiency of universal change all electronic excitations of DNA for quick stabilization of homeostasis in any cell, in any being. Currently known one overall universal type of very effective large-scale transformations for all collective electronic excitations of DNA, associated with resonance of Förster, i.e. with dipole resonance, which can provide effective support of homeostasis, regardless of the individual features of DNA. In this case the large-scale heterogeneities in fluorescence of DNA is connected with Förster’s radius (distance) or with corresponding length of correlations in clusters of fluorescing DNA. Here are possible various correlations for different sections and parts of one given DNA and different correlations inter various chromosomes inside cells at various localizations in space. Changing properties, configurations and conformations of DNA in cellular nucleus leads to a change of correlations inter chromosomes and to changes in localizations and intensity of Forster resonances without new hypotheses. This is a common property of all DNA, inside all cells, for any scale or range r. More universal results for quick excitation and collective switching of information transfer in chromosomes at DNA activity now is unknown. It is possible to propose that here exist dipole, quadruple, etc. resonances between various clusters in coil of chromosomes, but currently we don’t know anything concrete about these possibilities; solutions of these problems now are unknown. Various connections of chromosomes in cells are more complex and varied than in the textbooks. Any regulation of informational homeostasis must be very quick, effective and must have the general physical origins, as multiple resonances in large fractal multi-clusters, without dependence on type and origin of excitations, caused by any inner or external perturbation in cell life.
Need specially noted that any forced smoothing distributions of J(I, r)/or P(I, r) leads to the destroy of informational homeostasis of total Shannon entropy E(J, r), i.e. ensures the destruction of correlations in real life of DNA inside cells and leads to the uncontrolled distortions of chromosomes activity in the nuclei of cells. Forced smoothing DNA activity inside cells belongs to the games without rules and meaningful, sensible goals.
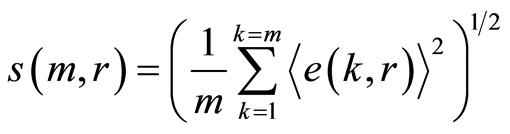
5. Noise of Entropy in Cells at Regulation of Homeostasis for Medical Diagnostics; Trends for Central Moments and Averages of Hölder
We haven’t ideal, absolute, correct homeostasis; absolute constant values of information entropy in real life, in real time exist nowhere and never. We always have various fluctuations during regulation of homeostasis for support of it stability. These fluctuations are very individual and concern reach information on human health at specific regulation the dynamic equilibrium in homeostasis for given human. An example of regulation for arbitrary conditions of homeostasis is described in [16] . We have more complicated and diverse regulation in multi-scale complex networks of information entropy for DNA activity. Let us consider main statistical peculiarities and properties of various deviations, fluctuations or noise of entropy  near homeostasis
 (11)
(11)
for definition various mean characteristics of individual distortions of Shannon entropy in given sample of blood, where frequency distributions of information entropy  are defined in equation (6).
Central moments  for fluctuations of entropy
  near homeostasis are defined as the statistical averages
 , (12)
where  determines the order of moment
 . Here symbol
  denotes statistical average for fluctuations of entropy
 . Common unified types of behavior of
  at increasing number
 is observed at any values of r =const for all states of health, for any human, as it is shown in Figure 9.
Two branches with even and odd numbers m of central moments  have unique universality with zero and clear exponential decreasing of
 , as in Figure 9.
The exponential decreasing of  provides the informational stability of DNA activity, but not reflects detailed information on fluctuations of entropy
  for chromosomes of given individuality. Decreasing rate of
  have an exponential trends to growth at increasing numbers m. Various distributions of
  have a similar qualitative behavior at various quantitative dependences on different states of health for different persons in Figures 9.
The power means or averages of Hölder for deviations or fluctuations of entropy  near homeostasis are
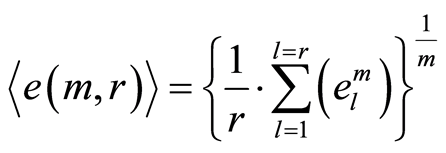 , (13)
Here symbol  denotes statistical average for fluctuations of entropy
 , which defined by frequency distribution of information entropy
  in equation (6). Mean values of
  illustrated in Figure 10.
We observe very strong switching for branches at the largest scale r = 4 in Hölder’s averages in Figure 10(a) for asthma with respect the same branches for a good health and oncology in Figures 10(b) and 10(c). The same switching observed for distribution of central moments M(m, r) in Figure 9 at r = 4. Distributions various averages of Hölder for other values of r > 32 in Figures 10(b), 10(c) are rather close to each other, that means the similar noise levels of information entropy near homeostasis at oncology and in a good health for these values of rank r. In the latter case we observe very notable differences for fractal structures of networks of information entropy and difference in their stability (see Figures 4(b), 5(b) and Figures 6(b), 6(d) in [13] ). Therefore, we cannot assume that similarity for Hölder’s averages linked with the coinciding characteristics of collective correlations inside and between chromosomes in networks of a certain scale for different states of health.
 (a) (b) (c)
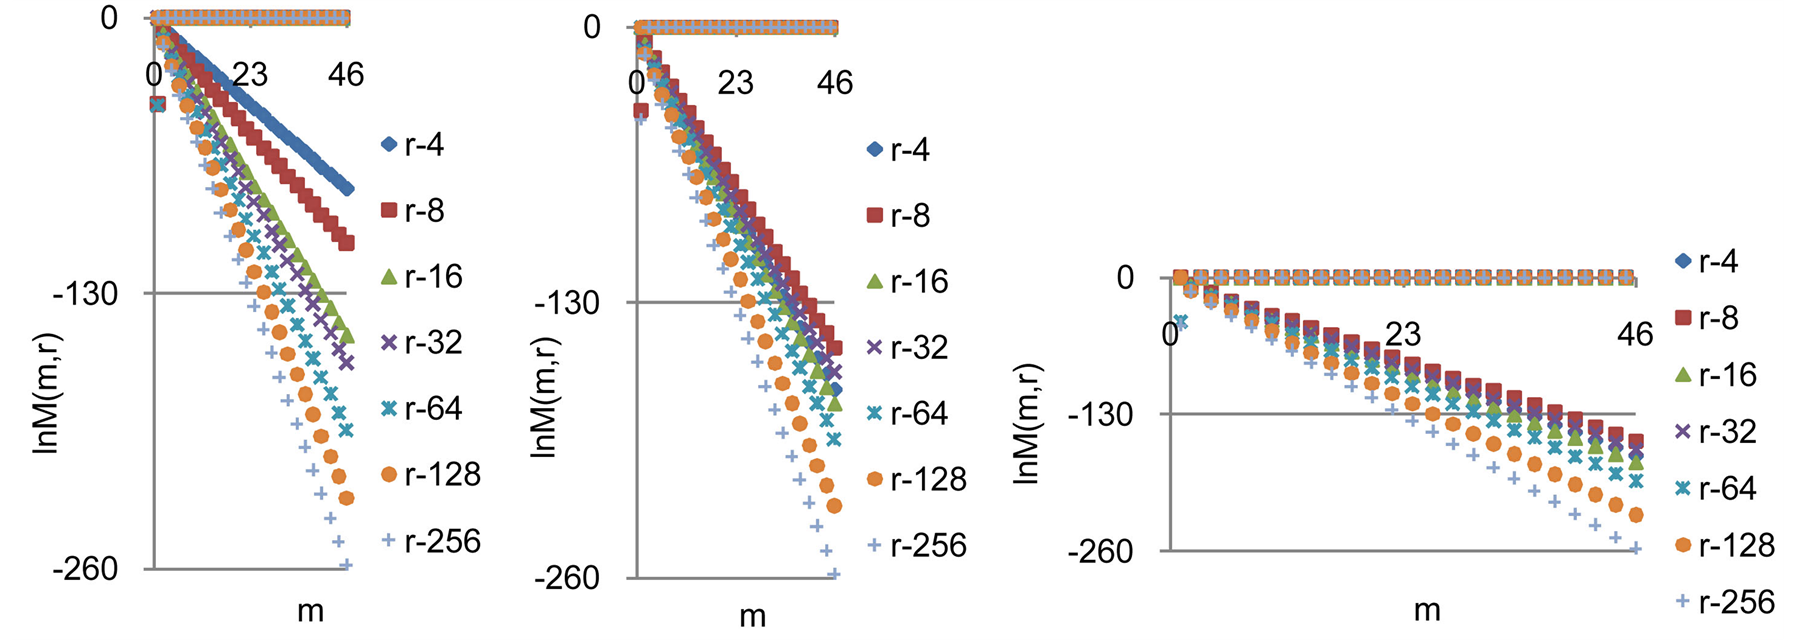
Figure 9. Logarithmic distributions of central statistical moments  for fluctuations of entropy e(r) near homeostasis for (a) bronchial asthma (b) a good health (c) oncology; initial histograms presented in Figure 1; lower and upper branches correspond to the even m = 2, 4, 6... and odd m = 1, 3, 5…
 (a) (b) (c)
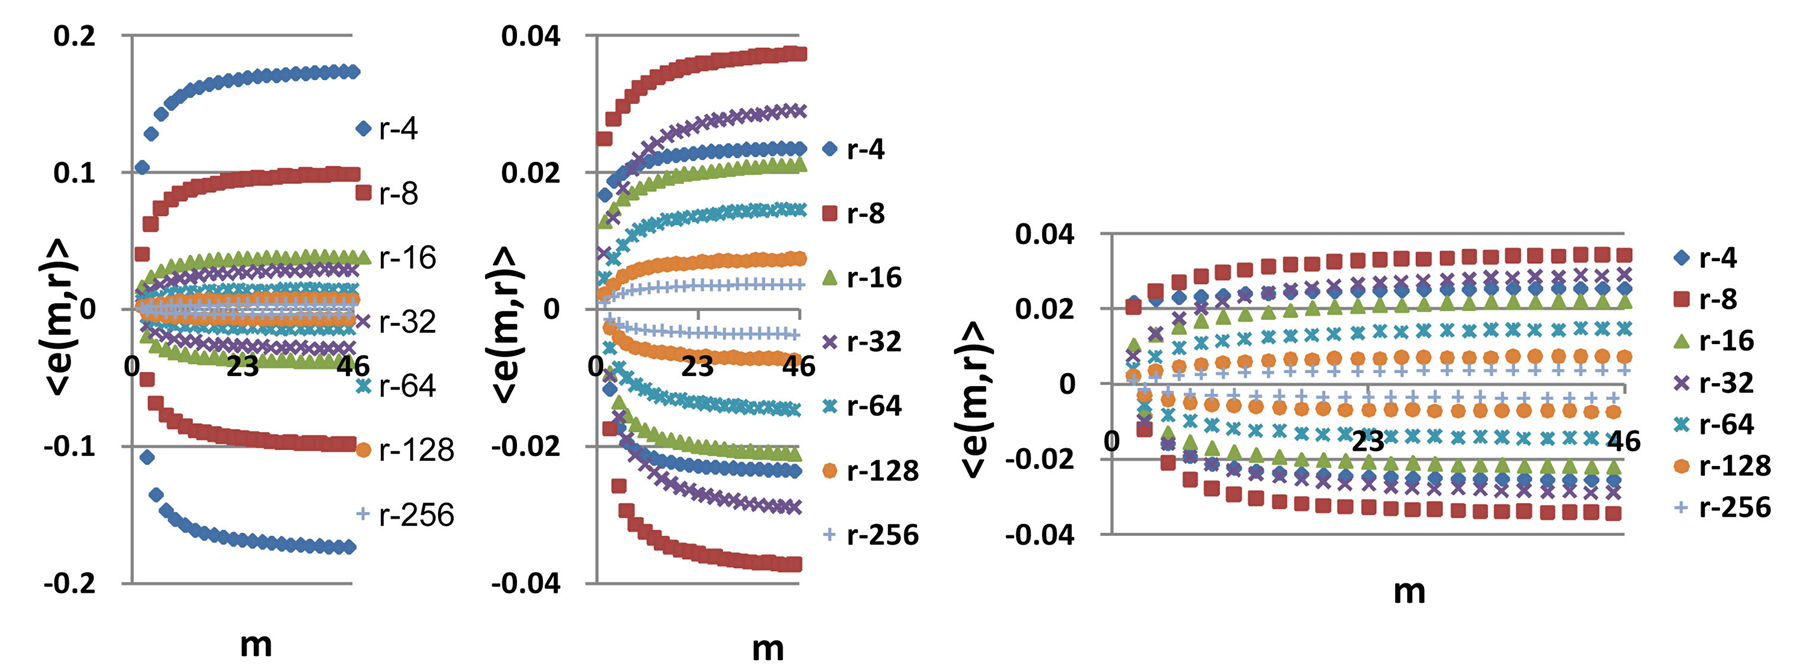
Figure 10. Distributions of Hölder’s averages  with different number m for fluctuations of entropy e(r) near homeostasis for (a) bronchial asthma (b) good health (c) oncology; initial histograms presented in Figure 1; lower and upper branches corresponds to the even m = 2,4,6... and odd m = 1,3,5…
Mean level of experimental errors in original cytometric histograms for r = 256 is about 2% [6] -[8] . We observe much more noticeable and very clear difference between initial and transformed experimental distributions in Figures 1, 2 for different states of health and rather essential difference for averages of Hölder  for deviations of entropy in Figure 10. The largest values of
  corresponds to inflammation at bronchial asthma. In our case maximal value of
  corresponds to
Magnitudes of deviations all distributions of  from zero level increase with increasing number m. All distributions
  in Figure 10 have an oscillatory behavior at increasing of
 . Two branches with even and odd numbers m correspond to the negative and positive values of
 . These oscillations with period 1 not specified in Figure 10; the mandatory behavior, corresponding to self-regulation of noises for homeostasis support, doesn’t needing in comments.
A very slow growth of Hölder’s averages  in Figure 10, at increasing number m, clearly defines individual level for fluctuations and autocorrelations of entropy
  near homeostasis for given person, unlike of unified and exponentially quick degradation of central moments
  in Figure 9.
Averages of Hölder  define various orders of correlations and autocorrelations, with various numbers m, for fluctuations of entropy near the “centre of gravity” in stability regulation the dynamic equilibrium in networks with scale r of fluorescing DNA. According to Figure 10 all deviations of entropy from zero level, for various individual distributions of
  and any scale r, increase with increasing number m, with various saturations of chromosomal correlations of entropy at different states of health, until m = 46. This number m = 46 defines the full number of chromosomes inside cells. According to a well known inequality
 for Holder’s averages here maximal level of entropy noise defined by the values of
 . Therefore, values of
  are the largest among all Holder’s averages. This means, also, that all 46 chromosomes involved in support of self-regulation of informational homeostasis inside cells, as one united full set of chromosomes.
Average noise level of information entropy in DNA activity for one chromosome among m chromosomes at given range  is defined by the value of standard deviation
 (14)
(14)
for  at any m. Magnitudes of
  depend on health status, number m and range r. Values of standard deviations for Holder’s averages of entropy noise for one chromosome
  in the full set of m=46 chromosomes in a cell are very important characteristics for information transfer of DNA activity inside cells. These levels of
  defined by all values of
  for all averages of Hölder
 , but not only the lower numbers of
 ; we have entropy variations for different 46 chromosomes inside cells and many types of various chromosomal cross-correlations.
Distributions of  in Figure 10 depend on health status for given person at given time. We observe very strong switching of branches for r = 4 in the averages of Hölder in Figure 10 for asthma with respect the same branches for a good health and oncology. The same switching observed for distribution of central moments
  in Figure 9. In order to compare different health statuses let us consider standard deviation of
 , i.e. average fluctuation level for one chromosomes, for a good and bad health in Figure 11.
For more contrast here considered also changeability of health of one and the same healthy donor in real time, during one year, for initial histograms in Figure 6. In the last case we used distributions of  presented in Figure 12.
One may to compare histograms in Figures 1, 6, 10 and 12.
In Figure 11 are observed rather strong variations of standard deviations of entropy fluctuations for Holder’s averages for one chromosome  at rank r = 4, 8, 16 for various states of health of different people. We observe also difference in entropy fluctuations for one and the same healthy person in real time in Figures 11 and 12 for symbols rhombus, triangle and quadrate at r = 4,8. In the last case, for this healthy man, various
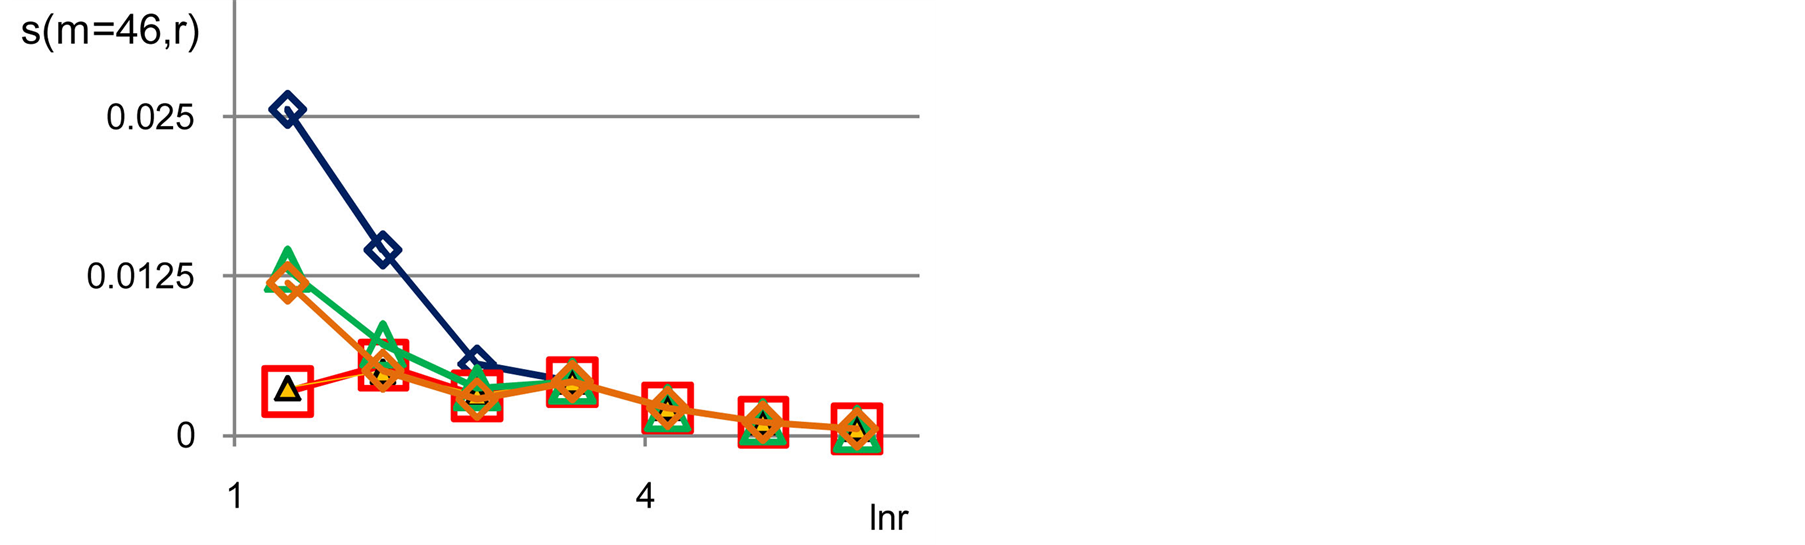
Figure 11. Distributions of standard deviations s(m = 46, r) of Hölder’s averages of entropy noise for one chromosome in the dependence on lnr for fluctuations of entropy e(I, r) near homeostasis in the blood of different people at bronchial asthma, good health, oncology; initial histograms presented in Figure 1. Triangle green points, rhombus yellow points, square red points correspond to data in Figures 1 and 6 in the blood of one and the same invariably healthy, donor in different times.
 (a) (b)
Figure 12. Distributions of Hölder’s averages
networks of information entropy and their stability remain virtually unchanged [17] in real time. Networks of DNA activity in this case for given healthy man are varied and modified [18] . This means that maintaining a good immunity is associated with different levels of entropy fluctuations, i.e. with different levels of regulation of oxidizing activity and oxidative metabolism of DNA in cells, of given healthy person in different periods of life. The same situations for changeability of  at low rank r < 32 are typical for any states of health, as shown in Figure 11. Thus, the quality changes and the restructuring of health conditions associated with quality changes for large-scale rearrangements in the structure of the large-scale correlations for information entropy of chromosomal DNA in cells at rank r < 32, for r = 4, 8, 16.
For rather large rank r > 32, difference between  for any health conditions and any persons is small and does not exceed 0.5%. In this case, at rank r > 32, we observe a very significant qualitative difference in networks of DNA activity [18] , in networks of information entropy of DNA [17] and in their stability at different states of health [17]
Thus according to Figures 11 the qualitative changes and restructuring of health conditions connected with the qualitative transformations in the structure of the large-scale correlations of information entropy  of chromosomal DNA in cells, for largest scales of networks and correlations with rank r = 4, 8, 16. Therefore, noise of total Shannon entropy
  has a very small level for more small-scale fluctuations with rank r > 32. This means also a very conservative structure and high stability for small-scale clusters of chromosomal entropy in cells at rank r > 32. These fractal clusters of information entropy have a very high, unique high, density of packing, associated with abnormal fractals [17] . Networks of DNA activity are not so strong conservative. [18] . Corresponding complex fractal networks for oxidizing activity of DNA inside cells in these cases have rather strong transformations and restructuring in the large and in the small scales, i.e. for small and large rank r [18] . Thus, we have difference between networks of DNA activity and networks of information for DNA activity. As a result we have strong difference between structure and density of biochemical and informational networks of DNA in cells and some information resources are corresponding to inequality (10).
Switching between networks of entropy, corresponding to different states of health and inverse transitions, for small fluctuations of entropy near homeostasis are ensured by the processes of unknown nature. According to Figure 10 switching from one group of Hölder’s averages to other group of averages without coincidences in the local networks for fluctuations of entropy with given range r [17] may to occur for all health statuses. Hidden switches in Figures 10(a), (b), (c) between branches for fluctuations of information entropy e(m,r) with scales r = 4 at asthma, oncology and at a good health linked with changing stability due to transcritical bifurcation in distributions of information entropy for different states of health [7] [13] [17] .
Different values of r characterize different scale of clusters for oxidative activity of DNA inside cells. Coincidence of Hölder’s averages  for one and the same values of m, r and coincides corresponding values of
 , as it is observed in Figure 11 for r > 32, at different states of health here means that regulation of homeostasis is provided by clusters with the same r and with the same effective fluctuation of total Shannon information entropy for regulation of homeostasis. These clusters correspond to different local distributions of Shannon entropy. Topological properties of these clusters, such as fractal dimensions [10] , have very serious differences for different states of health [10] [13] [17] [18] . In this case, homeostasis is achieved by various types of fractal correlations at oxidizing activity of DNA inside cells. Some examples of these fractals for information entropy
  are presented in [13] [17] .
6. Conclusion; Homeostasis in Living Cells for Human Life and for Biotechnologies
6.1. Physics of Information Transfer in Cells
This article is associated with the answers to the four questions on physics for information activity of DNA in cells in the presence complete set of chromosomes and all other components and inner elements of living cells.
1) How to determine and to measure information on oxidative activity of DNA inside cells?
2) What statistical characteristics define various structures of large-scale correlations of information activity of DNA inside cells?
3) What general laws and parameters provide and are define stability and reproduction of information in networks of DNA in cells, adaptability of cells and vitality at variation of environment, heredities, traumas, illness, infection, etc?
4) How to determine information noise, structural trends, specific conditions and stability of information transfer inside living cells for different people in real time?
In this way we come to some very clear answers and conclusions about complexity and information patterns for oxidizing activity of DNA inside cells.
6.2. Biodiversity and Invariance of Entropy
A. We observe only one unified value of total Shannon entropy  of fluorescing DNA, like the empirical invariant, as the identical sum in each given distribution of information entropy
  in given sample of blood, for all cells and any donor. This invariant defines informational homeostasis of oxidative activity of 3D DNA for full set of chromosomes inside living cells, for any cell and any biodiversity of Shannon-Weaver in all populations of any cells. This invariant defines informational homeostasis in oxidative activity of 3D DNA in all clusters, of all scales r in hierarchy of networks for information activity of DNA inside cells. To each scale or each range r of networks of DNA entropy here exists its own homeostasis, as it's shown in Figures 3, 4(d), 5(d), 7(b). This invariant gives Shannon entropy
  as main, general characteristics for definition of information activity of 3D DNA in cells. This invariant gives the overall zero level for countdown of information activity of DNA in cells for any person and any health status.
B. Invariance of total information entropy  reflects the unchangeable measure or quantitative units of information entropy at certain scale r of correlations at DNA activity inside cells in varied aerobic organisms. Informational homeostasis of total Shannon entropy reflects number of fundamental and typical physical phenomena in real life of DNA for full set of chromosomes inside living cells, at different health status of different people.
Invariance of total information entropy  gives a wide spectrum of new opportunities in medical diagnostics, genomics, etc, like the common countdown level for correlations and information structures in activity of DNA inside all cells of blood [13] [17] .
C. Biodiversity of DNA activity in cells , i.e. Shannon-Weaver biodiversity of cells, in equation (9) is less than biodiversity of information
  of DNA activity inside cells in equation (7). The empirical inequality (10),
  , gives a clear resource for evolution, adaptability to changing life conditions of cells, vitality of cells, development, possibilities of variations in DNA substrates and progress in biotechnology on the base of variations for one and the same DNA set inside cells.
6.3. Noises at Informational Homeostasis
D. Fluctuations in DNA activity as and self-regulation of informational homeostasis are associated with cell life in the body as in the open system, for stability support of vitality conditions at varied perturbations of different origin. Real traffic in information activity DNA never can be smooth [18]. We defined noise level of information entropy  in cells in equation (11), coincidences and switching for patterns of branching sequences of Hölder’s averages
  and for central moments M(e, m) at self-regulation dynamic equilibrium in homeostasis of entropy and in information transfer for different states of health various people in Figures 9-12. We observe various saturations in averages of Hölder
  for levels chromosomal correlations of entropy at different states of health in Figures 10, 12 at increasing of number m. Saturation exists if number m for average of Hölder
  equals to m = 46, when all 46 chromosomes involved in homeostasis regulation. We need all 46 chromosomes inside our cells for support informational homeostasis in the stable information activity of DNA inside any living cell. These levels of saturations are very important characteristics of inner and inter chromosomal correlations, which characterize background noise and information transfer of DNA activity inside cells in support regulation of homeostasis for given person in given time. Various levels of fluctuations entropy
  depend on the scale of networks (rank r) and are changeable in time even for one and the same healthy person in different periods of life, as it is shown in Figures 10, 11 and 12. Different levels saturation of entropy’s fluctuations give a base for comparisons and detections varied abnormalities noise informational entropy DNA inside cells in various samples blood for medical diagnostics. For instance, noise level of information entropy near homeostasis may be small ~1% and rather high ~10%, and to reach ~20% for strong inflammations, as it is observed for bronchial asthma in Figure 10(a). The main structural reconstructions of chromosomal correlations occur in the most large-scale networks of entropy, at r < 32, as it is observed in Figures 10, 11 and 12. This reflects, at least, changing topology of chromosomes in nuclei of cells and fractals in networks information entropy [17] .
E. We introduce the average standard deviation  of Hölder’s averages
  in equation (14) for the clear definition of average fluctuation level of total information entropy of one chromosome inside cell. According to data in Figures 11 the qualitative changes and restructuring of health conditions connected with the qualitative transformations in the structure of the large-scale correlations of information entropy E(J, r) of chromosomal DNA in cells, for largest scales of networks and correlations with rank r < 32; at rank r = 4, 8, 16. Therefore, noises of total Shannon entropy
  for one chromosomal DNA inside cell at homeostasis regulation, i.e. standard deviations of
 , have a very small level, less than 1%, for more small-scale fluctuations, in networks of Shannon entropy with rank r > 32.
6.4. Natural and Artificial Life of DNA
F. Existence of only one secluded DNA, as the existence of a hermit in a cave, must be linked with the certain homeostatic conditions. Here exists some interest with respect of availability, changeability or the lack of informational homeostasis of secluded DNA in corresponding environment at different conditions (if we don’t like lonely DNA, living, for instance, in the descriptions of textbooks, in vacuum, far from normal of vital conditions, without metabolism and homeostasis, in epigenetic, in bioinformatics, etc.).
In this case, as one of the result, we come to the artificial life. Various artificial cells and corresponding biotechnologies can have the same and (or) not exactly same informational homeostasis as in a real life, in open systems for all aerobic beings. What to say about sciences, technologies, foods and medical treatments of human body, at using various artificial cells, at absence or change of their informational homeostasis with respect of cells of human and all living beings? This is very bad and dangerous. Nobody likes to live as a substrate, for ensuring variations and mutations in an artificial life of the alien cells. This is another life. Here need to check and control level of total Shannon entropy E(J, r) for any artificial cells in order to ensure informational homeostasis of E(J, r) = lnr for all cells in a human body.
G. Large-scale correlations of information for chromosomal structures in cells not strong depend on specification of different cells. Blood cells live in any parts of body and, therefore, reflect local equilibrium, i.e. identical local noise of entropy near homeostasis, with given part of body and at any travels inside different parts of body; self-consistence of informational communication and information transfer connected with life conditions and biorhythms for any given organism in real time. Therefore, informational homeostasis must have overall level and overall background noise for all living cells in given body for interconnections, reproductions and clear, good, stable reproduction functions of cells. It is very important to check our results for informational homeostasis in the cells of blood as assumptions for all other cells, such as neural cell and brain cell, for cardiac and muscle cells, etc. If our assumptions on invariance of informational entropy are correct and universal for all living cells, then we have a very clear overall association between immune, nervous, the cardiac and other systems on the level of different cells. These associations in information transfer and noise of DNA inside cells and inter cells, during regulation of informational homeostasis, must exist without strong dependence from geography and specification of cells in the human body. In this case various cells produce exchange of information (noises) on DNA activity in chromosomes for maintains a good stability of life or informational homeostasis at local perturbation and change conditions of environment for any given group of cells in the body. Here a regulation of entropy noise near homeostasis interconnected with varied changes of fractal topology, in the types and magnitudes of correlations and structures of multi-scale complex networks for DNA activity [18] and information entropy for DNA activity [17] for complete set of chromosomes inside cells in real time. General extrapolations of our results for blood cells to all other cells of the aerobic beings based on the general logic and natural physiology in a daily life, as the clear results of the pure statistical analysis of DNA activity in very large populations the cells of blood, as the main information agents in the body. These results are based on experimental data in flow cytometry measurements in blood cells of different people and chickens, at different conditions of life, health, heredity, environment and various experimental data, for various conditions of DNA fluorescence.
H. A very strong magic of doctrines, spells and emotional, deeply enigmatic words, about ‘signals of cells’ from biological textbooks here, in this article, have rather clear quantitative definition as noise of Shannon entropy near overall homeostatic level of total entropy E(J, r) = lnr, during regulation of informational homeostasis for oxidative activity of DNA in cells, in equations (5), (6), (7), (11) and in experimental illustrations in Figures 1-12 for various cells living inside different people in real time…..To be continued.
Acknowledgments
Thanks to M. Filatov for kindly providing the experimental data.
References
- W. Li (1991) The Study of Correlation Structures of DNA Sequences: A Critical Review. Computers & Chemistry, 21, 257-271. http://dx.doi.org/10.1016/S0097-8485(97)00022-3
- Bernaola-Galvan, P., Carpena, P., Roman-Roldan, R. and Oliverc. J.L. (2002) Study of Statistical Correlations in DNA Sequences. Gene, 300, 105-115. http://dx.doi.org/10.1016/S0378-1119(02)01037-5
- Locey, K.J. and White, E.P. (2001) Simple Structural Differences between Coding and Noncoding DNA. PloS ONE, 6, e14651.
- Sellis, D. and Almirantis, Y. (2009) Power-Laws in the Genomic Distribution of Coding Segments in Several Organisms: An Evolutionary Trace of Segmental Duplications, Possible Paleopolyploidy and Gene Loss. Gene, 447, 18-28. http://dx.doi.org/10.1016/j.gene.2009.04.028
- Filatov, M.V., Varfolomeeva, E.Y. and Ivanov, E.A. (1995) Flow Cytofluorometric Detection of Inflammatory Processes by Measuring Respiratory Burst Reaction of Peripheral Blood Neutrophils. Biochemistry and Molecular Medicine, 55, 116-121. http://dx.doi.org/10.1006/bmme.1995.1041
- Galich, N.E. and Filatov, M.V. (2007) Laser Fluorescence Fluctuation Excesses in Molecular Immunology Experiments. Proceedings of SPIE, 6597, 6597OL.
- Galich, N.E. (2010) Bifurcations of Averaged Immunofluorescence Distributions due to Oxidative Activity of DNA in Medical Diagnostics. Biophysical Reviews and Letters, 5, 227-240. http://dx.doi.org/10.1142/S1793048010001196
- Galich, N.E. (2009) Cytometric Distributions and Wavelet Spectra of Immunofluorescence Noise in Medical Diagnostics. In: Dossel, O. and Schlegel, W., Eds., WC 2009, IFMBE Proceedings, Springer, Berlin, Heidelberg, 1936-1939.
- Galich, N.E. (2010) Shannon-Weaver Biodiversity of Neutrophils in Fractal Networks of Immunofluorescence for Medical Diagnostics. World Academy of Science, Engineering & Technology, 70, 504-515.
- Galich, N.E. (2011) Complex Networks, Fractals and Topology Trends for Oxidative Activity of DNA in Cells for Populations of Fluorescing Neutrophils in Medical Diagnostics. Physics Procedia, 22, 177-185. http://dx.doi.org/10.1016/j.phpro.2011.11.028
- Misteli, T. (2011) Inner Life of Genome. Scientific American, 304, 66-73. http://dx.doi.org/10.1038/scientificamerican0211-66
- Lanctôt, C., Cheutin, T., Cremer, M., Cavalli, G., and Cremer, T. (2007) Dynamic Genome Architecture in the Nuclear Space: Regulation of Gene Expression in Three Dimensions. Nature Reviews Genetics, 8, 104-115. http://dx.doi.org/10.1038/nrg2041
- Galich, N.E. (2012) Informational Homeostasis for Shannon Entropy in Complex Networks of Oxidative Activity of DNA in Cells; Fractals, Stability and the Switching in Large-Scale Gene Nets for Fluorescing Neutrophils in Medical Diagnostics. IFMBE Proceedings, World Congress on Medical Physics and Biomedical Engineering, 39, 542-545.
- Galich, N.E. (2010) Structural Changes in Cytofluorescence Information Entropies with Histogram’s Ranges Reduction for Medical Diagnostics. Analysis of Biomedical Signals and Images, 20, 189-196.
- Hanggi, P., Talkner, P. and Borcovec, M. (1990) Reaction-Rate Theory: Fifty Years after Kramers. Reviews of Modern Physics, 62, 252-342
- Hegyi, G., Vincze, G. and Szasz, A. (2012) On the Dynamic Equilibrium in Homeostasis. Open Journal of Biophysics, 2, 64-71. http://dx.doi.org/10.4236/ojbiphy.2012.23009
- Galich, N.E. (2013) Dense Fractal Networks, Trends, Noises and Switches in Homeostasis Regulation of Shannon Entropy for Chromosomes’ Activity in Living Cells for Medical Diagnostics. Applied Mathematics, Special Issue on Chaos and Fractal, 4, 30-41. http://dx.doi.org/10.4236/am.2013.411A2006
- Galich, N.E. (2013) Fractal Networks of Real Worlds of Fluorescing DNA in Complete Set of Chromosomes inside Blood Cells for Medical Diagnostics. Open Journal of Biophysics, 3, 232-244. http://dx.doi.org/10.4236/ojbiphy.2013.34029