American Journal of Operations Research
Vol. 3 No. 3 (2013) , Article ID: 31671 , 8 pages DOI:10.4236/ajor.2013.33031
Three Dimensional Integrated Value Models Based on ISO/IEC9126 System Quality Model
Faculty of Science and Engineering, HOSEI University, Tokyo, Japan
Email: Kees959@hotmail.com
Copyright © 2013 Kazuhiro Esaki. This is an open access article distributed under the Creative Commons Attribution License, which permits unrestricted use, distribution, and reproduction in any medium, provided the original work is properly cited.
Received March 7, 2013; revised April 9, 2013; accepted April 23, 2013
Keywords: System; Software; Quality Requirement; Quality Evaluation; Quality Model; Quality Characteristic; Quality Attribute; Quality Measure; Requirement Process; Evaluation Process; Customer Satisfaction; Customer Needs
ABSTRACT
When introduce a distribution system, it is necessary performing an assessment of system quality generally to evaluate the characteristic of system from candidates targeted product for the purchase and evaluating the superiority and inferiority. The general quality assessment for the system is performed by the integration test based on the quality requirements of the customer till now. But, it is very difficult to perform the integration test completely, because the system testing may depend on the individual person’s high skill and experiences. Recently, the method of the quantitative quality requirements and evaluation based on the ISO/IEC9126 quality model is widely recognized for the purpose of a quality evaluation and improvement of the system product. In the precedent study, I have performed the confirmation of the method of evaluation for the system quality from the viewpoint of six quality characteristics included in the quality model defined in ISO/IEC9126, and the effectiveness of whose quality model could have confirmed quantitatively and statistically. However, it is very difficult to assess superiority and inferiority of the system totally even if evaluating the quality of the distribution system from the viewpoint of six quality characteristics for a customer individually. Therefore, if we could display total quality of the target system visually, we could evaluate and compare the total quality of system objectively and intuitively. Based on these assumptions, in this paper, we propose the concept and effectiveness of the “Three Dimensional Integrated Value Model” based on the result of precedent study about six quality characteristics.
1. Introduction
In order to implement or acquire information system successfully, it is very important to specify the quality requirement for the most suitable system product corresponding to real customer needs during the possible early stage of development and achieve the high quality of system product. When introducing a distribution system, it is necessary assessing system quality generally to evaluate the characteristic of a system from some candidates for the purchase. If we take the wrong approach for quality requirements in accordance with the real needs of the customer, it may cause a big loss for a purpose of investment.
However, the quality requirement analysis is a very difficult matter, because it is non-formulaic and demands much of which the product customer’s technical perceptiveness, sense of balance and experiences.
Traditionally, analysis of quality requirements of a product has been conducted through questionnaires or interviews with customers. But, if the result of requirements analysis is not complete, that may cause the problems such as miss-estimation of purpose, and/or missdecision of requirements about importance, and/or a failure in completeness in the established target system product. As a result, customer may not obtain the effective equivalent of investments worth which they truly expect. Generally, survey items on the questionnaires are selected either from previous questionnaires of similar system or may be defined based on investigator’s personal experience with preference of product requirements.
This kind of lack of structure and incompleteness of the traditional approach may cause the miss decision of the quality requirements analysis during stage of design in the development. As a result, Traditional approach may not be assuring the completeness of the quality requirement definition of a product.
In recent years, we have been working on developing the ISO/IEC25000 (SQuaRE) series [1-4] of standards for quality requirements and evaluation for system and software product for a long time in ISO/IEC JTC1 (Joint Technical Committee 1 of the International Organization for Standardization and the International Electro technical Commission) SC7 WG 6 (software and systems engineering under ISO technical committee, working group six). As part of this project, we have also worked on the developments of ISO/IEC9126 series, which is the standards to provide technology for supporting above mentioned works and also have defined the six quality characteristics.
For the purpose of specifying the quality requirement and evaluation of system and software product, currently, the method of quantitative quality requirement definitions based on ISO/IEC9126-1 [5] quality model that includes six quality characteristics is widely recognized, and have using in worldwide.ISO/IEC9126-1 (This standard has replaced to ISO/IEC25010:2011 [6]) defines the six quality characteristics of the system and software. These six quality characteristics are described based on the model of Boehm [7] or McCall [8], or from the view point of a stakeholder’s wide experience, which are considered by necessity and dependent on the user’s point of view. This model introduced in ISO/IEC9126-1 may be formulated with almost perfect quality requirement establishment and evaluation perspective of the target system, which covers both structure and completeness based on the hypothesis of a system, even with specific quality target, being “a kind of system”.
Through analysing customer requirements based on these six quality characteristics, it may be able to perform the almost complete and objective evaluation for quality requirements and evaluation of system/software product. Therefore, certain level of improvement could be expected for specifying the product quality objectives completely by using the ISO/IEC9126-1 quality model.
However, independency among each quality characteristic has not been verified, and the suitability of method by using these six quality characteristics for quality requirement and evaluation has not been certified statistically.
In recent years, consumers are able to purchase products based on an increasing number of consumers reviews posted on the Internet web site.
For example, negative review of an online may relate to a serious concern that affects the utility of the laptop computer, or it may relate to a relatively minor concern that does not affect the utility of the system based on the impression of persons. In other words, different negative reviews of online may be carried out to different levels of importance (i.e., different degrees of customer quality requirement).The degree of customer dissatisfaction may not be accurately obtained by simply classifying negative reviews of online into the six quality characteristics. This study has used the negative reviews of Laptop Personal Computers (LPC) posted by consumers.
Also, this study used the statistical analysis approach based on the precedent study of software product and process improvement [9,10].
Based on the above assumption, we have already inspected the validity and effectiveness of quantitative quality requirement definition from the view point of six quality characteristics in the precedent study.
However, it is very difficult to assess superiority and inferiority of the system totally even if evaluating the quality of the distribution system from the viewpoint of six quality characteristics for a customer individually.
If we could display total quality of the target system visually we could evaluate and compare the total quality of system objectively and intuitively. Therefore, in this paper, we propose the new quality model, which is further expanded from the six quality characteristics, and introduce the concept of new quality requirements definition method based on the “Three Dimensional Integrated Value Model”. Finally, we verify the validity of using the three quality characteristics, and propose the result of verification about effectiveness of quantitative quality requirement definition approach from the view point of Three Dimensional Integrated Value Model.
2. Concept of Quality Models
2.1. Concept of System and Software Quality Model
Figure 1 show the structure of the Software Quality Model defined in ISO/IEC9126-1. Recently, ISO/IEC9126- 1 have replaced by ISO/IEC25010:2011 System and Software Quality Model. But currently, ISO/ IEC9126-1 is widely recognized and have been using. Therefore, this study focuses on the ISO/IEC9126-1. From Figure 1, this model includes the six quality characteristics for system and software such as Functionality, Reliability, Usability, Efficiency, Portability and Maintainability.
The Functionality can provide to achieve the ultimate objective, such as increased productivity and sustainable development of a company, and Usability provide the ease of use of the system.
Reliability and Efficiency represents the capability possessed by the system, and is the characteristic associated with sustaining the quality objectives determined by the Functionality and Usability.
Maintainability and Portability provide the adaptability for the system to adapt to changes in the system environment and the usage environment.
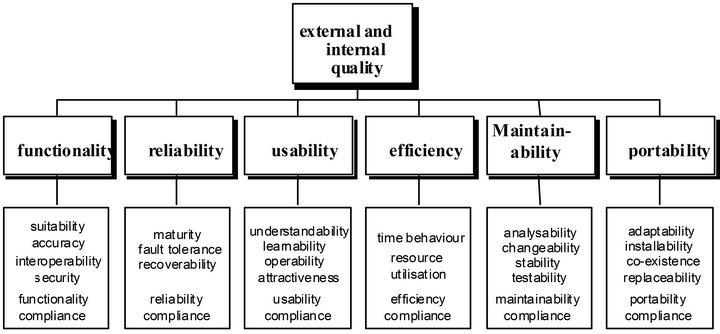
Figure 1. System and software product quality model-ISO/IEC9126-1:2001 [5].
2.2. Concept of Three Dimensional Integrated Value Model
Figure 2 shows the concept of the proposed “Three Dimensional Integrated Value Model (TDIVM)” for specifying and evaluating a quality of system product.
This new quality model have constructed based on the consideration of further expanding of the six quality characteristics defined in ISO/IEC9126-1.
In this model, the three characteristics such as “value”, “performance”, and “adaptability” have defined for a quality requirements and evaluation of a system.
- Value axis:
Supplied value for specific context of use:
Value = X (Functionality, Usability)
- Performance axis:
Capability of system to sustain a value of system:
Performance = Y (Reliability, Efficiency)
- Adaptability axis:
Capability of system to adapt to changes in the environment of system:
Adaptability = Z (Portability, Maintainability)
The characteristic associated with the “value axis” is the amount of value, which the system can provide the real value to achieve the ultimate objective, such as increased sustainable development of a company, and is also the substantial value, such as the ease of use or the functions.
The “performance axis” represents the capability of system, which should be realized within the system, and to maintain and sustain the value and objectives of system. The reason why the “value axis” and the “performance axis” are differentiated is that because the characteristic of the “performance axis” being excellent does not necessarily achieve to the characteristic of the “value
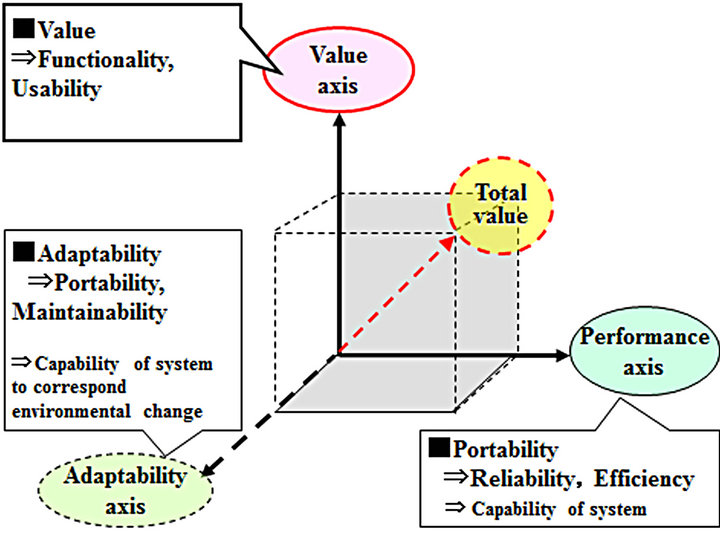
Figure 2. Concept of three dimensional integrated value model.
axis” being excellent. It is believed that the characteristic of the “performance axis” is the characteristic required for maintaining and sustaining the characteristic of the “value axis”, and does not necessarily correspond to the provision of a fundamental and unambiguous value.
The “adaptability axis” shows the capability of system correspond to the changes of environment about system usage, including temporal and spatial changes.
The system may not be provided the same amount of initial value continuously during total lifecycle of system, when it has developed. Therefore, the possibility of how well the system can adapt to these changes are represented by the “adaptability axis”.
From Figure 2, the total quality of system could be indicated by volume of the cuboids or the vector, by using the “Value axis”, “Performance axis” and “Adaptability axis”, which are defined in the “Three Dimensional Integrated Value Model (TDIVM)”.
3. Summaries
This study first collects customer complaints, i.e., expression of customer dissatisfaction, posted on a review website where customers who actually purchased personal computer related products post their reviews.
The study, then, classifies the posted customer complaints based on the six quality characteristics defined in the ISO/IEC9126-1.
The study obtains from questionnaires a weight for each quality characteristic to represent the importance of quality characteristic for the customer needs, and applies the weight to the six quality characteristics, and quantifies the degree of customer satisfaction for each quality characteristic.
Also, the study performs correlation analysis of the degree of customer satisfaction over the six quality characteristics for each system products and verifies the mutual independency of each, and has confirmed the effectiveness of the approach by using six quality characteristics for understanding the customer satisfaction.
In addition, the study has developed the model that actually predicts the degree of customer satisfaction of a particular quality characteristic from the remaining five quality characteristics and the study performs multipleregression analyses. The study discusses the validity of six quality characteristics based on the significance of the developed prediction model.
The study, also, performs correlation analysis of the degree of customer satisfaction over the three characteristics for each system product and verifies the mutual independency of each and has confirmed effectiveness of approach of using three quality characteristics for understanding the customer satisfaction.
Furthermore, by performing a multiple regression analysis to the three characteristics, assigning the degree of customer satisfaction corresponding to one specified characteristic from among the three characteristics to an objective variable, and assigning the degrees of customer satisfaction corresponding to the other two quality characteristics to explanatory variables. The possibility of whether or not the degree of customer satisfaction corresponding to the one specified quality characteristics could be derived from the degree of customer satisfactions corresponding to the other two quality characteristics during the system design phase was verified.
Finally, the study has discussed the validity of three quality characteristics based on the significance of the developed prediction model.
3.1. Target Data
In recent years, due to the explosion of the Internet, purchasing behaviours of customers have significantly changed. For example, an increasing number of customers order a product directly from an electric commerce site without visiting brick-and-motor shops while remaining at home.
The degree of customer satisfaction is a measure use din marketing that represents how a product or service produced by a company meets or surpasses customer expectation. This study focuses on online reviews posted on the Internet, an effective alternative to face-to-face interviews of customers, and uses the online negative reviews of a system product as data to investigate.
This study also focuses on LPCs. Reasons for choosing LPCs are, at first, LPCs have attribute and characteristics that correspond to the six quality characteristics, and there isa large amount of data available on the nonfunctionality and non-quantitatively requirements on online review web-sites.
This study collects and uses online reviews of products posted at a web-site, kakaku.com [11] as customer’s expression of his/her dissatisfaction of system products.
Table 1 show the part of collection data concerning
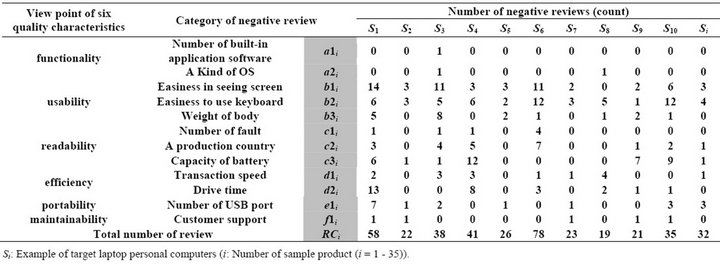
Table 1. Example of negative review from web-site.
negative review from web-site, which total number of type of LPCs are 35 and total number of review are 457.
From Table 1, this study counts the number of online negative reviews for each concrete category of interest of LPCs from the view point of the six quality characteristics. This study collects and classifies online negative reviews from the view point of the six quality characteristics in this manner.
Furthermore, for each product, this study obtains the degree of customer dissatisfaction for each of the six quality characteristics taking into account the interest of attribute of LPCs (i.e., weight for) correspond to the six quality characteristic.
The RCi is the total number of online reviews of a given product, and p is the weight for the efficiency determined from the questionnaires as shown in Table 2.
3.2. Degreeof Customer Satisfaction
Table 2 show the questionnaires and example of result of importance of quality needs for each six quality characteristics obtain from questionnaires.
The questionnaires asked customers the question of “in purchasing a LPC, what attributes are important?” and have the customers assign a numeric order number between 1 and 15 based on the importance;
The order number is 1 for the most important for the quality characteristic, and the weight for the six quality characteristics are normalized in the range from 0 to 1.
This study quantitatively calculates the importance of customer needs for each quality characteristic.
For example, the importance of functionality as M is obtained from the following Equation (1).
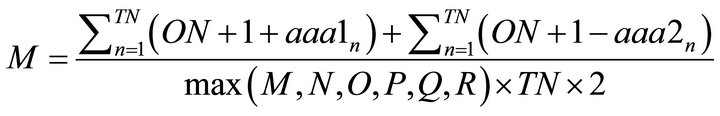 (1)
(1)
M: Importance ratio of functionality (weight)
aaa1n: Order number of importance (aaa1 = 1 - ON)
aaa2n: Order number of importance (aaa2 = 1 - ON)
n: Number of customers (n = 1 - TN)
ON: Maximum order number (ON = 15)
TN: Total number of customers (TN = 61)
Table 3 show the parts of result of degree of customer satisfaction for each quality characteristics.
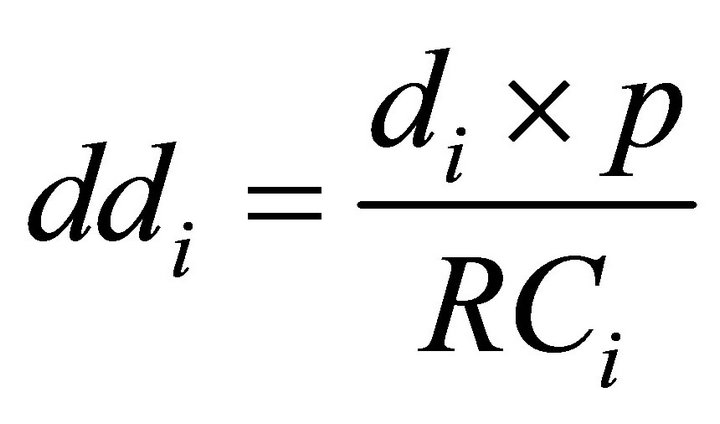
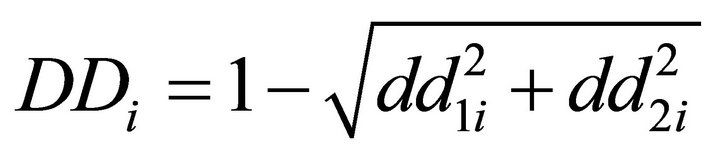
By applying the weight for each of the six quality characteristics, this study quantitatively calculates the degree of customer satisfaction for each six quality characteristics. For example, the degree of customer satisfaction for efficiency as DD is obtained as following Equations (2) and (3).
 (2)
(2)
 (3)
(3)
DDi: Customer satisfaction of efficiency
ddi: Ratio of un-satisfaction of efficiency by each category
di: Number of negative review of efficiency by each category
i: Number of sample product (i = 1 - 35)
P: Importance ratio of efficiency (weight)
RCi: Total number of online reviews of a given product
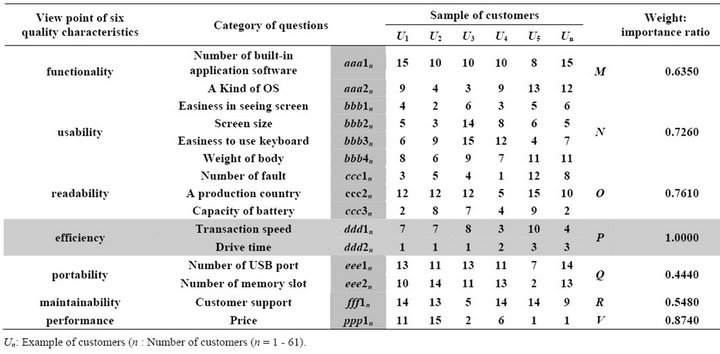
Table 2. Importance of quality needs by six quality characteristics.
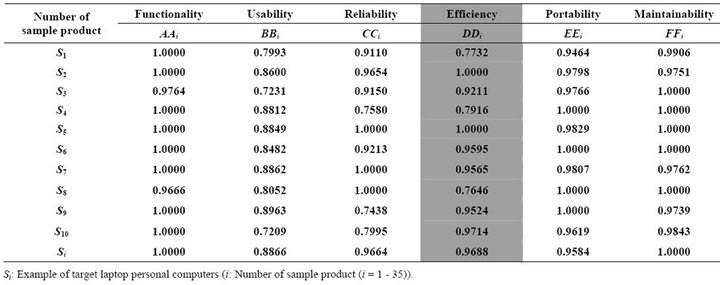
Table 3. Degree of customer satisfaction of six quality characteristics.
This study also quantitatively calculates the degree of customer satisfaction for each three quality characteristic included in the TDIVM.
The degree of customer satisfaction for three characteristic are obtained based on the consideration of independency among six quality characteristics as following Equations (4)-(6).
![]() (4)
(4)
![]() (5)
(5)
![]() (6)
(6)
X1i: Customer satisfaction of vale axis
Y1i: Customer satisfaction of performance axis
Z1i: Customer satisfaction of adaptability axis
4. Verification of Independency
4.1. Correlation Matrix between Six Quality Characteristics
Table 4 shows the result of correlation analysis among six quality characteristics. Since the correlation coefficient is small (at most −0.2583 about efficiency), there are not a correlation among each customer satisfaction from the view point of six quality characteristics and independency of each are recognized.
4.2. Multiple Regressions Analysis among Six Quality Characteristics
From Table 5, multiple-regression analysis between a given quality characteristic and the other five quality characteristics shows that the maximum value of the multipleregression coefficients and the determination coefficients are 0.3960 and 0.1569 about efficiency, respectively.
In addition, maximum value of F-test is 1.079. Since it is less than 5% significance level F0 = 2.534, this study confirms that there is no significance in predicting the degree of customer satisfaction.
Then, the cause and effect relationship between the degree of customer satisfaction corresponding to the one specified quality characteristic and those corresponding to any of the other five quality characteristics could not be observed.
Since consideration of above result, this study confirms that no causal relationship exists among the six quality characteristics.
This study verifies the validity of the introduced method of quantitatively obtaining customer quality requirements using the negative reviews of customer and using weight for the degree of customer needs for each of the six quality characteristics included in the quality model described in ISO/IEC9126-1.
5. Verification of Three Dimensional Models
5.1. Correlation Matrix
From Table 6, the result of correlation analysis is based on the consideration about weight. Since the correlation coefficient is small (at most −0.3274 about performance), there are not a correlation among each customer satisfaction from the view point of three characteristics and independency of each are recognized.
5.2. Multiple Regressions Analysis
From Table 7, multiple-regression analysis for the other two quality characteristics shows that the maximum value of the multiple-regression coefficients and the determination coefficients are 0.3404 and 0.1159 about performance, respectively. In addition, multiple-regression analysis of the customer satisfaction shows that the maximum value of F-test is 2.0967. Since it is less than 5% signifi-
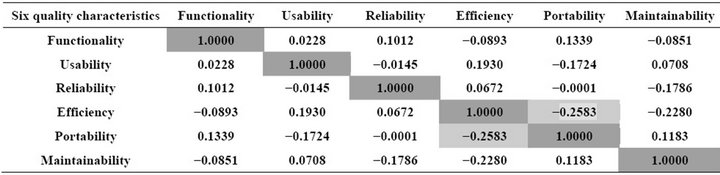
Table 4. Correlation matrix between six quality characteristics.
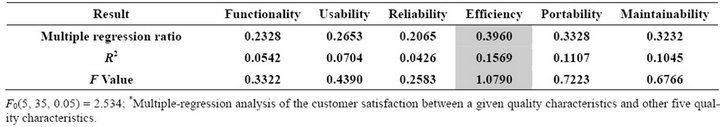
Table 5. Result of multiple regression analysis among six quality characteristics.
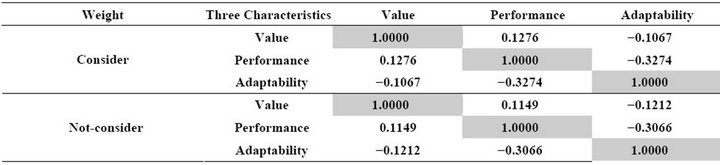
Table 6. Correlation matrix between three characteristics.
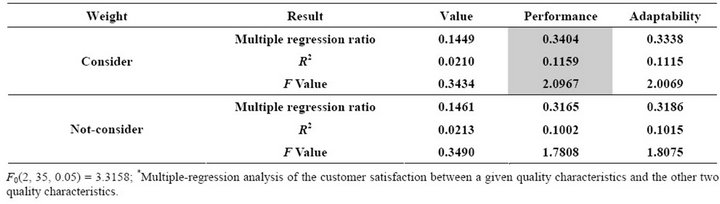
Table 7. Result of multiple regression analysis.
cance level F0 = 3.3158, this study confirms that there is no significance in predicting the degree of customer satisfaction between a given quality characteristic and that for any of the other two quality characteristics.
Since, this study confirms that no causal relationship exists among the three characteristics.
This study verifies the validity of the introduced method of quantitatively obtaining customer quality requirements using the negative reviews of customer and using weight for the degree of customer needs for each of the three quality characteristics included in the three dimensional integrated value quality models.
6. Conclusions
From the results of study, in the three characteristics defined in introduced “Three Dimensional Integrated Value Model”, the degree of customer satisfaction have confirmed to be independent from each other, and have no additivity.
From the results of Table 7, the cause and effect relationship between the degree of customer satisfaction corresponding to the one specified characteristic and those corresponding to the other two characteristics included in the three characteristics could not be observed.
As shown in Figure 3, it is believed that the overall
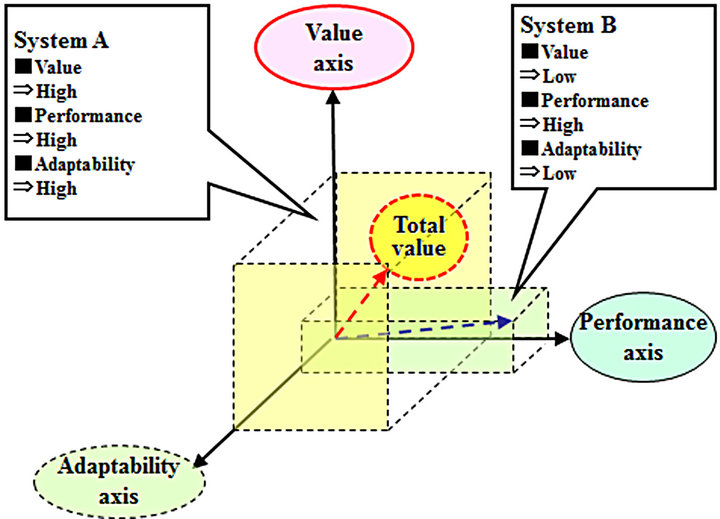
Figure 3. Example of system view based on the three dimensional integrated value model.
quality of the system product could be confirmed visually by using proposed Three Dimensional Integrated Value Model. Also, entire quality of system can be assessed and compared by using integration indicator of the comprehensive evaluation of the system, which could be represented through the vectors or the volume of the cubic solid formed by the three characteristics.
Therefore, these models may be considered very useful for total quality assessment and comparison for an entire quality of system.
In the future study, the author plans to develop a model to quantitatively predict the degree of customer satisfaction by using the attributes of system product that the product should achieve.
7. Acknowledgements
The authors are grateful to members of production system research office at Graduate School of Factory of Science and Engineering HOSEI University who their contributions and support to make the discussion.
REFERENCES
- ISO/IEC25000: Software Engineering—Software Product Quality Requirements and Evaluation (SQuaRE)—Guide to SQuaRE, International Organization for Standardization, 2005.
- ISO/IEC25030: Software Engineering—Software Product Quality Requirements and Evaluation (SQuaRE)—Quality Requirement, International Organization for Standardization, 2007.
- ISO/IEC25040: Software Engineering—System and Software Quality Requirements and Evaluation (SQuaRE)— Evaluation Process, 2011.
- ISO/IEC25041: Software Engineering—System and Software Quality Requirements and Evaluation (SQuaRE)— Evaluation Guide for Developers, Acquirers and Independent Evaluators, 2012.
- ISO/IEC9126-1: Software Engineering—Product Quality Part1: Quality Model, 2001.
- ISO/IEC25010: Software Engineering—System and Software Quality Requirements and Evaluation (SQuaRE)— System and Software Quality Model, Internationl Organization for Standardization, 2011.
- B. W. Boehm, et al., “Quantitative Evaluation of Software Quality,” Proceedings of the 2nd International Conference on Software Engineering, San Francisco, 13-15 October 1976, pp. 596-605.
- J. A. McCall, et al., “Factors in Software Quality,” RADC TR-77369, 1977.
- K. Esaki1, Y. Ichinose and S. Yamada, “Statistical Analysis of Process Monitoring Data for Software Process Improvement and Its Application,” American Journal of Operations Research, Vol. 3, No. 1A, 2012, pp. 43-50.
- K, Esaki1, “Verification of Quality Requirement Method,” American Journal of Operations Research, Vol. 2, No.1, 2013, pp. 70-79.
- Kakaku.com. http://www.kakaku.com