New Journal of Glass and Ceramics
Vol.3 No.3(2013), Article ID:34148,8 pages DOI:10.4236/njgc.2013.33015
The Effect of Compositional Variation on Physical Properties of Te9Se72Ge19-XSbx (X = 8, 9, 10, 11, 12) Glassy Material
![]()
1Department of Physics, Centre of Excellence, Government Degree College Sanjauli, Shimla, India; 2Department of Physics, Himachal Pradesh University, Shimla, India.
Email: *avnidhi1@gmail.com
Copyright © 2013 Anant Vidya Nidhi et al. This is an open access article distributed under the Creative Commons Attribution License, which permits unrestricted use, distribution, and reproduction in any medium, provided the original work is properly cited.
Received April 25th, 2013; revised May 24th, 2013; accepted June 7th, 2013
Keywords: Quaternary Chalcogenide Glass; Heat of Atomization; Mean Bond Energy; Glass Transition Temperature
ABSTRACT
The quaternary chalcogenide glass Te9Se72Ge19-xSbx (x = 8, 9, 10, 11, 12) has been prepared by the melt quench technique. The material fragility increases due to decrease in degree of cross linking in glass matrix as the Sb content increases. The heat of atomization decreases due to lower value of heat of atomization of antimony. The glass transition temperature is calculated by Tichy-Ticha and Lankhorst approaches. The glass seems to have high value of glass transition temperature as per theoretical calculations and is monotonically decreasing with increasing Sb content because increasing concentration of Sb reduces the cohesive energy and mean bond energy of the material.
1. Introduction
The oxide and non-oxide glasses are used in various fields of material science due to their unique properties. Chalcogenide glasses among non-oxide glasses are formed from chalcogen family of group VI elements of the periodic table. These glasses have advantages over the other types of glasses such as halide glasses and oxide glasses (silica glasses) because of their lower value of phonon energy and high refractive index [1]. These glasses have emerged as most promising materials due to their applications in various solid state devices both in scientific and technological fields such as electrical switching, infrared optical fibres, photo induced properties for optical storage and optical imaging [2-5] because of their unique properties such as extended infrared transparency, high photosensitivity, ease of fabrication and processing, good chemical durability, and second/third order optical non-linearity [6]. The various disadvantages associated with pure Se alloy such as short life time and poor sensitivity [7] can be improved by alloying it with other materials like Te, Ge, Sb, Bi, etc. [8]. The addition of Te improves its corrosion resistance and optical sensitivity [9]. Se-Ge-Sb glasses have low transmission loss and high transparency to infrared radiations from 2 - 16 µm
[10]. Ge-Se and Sb-Se glasses are promising materials for infrared optical fibres not only due to their high non-linearity and refractive index but also to their relatively good thermo-mechanical and chemical properties. The versatile behaviour of these materials makes us select this composition and study the effect of Sb incorporation in physical properties of Ge-Te-Se glasses.
2. Experimental Details
Material Preparation and Characterisation
Bulk chalcogenide alloys of Te9Se72Ge19-xSbx (x = 8, 9, 10, 11, 12) have been prepared by melt quench technique. Se and Te in powder form with 99.999% purity (Alpha Aesar) and Ge and Te with 99.999% purity (Acros organics) were weighed according to their atomic weight percentage. These materials were put in cleaned quartz ampoule of 8 mm diameter and about 10 cm in length. The ampoules were sealed at very high vacuum pressure of 5 × 10⁻⁵ milli bar in order to avoid the oxygen contamination and counter balance the high vapour pressure in the ampoule created at higher temperature. The sealed ampoules were heated in a furnace at a heating rate of 3˚C - 4˚C/minute and temperature was raised to 1000˚C.
The ampoules were kept at highest temperature for 15 hours and continuously rocked at an interval of 1 hour to ensure the homogeneous mixture. Heated ampoules were quenched in ice cold water. The ingots of alloy were extracted by breaking the quartz tube. The bulk material was grinded to fine powder form for X-Ray diffraction (XRD). The amorphous nature of the sample were investigated by Panalytical X’Pert-Pro diffractometer (PW 3050/60) by using Cu target source (λ = 1.5483 A). Absence of any sharp peak in the diffractograms confirms the vitreous nature of the material as shown in Figure 1. There are two halos in the XRD diffractogram of the sample, first in the range 22˚ - 32˚ and second in the range 43˚ - 53˚ indicates the phase separation in the material. First halo is due to the Se rings and shows the polymeric nature of the glass and second might be due to the Sb2Se3 phase separation in the material.
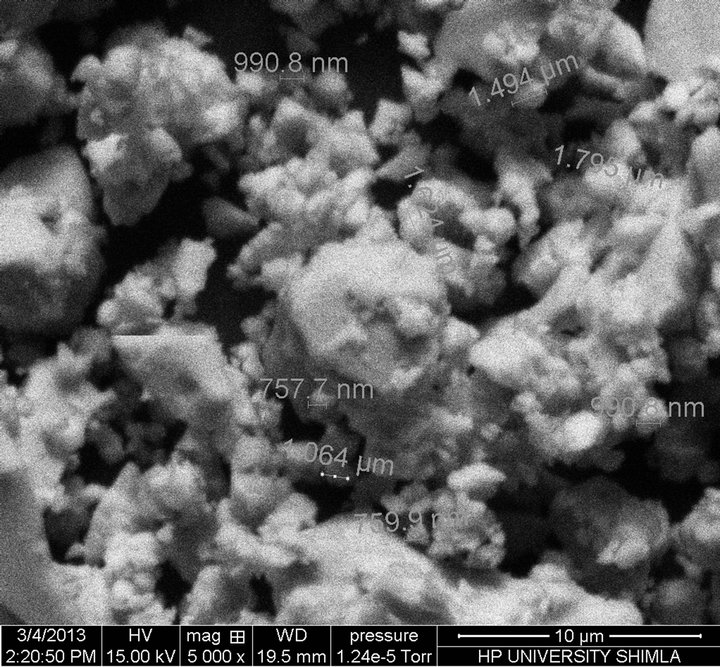
Scanning electron microscope is used to study the inhomogeneity in the sample and to find particle or grain size of the material formed in the sample. There is an indication of the partial phase separation in the material due to inhomogeneity in the sample, which is clear from the SEM micrographs shown in Figure 2.
3. Theoretical Studies of Physical Parameters
3.1. Structural Constraints Theory
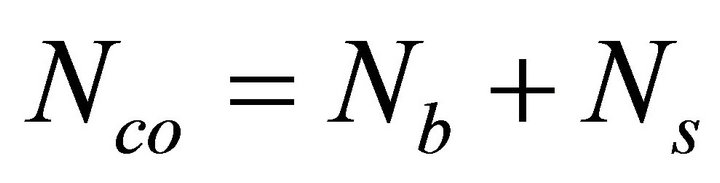
Rigidity theory introduced by J. C. Phillips [11] and later on developed by M. F. Thorpe [12] plays an important role in understanding the mechanical and structural properties of network glasses in terms of average number of mechanical constraints. Thorpe made an assumption that the most important forces between the atoms are the nearest neighbour bond stretching forces and bond bending forces. Weak forces like Van der Waals forces are neglected. The rigidity of network glasses is described as constraints counting or Maxwell counting. Hence, only bond stretching and bond bending constraints are counted. The number of bond-stretching constraints for atoms having m bonds is  m/2 since each bond is shared by two atoms. The number of bond-bending constraints is Ns = 2m − 3, since beyond m = 2 each new bond introduces two new angles. According to Phillips theory, glass formation will be maximised when the total number of constraints
  is equal to total number of degrees of freedom. This is possible when average coordination number (m) is equal to 2.4 and is known as rigidity percolation threshold. Ideal mechanical stability is achieved at m = 2.4 at which the number of inter-atomic force-field constraints per atom equals the number of vector degrees of freedom per atom. Specifically, for m < 2.4, the network is under-constrained (floppy or spongy) whereas for m > 2.4, the network is over-constrained (rigid). The floppy-to-rigid transition occurs at m = 2.4 where properties would exhibit anomalous behaviour. According to constraints counting or Maxwell counting [13], the number of floppy modes can be written as
 (1)
(1)
3.2. Average Coordination Number and Floppy Modes
For quaternary chalcogenide system of Te, Se, Ge and Sb under investigation, the average coordination number (m) for covalently bonded materials is given by [14].
 (2)
(2)
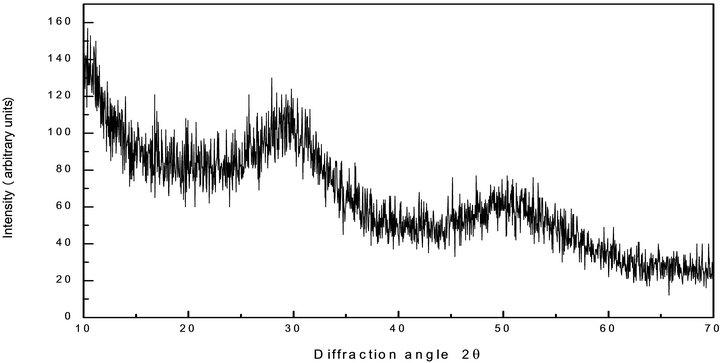
Figure 1. X-Ray diffraction pattern of the Te9Se72Ge11Sb8 chalcogenide glass composition.
 (a)
(a)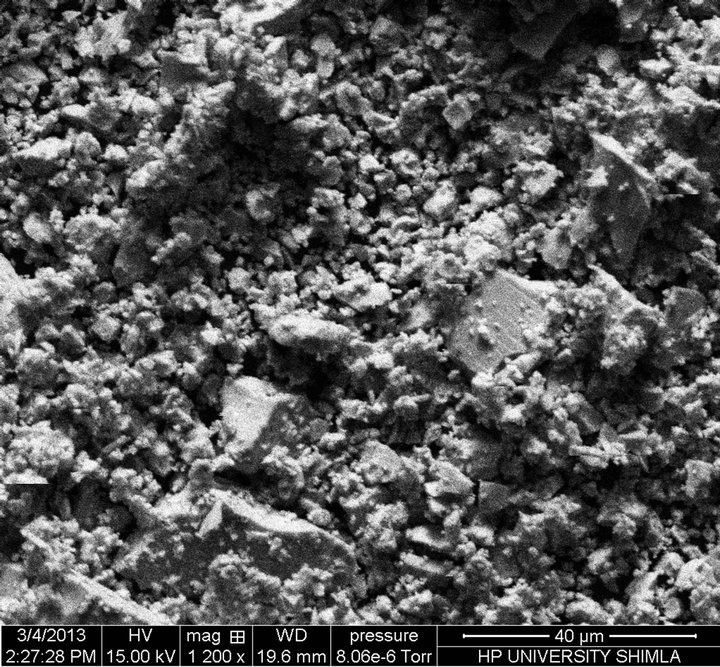 (b)
(b)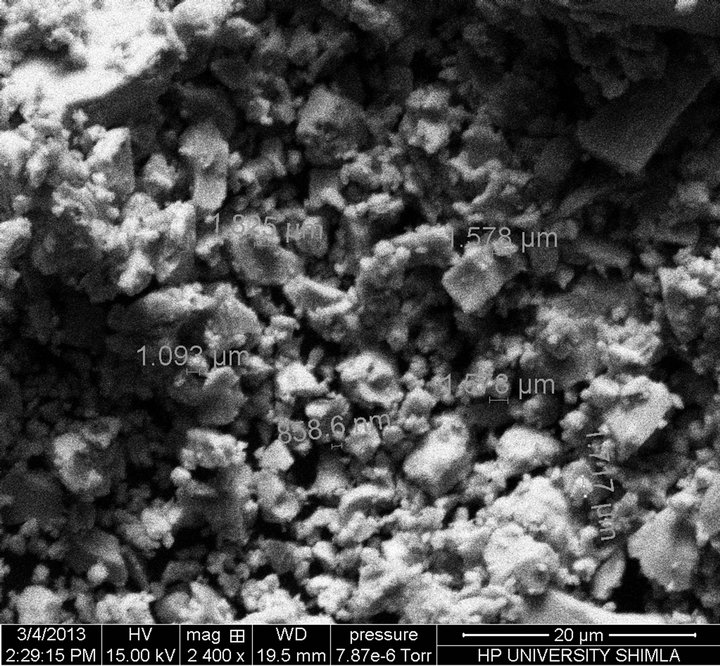 (c)
(c)
Figure 2. Scanning Electron Micrographs of composition at (a) x = 8, (b) x = 10, (c) x = 12.
Where the coordination numbers  are calculated by 8N rule and α, β, γ, δ are the atomic weight percentages of Te, Se, Ge and Sb respectively. On replacing Ge element having higher coordination number by Sb, the average coordination number of the system decreases from 2.30 to 2.26. Mechanical constraints (
 ) associated with atomic bonding and effective coordination number (meff) have impact on covalent bonded networks. In this chalcogenide system Te9Se72Ge19-xSbx (x =8, 9, 10, 11, 12), the total number of constraints are given by
 (3)
(3)
By calculating the total number of constraints, effective average coordination number can be calculated as
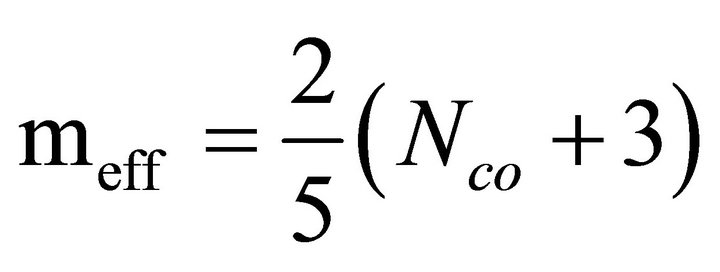 (4)
(4)
where the values of  ,
,  ,
, and meff for the glassy system Te9Se72Ge19-xSbx (x = 8, 9, 10, 11, 12) are listed in Table 1.
It is evident from the Figure 3 that with the increase in the Sb concentration, the average coordination number decreases hence average number of the constraints also decreases. The decrease in the average coordination number decreases the degree of cross linking in the network. The fall in the degree of cross linking in the network gives rise to the floppy mode in the network and
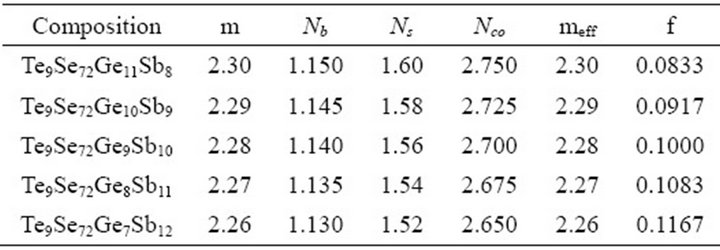
Table 1. Average coordination number, constraints, effective average coordination number and number of floppy modes for the composition Te9Se72Ge19-xSbx.
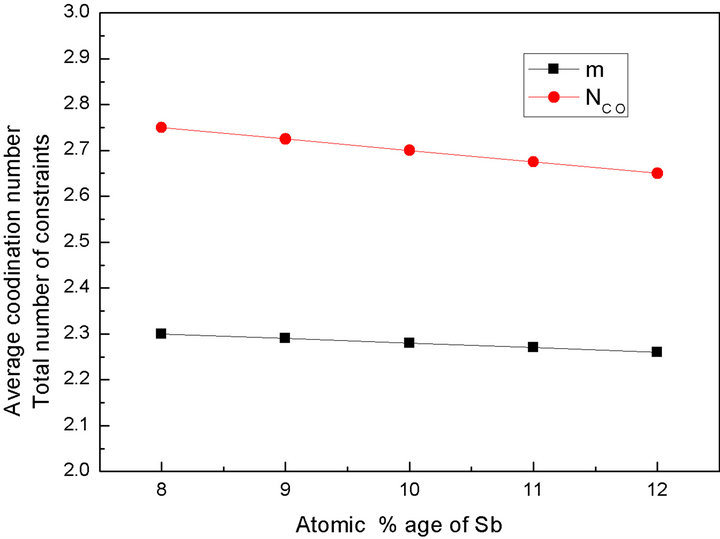
Figure 3. Variation of average coordination number and total number of constraints with atomic % age of Sb.
makes the material fragile or spongy [15].
3.3. Role of Lone-Pair Electrons in Glass Forming Ability
The number of lone pair electrons in a chalcogenide glass system can be calculated by the relation [16,17].
 (5)
(5)
here L, V and m are the lone-pair electrons, the average valence electrons and the coordination number respectively. The number of lone-pair electrons for glassy composition Te9Se72Ge19-xSbx (x = 8, 9, 10, 11, 12) obtained by using Equation (5) are listed in Table 2.
It has been observed that number of lone-pair electrons increase with increase in Sb content. Fouad et al. [18] reported that the increase in lone-pair electrons decrease the strain energy of the network and the composition with large lone-pair of electrons must favour glass formation. Chalcogenide glasses with lone pair electrons show a character of flexibility [19]. This flexibility of bonds causes these atoms to readily form amorphous network either alone or with a variety of other atomic constituents. In this composition, the number of lone-pair electrons increase because the sharing of lone-pair electrons of the bridging Se atoms by Sb ion is comparatively
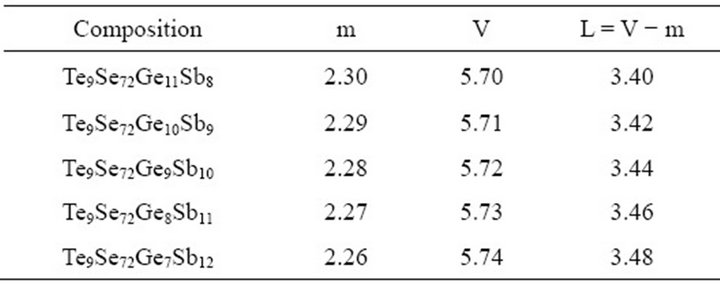
Table 2. Average coordination number, average valence electrons and number of lone-pair electrons for the composition Te9Se72Ge19-xSbx (x = 8, 9, 10, 11, 12).
low as compared to Ge ion. A graphical representation of lone-pair electrons versus atomic % age of Sb is shown in Figure 4.
The chalcogenide glass so prepared is rich in chalcogen as it is clear from the calculation of deviation of stoichiometry (R) [20] given by
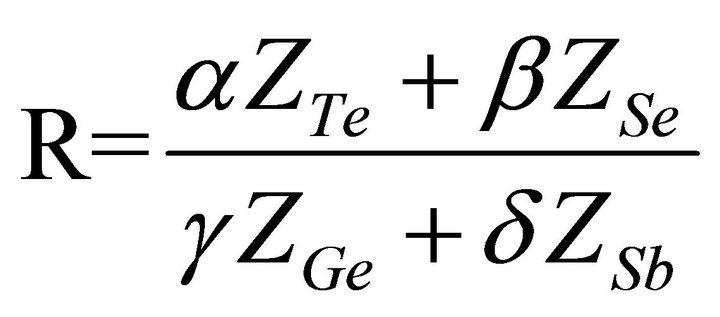 , where α, β, γ and δ are the atomic percentages of Te, Se, Ge and Sb respectively. For chalcogen rich material it comes out to be greater than 1.
3.4. Heat of Atomization
Heat of atomization or the enthalpy of atomization is the enthalpy change that is required for total separation of all atoms in a chemical compound such that the compound bonds are broken and component atoms are reduced to individual atoms. As proposed by Pauling [21], the heat of atomization 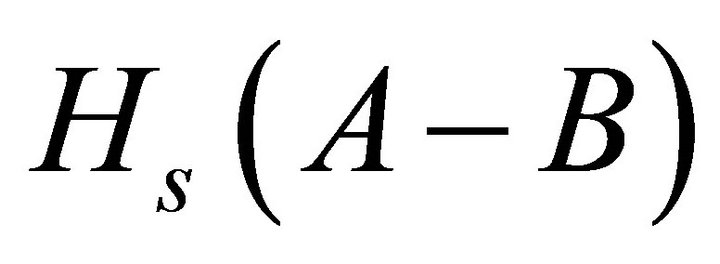 for a binary semiconductor formed from atom A and B at standard pressure and temperature is the sum of heat of formation ΔH and average heat of atomization (
 and
and ) of the two atoms and is given by the relation.
 (6)
(6)
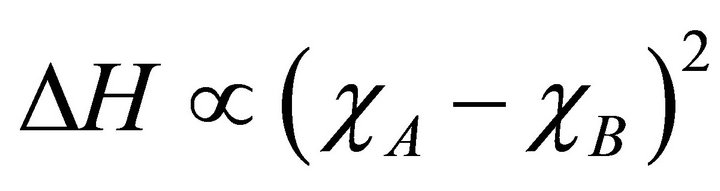
the term ΔH given in the above Equation (6) is proportional to the square of difference between the electronegativities  and
and  of the two atoms.
 (7)
(7)
In case of some materials for which it is found that the heat of atomization ΔH is about 10% of average heat of atomization and hence can be neglected. In the case of ternary and higher order semiconductor compounds, heat of atomization for quaternary compound  can be written as [14].
 (8)
(8)
where α, β, γ and δ are the atomic percentages of Te, Se, Ge and Sb. Heat of atomization (Hs) value for Te, Se, Ge
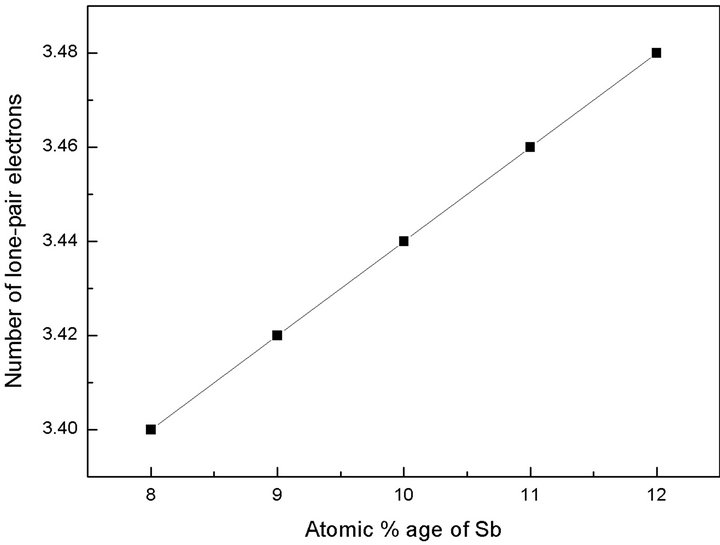
Figure 4. Variation of number of lone-pair electrons with atomic % age of Sb.
and Sb are 197 KJ/mol, 227 KJ/mol, 377 KJ/mol and 262 KJ/mol respectively [22,23]. The value of heat of atomization for Te9Se72Ge19-xSbx (x = 8, 9, 10, 11, 12) chalcogenide glass are calculated and are enlisted in Table 3.
The graphical variation of heat of atomization with increasing Sb content is shown in Figure 5.
It is clear from the figure that with the increase in atomic % age of Sb, heat of atomization of the compound goes on decreasing. This can be explained as Sb content increases the number of Sb-Se bonds increase and Ge-Se bonds decrease. As the heat of atomization of Sb is less than Ge, so this lesser value of Sb decreases the heat of atomization of the network and hence the overall heat of atomization of the material decreases.
3.5. Bond Energy, Distribution of Bonds and Cohesive Energy
The possible bonds formed in our quaternary chalcogenide system of Se-Te-Ge-Sb are Se-Ge, Se-Se, Se-Te and Se-Sb. According to chemical bond approach (CBA) [24] combination in the atoms of different type take place more easily rather than in the atoms of same type. These bonds are formed in the sequence of decreasing bond energy until the available valence of atoms is saturated. The bond formation in the atoms of similar kind takes place only when there is excess of similar atoms. The Ge-Se glassy system is a covalent chalcogenide system. The bond energy of heteropolar bonds can be estimated by the Pauling method in terms of the the bond energy of homopolar bonds and the electronegativity of the atoms involved. The bond energy E (A − B) of heteronuclear bond can be calculated by using the following equation [23].
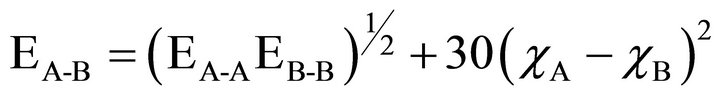 (9)
(9)
 and
and  are the bond energies of homonuclear
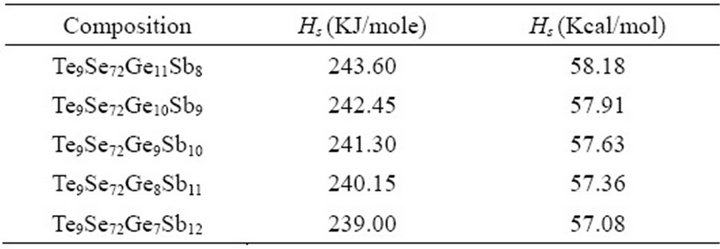
Table 3. Heat of atomization for the composition Te9Se72 Ge19-xSbx (x = 8, 9, 10, 11, 12).
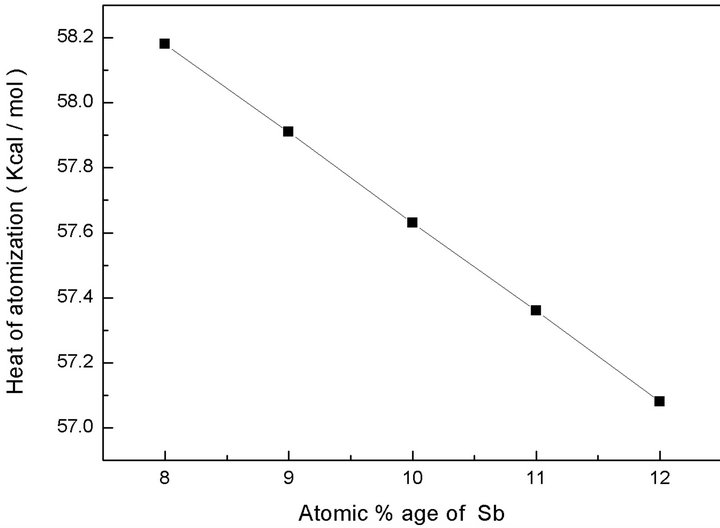
Figure 5. Response of heat of atomization with atomic % age of Sb.
bonds. χA and χB are the electronegativity values of A and B elements respectively. The bond energy of the homopolar bonds ,
,  ,
, and
and  used here are 37.6 Kcal/mol, 44 Kcal/mol, 33 Kcal/mol and 30.2 Kcal/mol [14,25] and the electronegativity value for Se,Te, Ge and Sb are 2.55, 2.10, 2.01 and 2.05 respectively [23]. By using the Equation (9) values of
 ,
,  and
and  have been calculated and are given as 49.42 Kcal/mol, 44.18 Kcal/mol and 43.95 Kcal/mol respectively.
The bonds are formed in order of decreasing bond energy. Se-Ge bonds having maximum energy are formed first followed by Se-Te and Se-Sb bonds. As these bond energies are assumed to be additive, so the cohesive energies can be calculated by summing the bond energies over all possible bonds in a compound. Cohesive energy measures the average bond strength of the system and is defined as stabilization energy of the large cluster of material per atom. Cohesive energy is calculated as
 (10)
(10)
where  is the probability of formation of expected bonds and
  is energy of the corresponding bond present in the system. Chemical distribution of bonds, electronegativity and cohesive energy for the composition Te9Se72Ge19-xSbx (x = 8, 9, 10, 11, 12) are listed in Table 4.

Table 4. Electronegativity, distribution of chemical bonds and cohesive energy for the composition Te9Se72Ge19-xSbx (x = 8, 9, 10, 11, 12).
It is clear from the Figure 6 that cohesive energy of the composition decreases as Sb content in the system increases. Cohesive energy decreases because weaker Se-Sb bonds increase at the cost of stronger Se-Ge bonds.
Electronegativity of the composition is defined as geometric mean of all the constituents forming a compound. Since the bond formulation with Sb are partially ionic in nature and produces ionic character in the material. This weakens the network and deviate the structure towards fragility. The decrease in cohesive energy decreases the energy of conduction band edge that causes a decrease in the gap between bonding and antibonding orbitals and hence optical energy gap decreases [14].
3.6. Mean Bond Energy and Glass Transition Temperature
The mean bond energy  is an important parameter in chalcogenide glasses which determine many properties of material. It depends upon the factors like average coordination number, degree of cross-linking, type of bond and bond energy in a system. For chalcogenide rich system the mean bond energy can be calculated by correlation proposed by Tichy and Ticha [26,27]. The overall mean bond energy of the system TeαSeβGeγSbδ is given by:
 (11)
(11)
where  is the overall contribution towards bond energy arising from the average cross-linking per atom and
  is the average bond energy per atom of the remaining matrix i.e. contribution from weaker bonds that remains after the strong bonds have been maximised.
  is given as
 (12)
(12)
here  is the degree of cross linking and is given as
 (13)
(13)
Dhb is the average heteropolar bond energy and is given by
 (14)
(14)
 is given by
 (15)
(15)
the overall mean bond energy  for the glassy composition Te9Se72Ge19-xSbx (x = 8, 9, 10, 11, 12) is listed in the Table 5 and is found to decrease with increasing Sb content. A graphical variation of mean bond energy with atomic % age of Sb is shown in Figure 7.
The glass transition temperature (Tg), below which super cooled liquid becomes glassy alloy has been predicted theoretically for the composition by using two methods proposed by Tichy-Ticha and M.H.R. Lankhorst.
In first method Tichy and Ticha proposed an impressive relation between glass transition temperature and mean bond energy given by [26,27].
 (16)
(16)
where Tg is in Kelvin and  is in eV/atom.
In second method Lankhorst [28] has introduced a
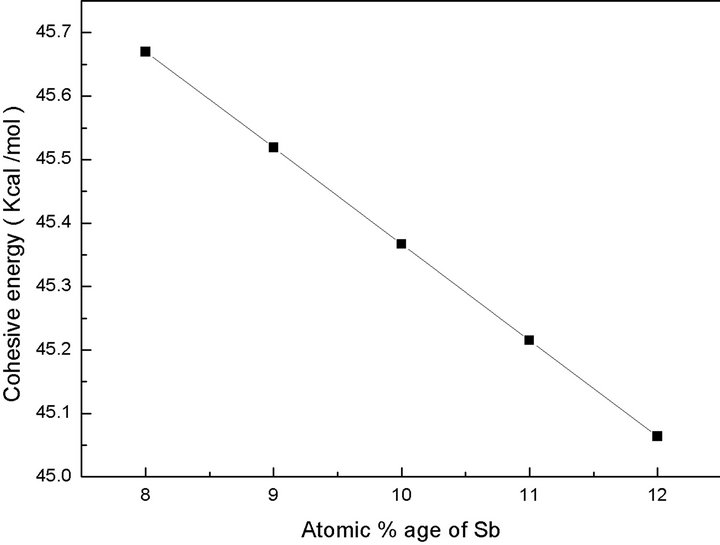
Figure 6. Variation of cohesive energy with Sb content.

Table 5. Value of heat of atomisation, mean bond energy, glass transition temperature.
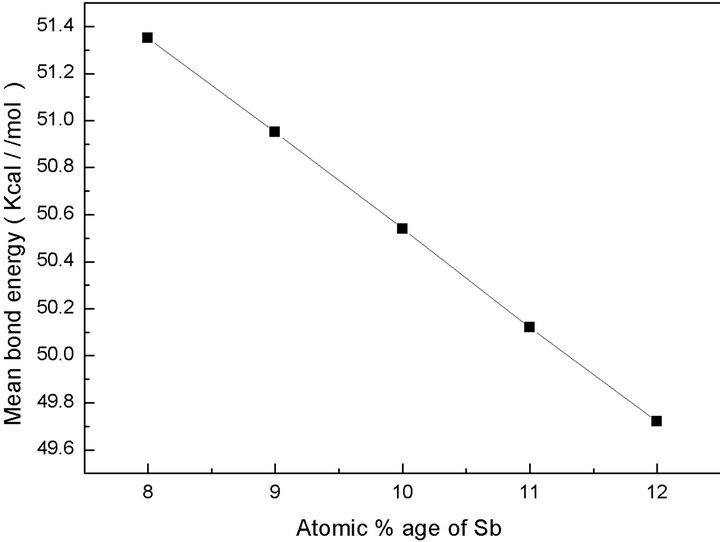
Figure 7. Variation in mean bond energy with atomic % age of Sb.
model to estimate the glass transition temperature based on enthalpy of atomization. This model is applicable to covalent amorphous materials formed from elements of group I-VI for which average number of valence electrons are not less than 4. This method is useful for development of phase change materials for rewritable optical recording. According to this model glass transition temperature is related to heat of atomisation by an empirical relation given as
 (17)
(17)
where Tg is in Kelvin and Hs is in KJ/mol.
The variation of mean bond energy  and glass transition temperature (Tg) with Sb content and heat of atomization are tabulated in Table 5. The variation in glass transition temperature (Tg) with Sb content is shown in Figure 8.
Glass transition temperature (Tg) calculated by two approaches is decreasing because of the combined effect of heat of atomization and mean bond energy variation with Sb content in the material.
4. Conclusion
The material is amorphous in nature as there is no prominent sharp peak in any diffractogram of the material.
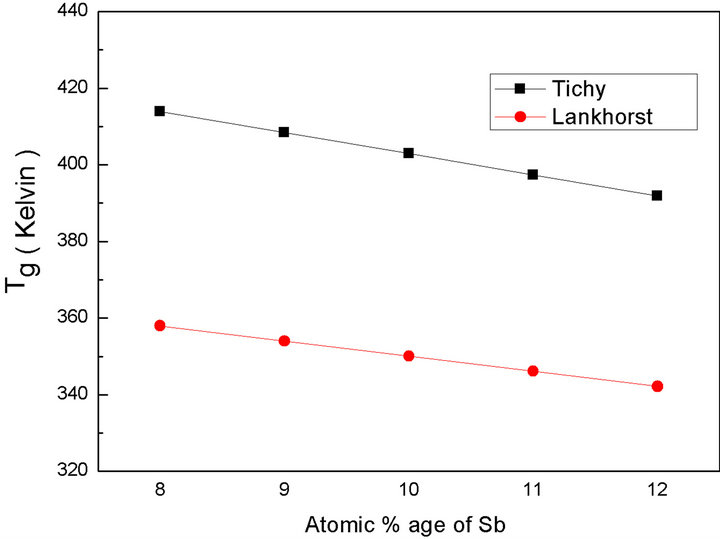
Figure 8. Variation in glass transition temperature (Tg) with atomic % age of Sb.
There are some structural inhomogeneities in the material which are predicted in the X-Ray diffractograms and scanning electron micrographs of the samples. These may be due to partial phase separation in material. The fragility in the material increases because glass is under constraint and floppy modes are increasing. The cohesive energy of the investigated samples has been calculated by using chemical bond approach. The heat of atomization and the mean bond energy are found to decrease with increasing Sb content. This decrease in heat of atomization (Hs) and mean bond energy  is due to lesser value of heat of atomization of Sb and lower value of bond energy of Se-Sb bond than Se-Ge bond. All these variations account for the fall in glass transition temperature with rising concentration of Sb.
REFERENCES
- N. Mehta, “Application of Chalcogenide Glasses in Electronics and Optoelectronics: A Review,” Journal of Scientific and Industrial Research, Vol. 65, No. 10, 2006, pp. 777-786.
- S. R. Ovshinsky, “Reversible Electrical Switching Phenomena in Disordered Structures,” Physical Review Letters, Vol. 21, 1968, pp. 1450-1453. doi:10.1103/PhysRevLett.21.1450
- J. R. Gannon, “Materials for Mid-Infrared Waveguides,” SPIE, Vol. 266, 1981, pp. 62-68. doi:10.1117/12.959899
- S. M. El-Sayed, H. M. Saad, G. A. Amin, F. M. Hafez and M. Abd-EI-Rahman, “Physical Evolution in Network Glasses of the Ag As Te System,” Journal of Physics and Chemistry of Solids, Vol. 68, No. 5-6, 2007, pp. 1040- 1045. doi:10.1016/j.jpcs.2006.12.033
- X. Zhang., H. Ma and J. Lucas, “Application of Chalcogenide Glass Bulk and Fibres,” Journal of Optoelectronics and Advanced Materials, Vol. 5, No. 5, 2003, pp. 1327-1333.
- N. Kushwaha, V. S. Kushwaha, R. K. Shukla and A. Kumar, “Effect of Lead Additive on Photoconductive Properties of Se-Te Chalcogenide Films,” Journal of NonCrystalline Solids, Vol. 351, No. 43-45, 2005, pp. 3414- 3420. doi:10.1016/j.jnoncrysol.2005.09.011
- S. A. Khan, M. Zulfequar and M. Husain, “On the Crystallization Kinetics of Amorphous Se80In20-xPbx,” Solid State Communications, Vol. 123, No. 10, 2002, pp. 463- 468. doi:10.1016/S0038-1098(02)00147-3
- S. A. Fayek, M. Fadel, M. O. Abou-Helal and A. M. Shakra, “Kinetic Study of Non Isothermal Crystallization in SeGeX {X=0, Bi, In and Sb} Chalcogenide Glasses,” Chalcogenide Letters, Vol. 5, No. 12, 2008, pp. 317-331.
- R. Chiba, N. Funakoshi, “Crystallization of Vacuum Deposited Te Se Cu Alloy Film,” Journal of Non-Crystalline Solids, Vol. 105, No. 1-2, 1988, pp. 149-154. doi:10.1016/0022-3093(88)90349-3
- R. Tintu, V. P. N. Nampoori, P. R. Krishanan and S. Thomas, “Preparation and Optical Characterization of Novel Ge-Se-Sb)/PVA Composite Films for Optical Limiting Application,” Journal of Physics D: Applied Physics, Vol. 44, No. 2, 2011, Article ID: 025101. doi:10.1088/0022-3727/44/2/025101
- J. C. Phillips, “Topology of Covalent Non-Crystalline Solids I: Short-Range Order in Chalcogenide Alloys,” Journal of Non-Crystalline Solids, Vol. 34, No. 2, 1979, pp. 153-181. doi:10.1016/0022-3093(79)90033-4
- M. F. Thorpe, “Continuous Deformation in Random Network,” Journal of Non-Crystalline Solids, Vol. 57, No. 3, 1983, pp. 355-370. doi:10.1016/0022-3093(83)90424-6
- M. V. Chubynsky and M. F. Thorpe, “Rigidity Percolation and the Chemical Threshold in Network Glasses,” In: M. A. Popescu, Ed., Physics and Applications of Disordered Materials, INOE Publishing House, Bucharest, 2002, pp. 229-240.
- V. Modgil and V.S. Rangra, “The Study of the Theoretical Parameters of Ge Sn Substituted Pb Based Quaternary Chalcogenide Glasses at Their Rigidity Percolation Threshold,” Journal of Optoelectronics and Advanced Materials, Vol. 13, No. 2, 2011, pp. 158-164.
- G. G. Naumis, “Energy Landscape and Rigidity,” Physical Review E, Vol. 71, No. 2, 2005, Article ID: 026114, pp. 1-7.
- A. George, D. Sushamma and P. Predeep, “Effect of Indium Content on the Optical and Other Physical Characteristics of As-Te Glass System,” Chalcogenide Letters, Vol. 3, No. 4, 2006, pp. 33-39.
- L. Zhenhua, “Chemical Bond Approach to the Chalcogenide Glass Forming Tendency,” Journal of Non-Crystalline Solids, Vol. 127, No.3, 1991, pp. 298-305. doi:10.1016/0022-3093(91)90482-L
- S. S. Fouad, S. A. Fayek and M. H. Ali, “Physical Evolution and Glass Forming Tendency of Ge1−xSnxSe2.5 Amorphous system,” Vacuum, Vol. 49, No. 1, 1998, pp. 25-30. doi:10.1016/S0042-207X(97)00122-X
- Mainka, P. Sharma and N. Thakur, “Effect of Germanium Addition on the Physical Properties of Se-Te Glassy Semiconductors,” Philosophical Magazine, Vol. 89, No. 33, 2009, pp. 3027-3036. doi:10.1080/14786430903166700
- O. A. Lafi, M. M. A. Imran and M. K. Abdullah, “Chemical Bond Approach to Glass Transition Temperature and Crystallization Activation Energy in Se90In10-xSnx (2 <= x<= 8) Semiconducting Glasses,” Materials Chemistry and Physics, Vol. 108, No. 1, 2008, pp. 109-114. doi:10.1016/j.matchemphys.2007.09.011
- L. Pauling, “The Nature of the Chemical Bond,” Cornell University Press, New York, 1960.
- H. Schumm, D. D. Wagman, S. Bailey, W. H. Evans and V. B. Parker, “In National Bureau of Standards (USA) Technical Notes,” 1973, pp. 1-8.
- J. D. Cox, D. D. Wagman and V. A. Medvedev, “CODATA Key Values for Thermodynamics,” Hemisphere Publishing Corp., New York, 1989.
- J. Bicerano and S. R. Ovshinsky, “Chemical Bond Approach to the Structures of Chalcogenide Glasses with Reversible Switching Properties,” Journal of Non-Crystalline Solids, Vol. 74, No. 1, 1985, pp. 75-84. doi:10.1016/0022-3093(85)90402-8
- V. Pamukchieva, A. Szekeres, K. Todorova, M. Fabian, E. Svab, Zs. Revay and L. Szentmiklosi, “Evaluation of Basic Physical Parameters of Quaternary Ge-Sb-(S,Te) Chalcogenide Glasses,” Journal of Non-Crystalline Solids, Vol. 355, No. 50-51 2009, pp. 2485-2490. doi:10.1016/j.jnoncrysol.2009.08.028
- L. Tichy and H. Ticha, “On the Chemical Threshold in Chalcogenide Glasses,” Materials Letters, Vol. 21, No. 3-4, 1994, pp. 313-319. doi:10.1016/0167-577X(94)90196-1
- L. Tichy and H. Ticha, “Covalent Bond Approach to the Glass Transition Temperature of Chalcogenide Glasses,” Journal of Non-Crystalline Solids, Vol. 189, No. 1-2, 1995, pp. 141-146. doi:10.1016/0022-3093(95)00202-2
- M. H. R. Lankhorst, “Modelling Glass Transition Temperatures of Chalcogenide Glasses. Applied to Phase-Change Optical Recording Materials,” Journal of Non-Crystalline Solids, Vol. 297, No. 2-3, 2002, pp. 210-219. doi:10.1016/S0022-3093(01)01034-1
NOTES
*Corresponding author.