Journal of Crystallization Process and Technology
Vol.1 No.2(2011), Article ID:6553,6 pages DOI:10.4236/jcpt.2011.12005
Structural and Optical Properties of Triglycine Sulfate Single Crystals Doped with Potassium Bromide
![]()
Department of Physics, Bangladesh University of Engineering and Technology, Dhaka, Bangladesh.
E-mail: pranjal@dhaka.net, *jpodder@phy.buet.ac.bd
Received June 17, 2011; revised July 15, 2011; accepted July 23, 2011.
Keywords: Crystal Growth, Triglycine Sulfate, X-Ray Diffraction, Band Gap, Vicker’s Micro Hardness.
ABSTRACT
Triglycine sulfate crystal and potassium bromide doped triglycine sulfate crystals were grown from aqueous solution by slow evaporation method. Energy dispersive X-ray analysis identifies the elements present in the crystal. The Fourier Transform Infrared spectroscopy has been recorded in the range 400 to 4000 cm–1 and the functional groups of the grown crystals have been identified. The structural studies on the grown crystals were carried out by X-ray diffraction analysis technique and found that the grown crystal crystallizes in monoclinic structure. The lattice cell parameters of pure Triglycine sulfate are a = 9.6010 Å, b = 12.5600 Å, c = 5.4500 Å. Ultraviolet-Visible spectra show that the grown crystals have wide optical transparency in the entire visible region.
1. Introduction
Triglycine sulfate (TGS) crystal is an interesting ferroelectric and pyroelectric material which finds applications in the fabrication of infrared detectors, pyroelectric vidicon tube operating at room temperature, in the fabrication of capacitors, transducer and sensors [1,2]. TGS crystal shows a ferroelectric phase transition at the Curie point (49˚C). Below the Tc, TGS possesses the polar point symmetry of group 2 of the monoclinic system, spontaneous polarization along the b-axis and above Tc, it possesses the non polar point group 2/m of the monoclinic system [3,4]. Undoped TGS crystals have some disadvantages such as the ferroelectric domains possess high mobility at room temperature, easy depolarization by electrical and thermal means, microbial contamination with time during the growth and low curie point. These disadvantages can be overcome by adding suitable impurities to the lattice sites of TGS crystals [5-7]. Many organic and inorganic dopants have been used in order to overcome these disadvantages and to achieve effective internal bias to stabilize the domains and desired pyroelectric and ferroelectric properties [8-11]. Metallic ion dopants have been added to modify the properties of TGS crystals [12-14]. Rare earth metal ions such as La, Ce and Nd modified the morphology and conceive field values [15]. In this work, KBr is introduced; because it is water soluble and so far, KBr has not been introduced into the lattice of TGS in order to alter its mechanical, structural and optical properties. The objectives of present work are to investigate the effect of the dopant (KBr) on the growth, structural and optical properties of TGS crystals
2. Experimental
2.1. Materials
• AR grade glycine
• Concentrated sulfuric acid
• De-ionized water
• Potassium bromide
2.2. Equipments
Magnetic stirrer was used to prepare saturated solution. All crystals were grown by slow evaporation process. To confirm the presence of elements, EDX analysis was performed by Quanta Instect S-12919 system. The FTIR spectra of all grown crystals have been recorded in the range of 400 - 4000 cm–1 using Shimadzu FT-IR 8400 spectrophotometer by KBr pellet technique. To determine the lattice parameters, powder X-ray diffraction analysis was performed by Philips X’pert PRO X-ray diffractometer system with Cu-Kα (λ = 1.54178Å) radiation at room temperature (25˚C) with an operating voltage 40 kV and the tube current was 30 mA. In the present work, optical transmission and absorption spectra were recorded by SHIMADZU UV-160 a spectrometer in the wavelength range 190 to 1100 nm.
2.3. Synthesis and Growth
360 g of glycine dissolved in the solution of 85 mL of H2SO4 in 1 litre of water and it was heated at 50˚C to obtain the synthesized salt of TGS. Glycine reacts with sulfuric acid such as follows:
 (1)
(1)
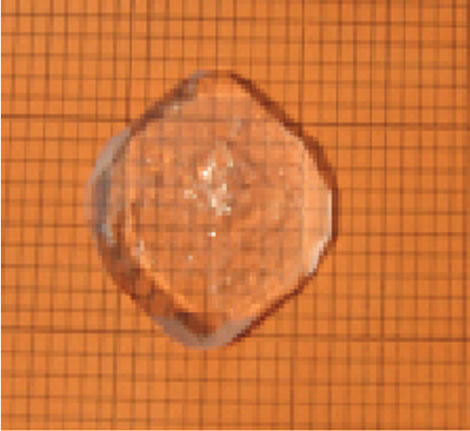
The solution was transferred to a big tray and allowed to rapid evaporation. Within 7 days 80% of the solvent was evaporated and the synthesized TGS crystals were collected. The crystallized salt was again dissolved in triple distilled water and re-crystallized. This was repeated three times to improve the purity of the material. The saturated solution of TGS was filtered and allowed to crystallize by slow evaporation process. Tiny seed crystals with good transparency were obtained within 5 to 7 days. Among them, defect free seed crystals were collected. To obtain potassium bromide doped TGS, 0.5 mole% and 1 mole% potassium (KBr) was added separately to the solution of TGS. Growth of undoped and KBr doped TGS crystals were carried out by natural evaporation technique at room temperature. The re-crystallized salts of undoped and KBr doped TGS were used to prepare the saturated solution separately. The solutions were constantly stirred for about 5 hours using a magnetic stirrer and were filtered using 4 micro Whatman filter papers. Then the filtered solutions were kept in glass beakers covered with porous paper and the seed crystals were suspended into the solution by nylon thread. The grown crystals were harvested after a period of 30 days. Full faced, transparent, colourless crystals were obtained. The grown crystals are shown in (Figure 1" target="_self">Figure 1). The doped crystals grow much faster in comparison to the pure crystals. It is also observed that the doped crystals are platy shaped which is suitable for using optical devices. This is due to adsorption of impurity onto the surface of the crystals during the growth [16].
3. Results and Discussion
3.1. Energy Dispersive X-Ray Analysis
The EDX spectrum of undoped and KBr doped TGS are shown in Figure 2" target="_self">Figure 2. The chemical compositions of the
 (a)
(a)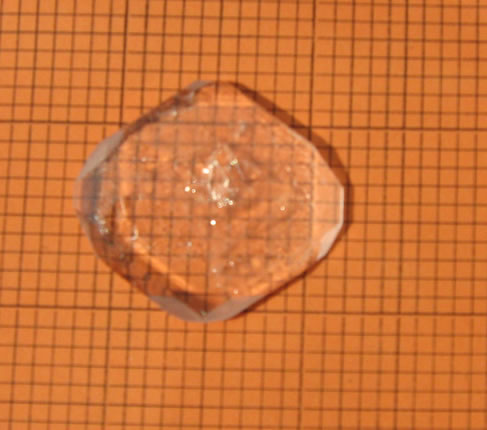 (b)
(b)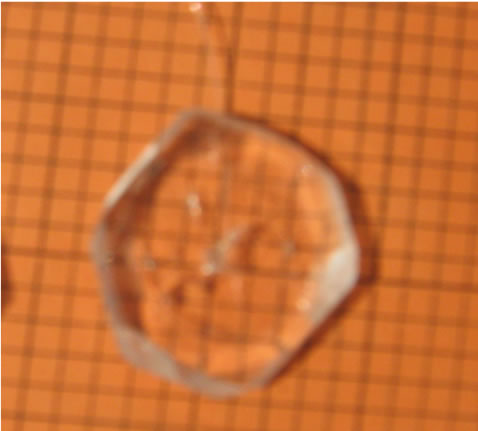 (c)
(c)
Figure1" target="_self">Figure1. (a) pure tgs, (b) 0.5 mole% kbr doped tgs and (c) 1 mole% kbr doped tgs crystal.
crystals were analyzed. The atomic and weight percentage of elements present in the crystal is shown in Table 1. From the EDX analysis it is found that the doped crystals adsorbed KBr as K+ and Br– ions.
3.2. Fourier Transform Infrared Spectroscopy Studies
The spectrum of undoped TGS and KBr doped TGS are shown in Figure 3" target="_self">Figure 3. The pure TGS crystal shows a broad and strong absorption band in the range 2380 - 3800 cm–1 for the O-H stretching of hydrogen bounded carboxyl groups and the N-H stretching NH3+ group. The C=O stretching vibration of carboxyl group appears as a sharp band at 1685 cm–1. The C-H bending vibrations appear at 1493.93 cm–1. The N-H bending vibrations are present at
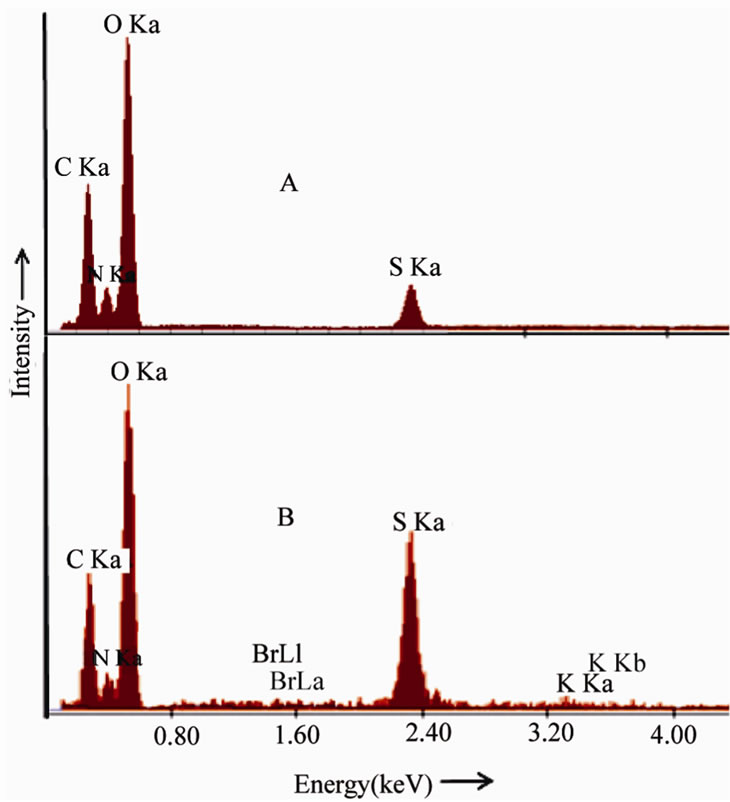
Figure. 2 EDX spectra of (A) Pure TGS (B) 1 mole% KBr doped TGS crystals.
1408.10 cm–1. The asymmetric S=O stretching frequencies can be assigned to frequency 1309 cm–1. A strong band at 1118.76 cm–1 arises from C-O stretching. The transitional oscillation of NH+3 groups appears at 619, 572.8 and 501.5 cm–1. All the observations clearly confirm the presence of the functional groups in the grown crystals, which is in good agreement with the reported values [17]. The FTIR spectra of 0.5 mole% and 1 mole% KBr doped TGS are shown in Figure 3" target="_self">Figure 3, although it provides similar feature as that of undoped TGS spectrum. The FTIR spectrum of pure TGS shows a broad envelope between 2380 - 3800 cm–1 which is shifted and peak becomes broader in KBr doped TGS crystals. For 1 mole% KBr doped TGS each peak in the finger print region is characterized by the absorption of fine structure which is not observed either in pure or in 0.5 mole% KBr doped TGS crystals. In addition the overtone bands are resolved for 0.5 mole% and 1 mole% KBr doped TGS spectrum which is present in the pure TGS at 2350 cm–1.
3.3. Powder X-Ray Diffraction Analysis
The grown crystals were subjected to powder X-ray diffraction analysis to find the crystal structure. Powder X-ray diffraction pattern of pure and doped TGS crystals are shown in Figure 4. The lattice parameters were calculated and presented in Table 2. From the data, it is observed that undoped and KBr doped TGS crystals crys tallize in monoclinic system. The lattice parameters for
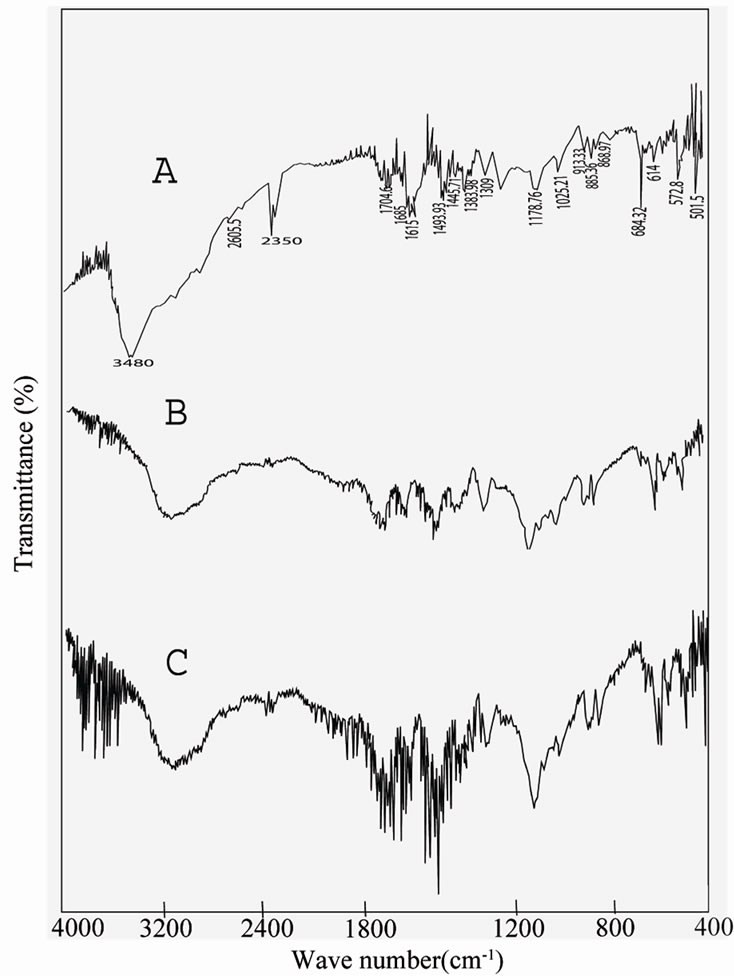
Figure 3" target="_self">Figure 3. FTIR Spectra (A) pure TGS (B) 0.5 mole% KBr doped TGS and (C) 1 mole% KBr doped TGS Crystal.
the undoped TGS crystals are found to be in good agreement with the reported literature [18]. It is observed that the lattice parameters are slightly increased when TGS is doped with KBr and also increased with dopant concentrations. The rate of adsorption of KBr impurities may be increased with the rate of deposition of growth entities that increases the lattice parameter values. For higher concentration, the higher amount of impurities may be adsorbed at the surface terrace.
3.4. Transmission Spectral Analysis
The optical transmission spectral analysis of the grown crystals was carried out between 190 to 1100 nm. For optical fabrications, the crystal should be highly transparent in the considerable region of wavelength [19,20]. The good transmission of the crystal in the entire visible region suggests its suitability for second harmonic generation devices [21,22]. From the transmittance spectra (Figure 5), it is noticed that undoped TGS crystal has a transmittance of more than 84.26% in the visible region. KBr doped TGS crystal has lower transmission percentage compared to undoped TGS crystal and the transmit tance decreased with the increase in molar concentration of KBr. A strong absorption is observed at 230 nm for
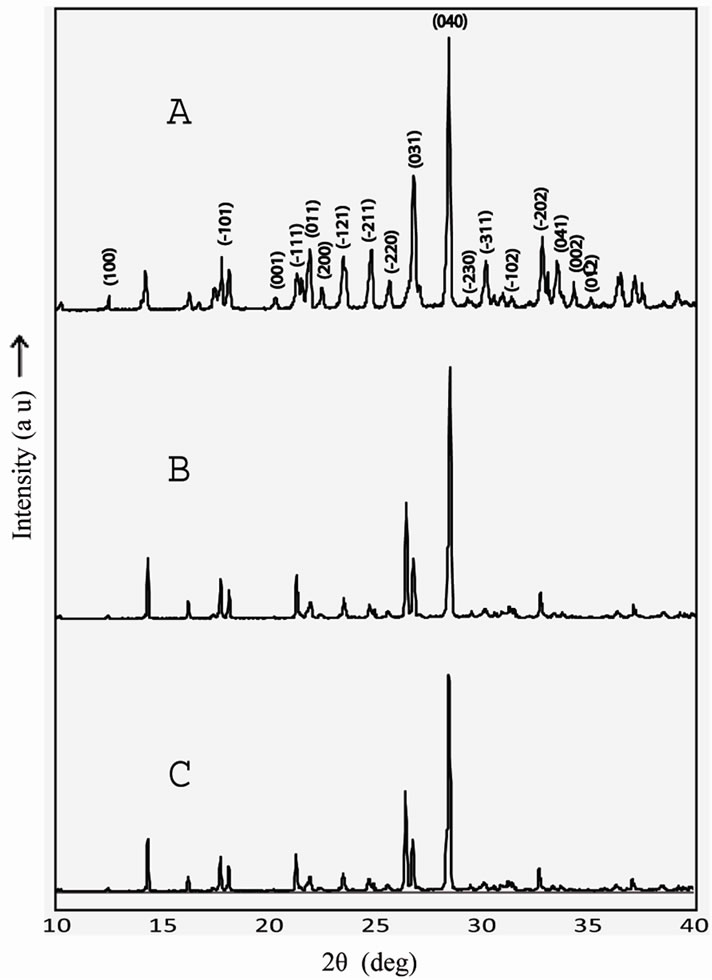
Figure 4. X-ray powder diffraction pattern for (A) pure TGS (B) 0.5 mole% KBr doped TGS and (C) 1 mole% KBr doped TGS crystal.
pure TGS crystal and this corresponds to the fundamental absorption and UV cut off wavelength. Using the formula
 (2)
(2)
the band gap is calculated to be 5.404 eV which is in good agreement with the reported data in the literature [23]. From the results, it is observed that the transmittance for the KBr doped crystal decreases and hence absorbance increases in the entire UV-visible region of the spectra in compared to spectrum of pure TGS crystal. From the results it seems that the cut-off wavelength for undoped and KBr doped TGS crystals remain same.
3.5. Vickers Micro hardness
In the case of pure TGS crystals, the hardness number increases with increase in the load up to 50 g (Figure 6). For loads above 50 g, cracks started to develop and the indentation mark. It is due to the release of internal stress generated locally by indentation. For 0.5 mole% KBr doped TGS crystal, hardness is more than that of pure TGS crystal at all load up to 50 g. But for 1 mole% KBr doped TGS crystal, the hardness is high at lower loads and then it decreases with the increase of load. This is may be result of loosely packed lattice with reduced bond energy due to the introduction of KBr into the matrix of TGS crystals.
4. Conclusions
TGS salts were synthesized and good quality, well facedand transparent pure TGS and KBr doped TGS crystals have been successfully grown from aqueous solution by slow evaporation technique. The grown undoped and
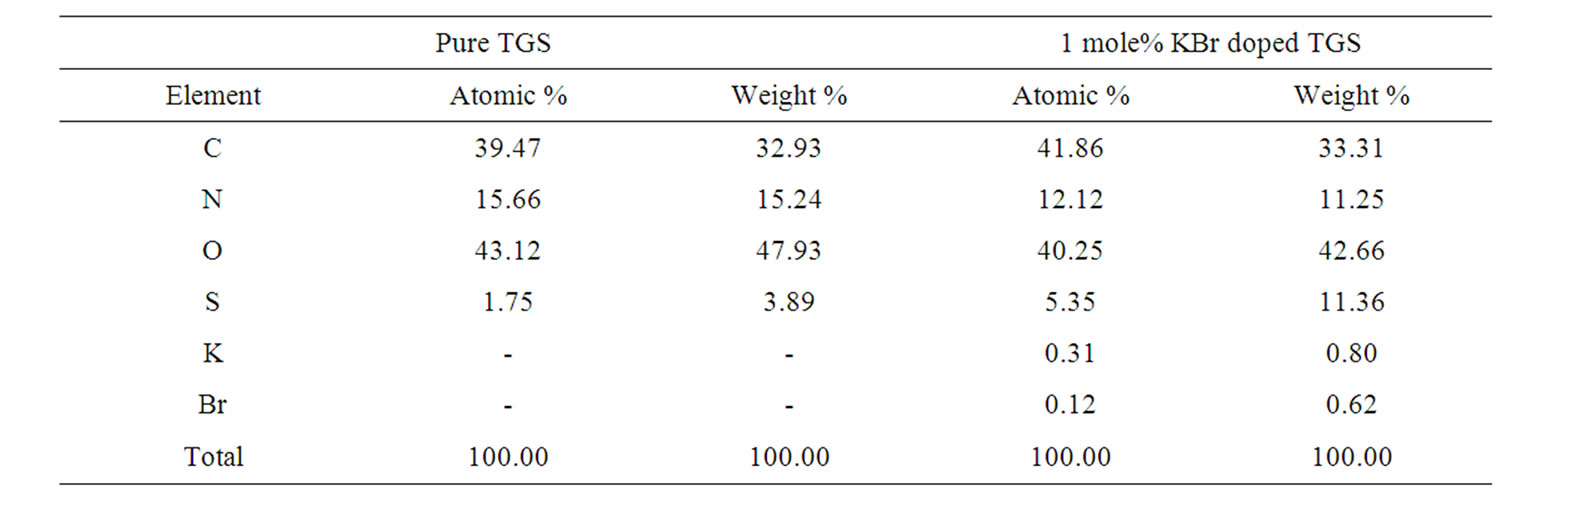
Table 1. Data for atomic and weight percentage of the elements.
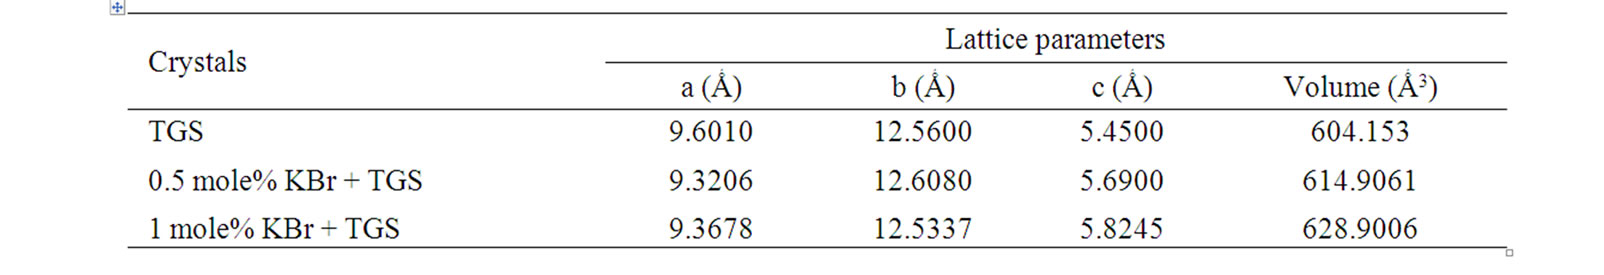
Table 2. Lattice Parameters of pure and doped TGS crystals.
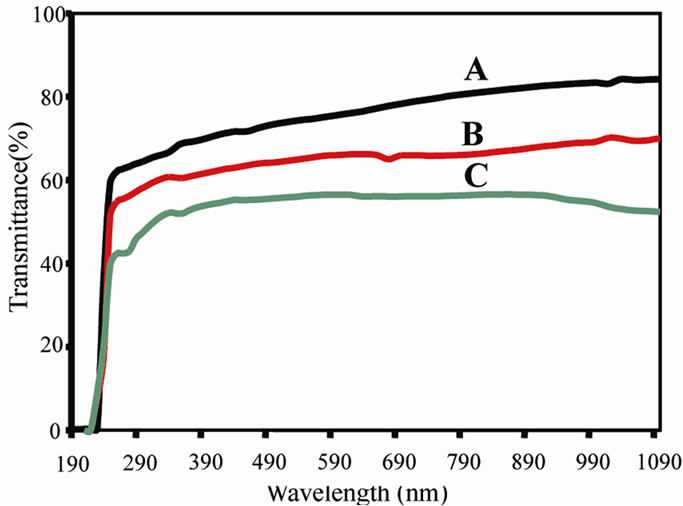
Figure 5. UV-Visible transmittance spectra for (A) Pure TGS (B) TGS + 0.5 mole% of KBr (C) TGS + 1 mole% of KBr doped TGS crystals.
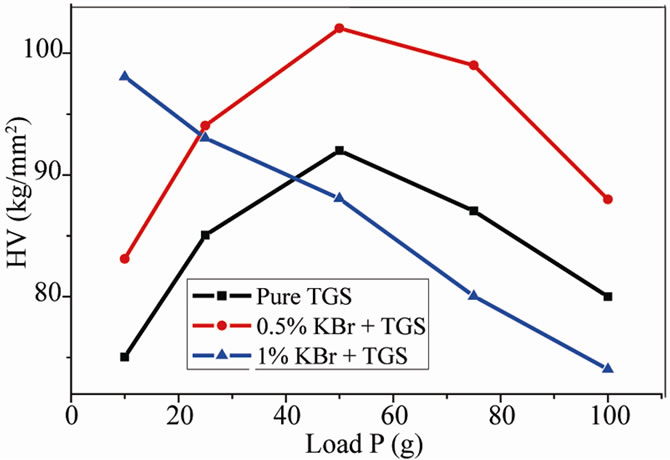
Figure 6. Variation of load versus Vicker’s micro hardness number (HV).
KBr doped TGS crystals are observed colourless. EDX study confirms the presence of potassium and bromine ions into the lattice of doped TGS crystals. FTIR spectra confirmed the presence of the dopant qualitatively. XRD studies reveal the monoclinic structure of the grown crystals. Transmission study shows that the as grown crystal is highly transparent (84.26%) in the entire visible region which may be a suitable candidate for optical devices.
5. Acknowledgements
The authors are grateful to Dr. Abdul Gafur, Senior Engineer, BCSIR Laboratory, Dhaka for UV spectroscopy and micro hardness measurements and Dr. Dilip Kumar Saha, Chief Scientific Officer, AECD for helping XRD measurements.
References
[1] K. B. Ashok, D. A. Mohan and B. L. Ravindra, “Growth and Characterization of Doped DTGS Crystals for Infrared Sensing Devices,” Materials Letters, Vol. 57, No. 24-25, 2003, pp. 3943-3948. doi:10.1016/S0167-577X(03)00244-1
[2] C. Berbacaru, H. V. Alexandru, L. Pintilie, A. Dutu, B. Logofatu and R. C. Radulescu, “Doped Versus Pure TGS Crystals,” Materials Science and Engineering, Vol. 118, No. 1-3, 2005, pp. 141-146. doi:10.1016/j.mseb.2004.12.069
[3] E. A. Wood and A. N. Holder, “Monoclinic Glycine Sulfate: Crystallographic Data,” Acta Crystallographica, Vol. 10, 1957, pp. 145-146. doi:10.1016/j.mseb.2004.12.069
[4] G. Hofmann, N. Neumann and H. Budzier, “Pyi12: Pyroelectric Single-Element Detectors and Arrays Based on Modified TGS,” Ferroelectrics, Vol. 133, 1992, pp. 41- 45. doi:10.1080/00150199208217975
[5 V. N. Shut, I. F. Kashevich and S. R. Syrtsov, “Ferroelectric Properties of Triglycine Sulfate Crystals with a Non-uniformdistribution of Chromium Impurities,” Physics of the Solid State, Vol. 50, 2008, pp. 118-121. doi:10.1134/S1063783408010216
[6] P. Selvarejan, A. T. H. Sivadhas, T. H. Freeda and C. K. Mahadevan, “Growth XRD and Dielectric Properties of Triglycine Sulfo-Phosphate (TGSP) Crystals Added with Magnesium Sulfate,” Physica B, Vol. 403, No. 23-24, 2008, pp. 4205-4208. doi:10.1134/S1063783408010216
[7] X. Sun, M. Wang, Q. W. Pan, Shiw and C. S. Fang, “Study on the Growth and Properties of Guanidine Doped Triglycine Sulfate Crystal,” Crystal Research and Technology, Vol. 34, 1999, pp. 1251-1254. doi:10.1002/(SICI)1521-4079(199912)34:10<1251::AID-CRAT1251>3.0.CO;2-G
[8] R. B. Lal and A. K. Batra, “Growth and Properties of Triglycine Sulfate (TGS) Crystals: Review,” Ferroelectrics, Vol. 142, 1993, pp. 51-82. doi:10.1080/00150199308237884
[9] K. Biedzycki, “Energy Distribution of Electron Emission from L-Alanine Doped TGS Single Crystals,” Solid State Communications, Vol. 118, No. 3, 2001, pp. 141- 144.
[10] S. Genbo, H. Youping, Y. Hongshi, S. Zikong and E. Qingin, “A New Pyroelectric Crystal Lysine-Doped TGS (LLTGS),” Journal of Crystal Growth, Vol. 209, No. 1, 2000, pp. 220-222. doi:10.1080/00150199308237884
[11] S. Aravazhi, R. Jayavel and C. Subramanian, “Growth and Characterization of HBenzophenone and Urea Doped Triglycine Sulphate Crystals,” Ferroelectrics, Vol. 200, No. 1-4, 1997, pp. 279-286. doi:10.1080/00150199708008612
[12] M. A. Gaffar and A. A. Al-Fadl, “Effect of Doping and Irradiation on Optical Parameters of Triglycine Sulphate Single Crystals,” Crystal Research and Technology, Vol. 34, No. 7, 1999, pp. 915-923. doi:10.1002/(SICI)1521-4079(199908)34:7<915::AID-CRAT915>3.0.CO;2-W
[13] K. L. Bye, P. W. Whipps and E. T. Keve, “High Internal Bias Fields in TGS (L-Alanine),” Ferroelectrics, Vol. 4, 1972, pp. 253-256. doi:10.1080/00150197308235767
[14] L. Prokopova, J. Novotny, Z. Micka and V. Malina, “Growth of Triglycine Sulphate Single Crystal Doped by Cobalt (II) Phosphate,” Crystal Research and Technology, Vol. 36, No. 11, 2001, pp. 1189-1195. doi:10.1002/1521-4079(200111)36:11<1189::AID-CRAT1189>3.0.CO;2-3
[15] R. Muralidharan, R. Mohankumar, P. M. Ushasree, R. Jayavel and P. Ramasamy, “Growth and Characterization of Zinc Thiourea,” Journal of Crystal Growth, Vol. 234, 2002, pp. 545-550. doi:10.1016/S0022-0248(01)01723-7
[16] M. A. Gaffar, A. A. El-Fadl and S. A. Monsour, “Ferroelectric Behaviour of Triglycine Sulphate Crystals Containing Low Concentrations of Metal Ions near the Transition Temperature,” Journal of Physics D: Applied Physics, Vol. 22, No. 2, 1989, pp. 327-336. doi:10.1088/0022-3727/22/2/016
[17] C. M. Ragahvan, R. Sankar, R. Mohankumar and R. Jayavel, “Effect of Amino Acid Doping on The Growth and Ferroelectric Properties of Triglycine Sulphate Single Crystals,” Materials Research Bulletin, Vol. 43, No. 2, 2008, pp. 305-311. doi:10.1016/j.materresbull.2007.03.011
[18] A. Saxena, V. Gupta and K. Sreenivas, “Characterization of Phosphoric Acid Doped TGS Single Crystals,” Journal of Crystal Growth, Vol. 263, No. 1-4, 2004, pp. 192-202. doi:10.1016/j.jcrysgro.2003.10.083
[19] V. Krishnakumar and R. Nagalakshmi, “Crystal Growth and Vibrational Spectroscopic Studies of the Semiorganic Non-linear Optical Crystal-Bisthiourea Zinc Chloride,” Spectrochimica Acta Part A, Vol. 61, No. 3, 2005, pp. 499-507. doi:10.1016/j.jcrysgro.2003.10.083
[20] V. Krishnakumar and R. J. Xavier, “FT Raman and FTIR Spectral Studies of 3-Mercapto-1,2,4-Triazole,” Spectrochimica Acta Part A, Vol. 60, No. 3, 2004, pp. 709- 714. doi:10.1016/S1386-1425(03)00281-6
[21] S. A. Roshan, S. C. Joseph and M. A. Ittyachen, “Growth and Characterization of a New Metal-Organic Crystal: Potassium Thiourea Bromide,” Matt’s letter, Vol. 49, 2001, pp. 299-302. doi:10.1016/S0167-577X(00)00388-8
[22] V. Venkataramanan, S. Maheswaran, J. N. Sherwood and H. L. Bhat, “Crystal Growth and Physical Characterization of the Semiorganic Bis (Thiourea) Cadmium Chloride,” Journal of Crystal Growth, Vol. 179, No. 3-4, 1997, pp. 605-610. doi:10.1016/S0022-0248(97)00137-1
[23] M. S. Pandian, N. Balamurugan, V. Ganesh, P. V. Rajashekar, K. K. Rao and P. Ramasamy, “Growth of TGS Single Crystal by Conventional and SR Method and Its Analysis on the Basis Of Mechanical, Thermal, Optical and Etching Studies,” Matt’s Letter, Vol. 62, No. 23, 2008, pp. 3830-3832.