Journal of Analytical Sciences, Methods and Instrumentation
Vol.4 No.2(2014), Article
ID:47296,9
pages
DOI:10.4236/jasmi.2014.42008
Modeling and Experiments of the Gain and Noise Figure for an Irradiated Erbium-Ytterbium Co-Doped Fiber Amplifier
Sherif S. Nafee1,2, Taymour A. Hamdalla2,3
1Department of Physics, Faculty of Science, King Abdulaziz University, Jeddah, KSA
2Department of Physics, Faculty of Science, Alexandria University, Alexandria, Egypt
3Department of Physics, Faculty of Science, Tabuk University, Tabuk, KSA
Email: snafee@kau.edu.sa, sherif.nafee@sci.alex.edu.eg
Copyright © 2014 by authors and Scientific Research Publishing Inc.
This work is licensed under the Creative Commons Attribution International License (CC BY).
http://creativecommons.org/licenses/by/4.0/


Received 18 March 2014; revised 22 April 2014; accepted 8 May 2014
ABSTRACT
It is crucial to study the effect of radiation on the fiber amplifier devices. In the present paper, the Erbium-ytterbium co-doped fiber amplifier (EYDFA) has been irradiated by a neutron beam of different doses for various exposure times from an Am-241/Be-9 neutron source. The gain and noise figure of the EYDFA have been calculated theoretically and recorded after and before the irradiation to test its performance under the effect of irradiation. In order to show the enhancement in the gain of the fiber amplifier devices, a comparison between the gain of the irradiated EYDFA and Erbium doped Fiber amplifier (EDFA) has been carried out. The calculated results by the proposed model are in good agreement with the experimental ones. It indicates that the gain of EYDFA deteriorates after being irradiated by a neutron dose. Moreover, the gain of irradiated EYDFA has been reduced to 13.8 dB at a dose of 720 Gy.
Keywords:Erbium-Ytterbium Co-Doped Fiber Amplifier, Americium/Beryllium-Neutron Source, Gain Deterioration

1. Introduction
Erbium doped fiber amplifiers (EDFAs) are well suited for long haul systems, however they are still too bulky and costly to be used in local areas [1] . In these amplifiers, a concentration of Erbium (Er) exceeding 1026 ion/m3 is needed. Unfortunately, such high concentration may cause concentration quenching resulting from ion-ion interactions by cooperative up conversion and cross relation, which may reduce the pump efficiency [2] .
On other hand the ion-ion interactions which causes pair-induced up-conversion depletes the erbium meta stable level. It lowers the pump efficiency for concentration above few hundred parts per million of Er [3] . This issue has been addressed by co-doping the Er fiber by ytterbium (Yb). The presence of Yb reduces the formation of Er clusters and reduces the up-conversion rate from the upper level of Er (4I13/2 level) significantly. This allows high erbium doping level needed for high gain amplifier. Moreover, an efficient indirect pumping mechanism of Er ions is provided by an energy transfer from Yb to Er [4] .
In the EYDF system, the ytterbium ions are first pumped at the absorption wavelength of 800 - 1100 nm to the 2F5/2 state. The energy of the Yb ions is then transferred to the erbium ions, which are excited to the 4I11/2 state. These excited Er ions undergo a nonradioactive transition to the 4I13/2 meta stable state and form a population inversion with the 4I15/2. An incident optical signal travelling through the fiber is amplified via stimulated emission between these two states [5] .
Many researchers addressed the deterioration of the gain of the optical amplifiers that carried out by natural radiation [6] [7] . Nuclear radiations may produce similar defects in the optical fiber as well as the optical amplifier [8] -[12] . Therefore, the exposure of the optical amplifier to the ionizing radiation may result in a change of the refractive index along the whole fiber [13] [14] .
In the present paper, we will study the effect of irradiating the EYDFA to a neutron beam of 4.5 MeV mean energy on its refractive index. A theoretical modeling for the gain and the noise figure will be reported here. The calculated gain of the EYDFA will be compared to the measured one. Moreover, it will be compared to the reported one for a single doped fiber amplifier EDFA for low neutron dose irradiation in [5] .
2. Experimental Setup
The EYDFA is pumped by a pump laser diode (wavelength 980 nm). The input power is varied from -40 dB to 5 dB. The pump light and signal light are launched into the inputs of a wavelength division multiplexing (WDM) coupler as shown in Figure 1. The EYDFA is exposed to a neutron beam emitted from a 5 Ci Americium/ Beryllium (Am-241/Be-9) neutron source for different exposure times 1, 10, 20, and 30 days. The neutron source was calibrated by Amersham Ind., UK on 1987. The neutron spectrum in Figure 2 indicates that Am-241/Be-9 neutron energies range from about 2 MeV to 10 MeV and that approximately 23% of neutrons are of energies below 1 MeV [6] . The average neutron energy was taken to be 4.5 MeV from the spectrum in Figure 2 as in [7] . The characteristics and the composition of the Am-241/Be-9 neutron source are listed in Table1
Fine powder of AmO2 is mechanically mixed with powdered Be (initial cluster size of 50 pmm) and compressed into cylindrical pellet (density 1.3 g/cm3). The source is embedded in a Plexiglas and Lucite: C5H8O2; density = 1.18 g/cm3; A = 100.117 [10] .
The measurements were carried out at the nuclear radiation laboratory at the physics department, King Abdulaziz University, Jeddah, Saudi Arabia. The EYDFA was positioned at 5 cm from the center of the neutron source. The emitted gamma rays from the neutron source has been shielded by 10 cm thickness lead bricks surrounded the source from all sides [10] . The container, the shielded well inside which the Am-Be neutron source is placed and are shown in Figure 3.
The neutron doses from the source were measured by a neutron monitor (Nuclear Enterprise, UK NM2) to be 24, 240, 480 and 720 Gy, respectively. This monitor was provided by the Radiation Safety Committee in King Abdulaziz University.
3. Mathematical Modeling
Er and Yb co-doped fibers acts as a four level laser system. The energy level schemes for these two ions along with the possible transitions are shown in Figure 4. The transitions involve both radiative and non-radiative energy transfer processes [3] . The rate equations for Er and Yb population densities can be written as [8] [9] :
 (1)
(1)
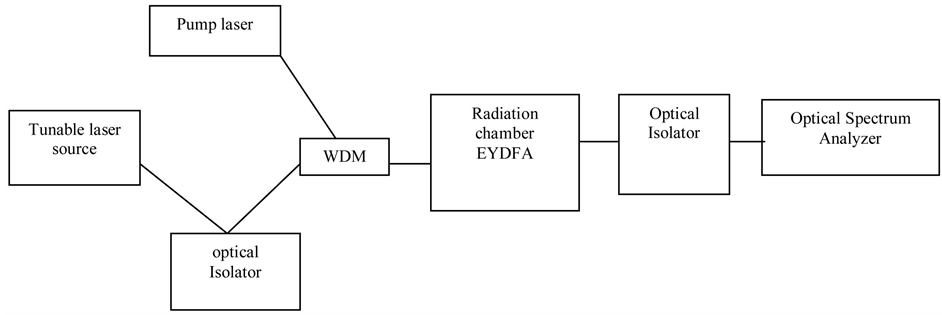
Figure 1. A schematic diagram for EYDFA irradiation experimental setup.
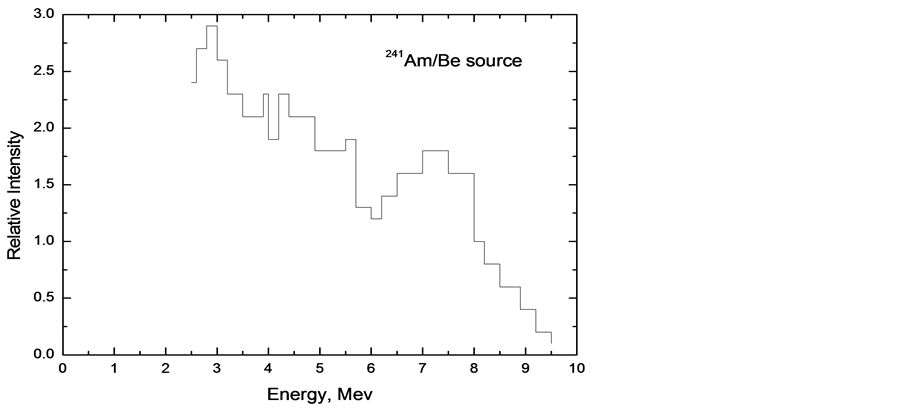

Table 1. Characteristics and composition of the Am-241/Be-9 neutron source.
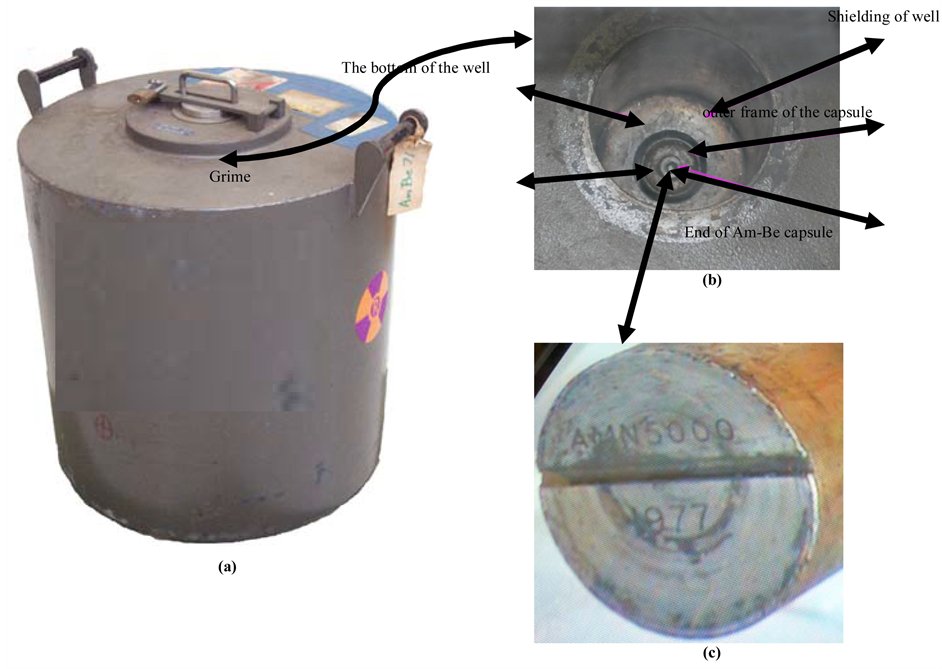
Figure 3. Am/Be neutron source. (a) The transport container, (b) The shielded well inside which the Am-Be neutron source is placed, and (c) close picture for the circular face of the Am/Be neutron source.
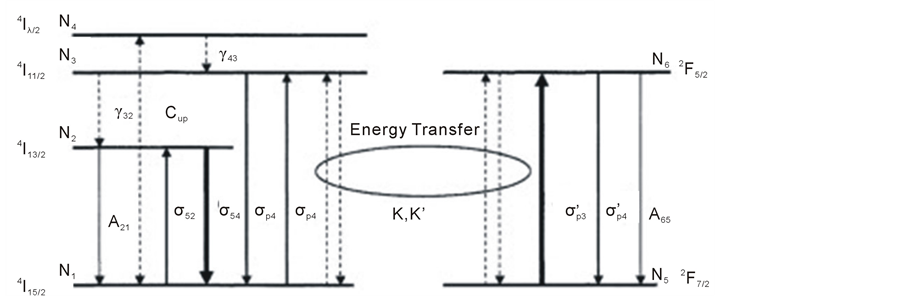
Figure 4. Energy level diagram of Er and Yb system. The dashed lines represent the nonradiative transition, whereas, the solid lines are for the radiative transitions.
 (2)
(2)
 (3)
(3)
 (4)
(4)
 (5)
(5)
 (6)
(6)
where, N1, N2, N3 and N4 are the Er3 population densities (m−3) of 4I15/2, 4I13/2, 4I11/2, 4I9/2 levels, respectively. The quantities N5, N6 are the Yb3 population densities (m−3) of the 2F7/2 and 2F5/2 levels respectively. Whereas, φP, φs,  ,
,  ,
,  ,
,  , A21, A65, K, K', Cup are defined in Table2 The spontaneous emission rates of Er+3 and Yb+3 can be calculated by:
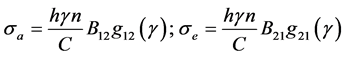 (7)
(7)
where, g12 (γ) and g21(γ) are the normalized emission and absorption line shape respectively, n is the refractive index of the medium and B12 and B21 are the coefficients of transition strength from Level 1 to Level 2 and from Level 2 to Level 1, respectively. Then the signal gain G is given by
 (8)
(8)
where g(z) is the gain for Er+3 transition per unit length.
 (9)
(9)
The total noise figure NF is
 (10)
(10)
where, γ is the signal frequency, Bo is the noise bandwidth, PASE and PSSE are the power of amplified spontaneous emission, and the power of source spontaneous emission, respectively. Table 3 lists the values for the ion concentrations and absorption cross sections for Er+3 and Yb+3 that have been used in the present model.
Table 2. Parameter definition for Equations (1 to 6).
4. Results and Discussion
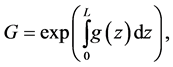
Figure 5 shows the variation of the neutron doses (Gy) as a function of the exposure time (days) from an Am-241/Be-9 neutron source at a distance 5 cm from the center of the source. The performance of the EYDFA has been tested before exposure to the neutron irradiation. Figure 6 shows a comparison between the gain of the suggested co-doped fiber amplifier EYDFA as a function of the input power (mW) with that of the regular fiber amplifier EDFA which has been reported in [5] . The solid line represents the experimental data, whereas, the symbols are for the present calculations for the wavelength in nm. Figure 6 shows also the variation of the Noise Figure (NF) for all the wavelengths before the irradiation using equation (10). At wavelength 1530, the gain of the EYDFA is maximum at 17 dB and NF is 4 dB for an input power of the 130 mW. These satisfy the tested results of the product before it is used commercially. It is clear that the gain of the EYDFA higher than that of the EDFA by a value of 1.4 dB.
To compare the performance of the reported fiber amplifier EDFA with that of the suggested co-doped fiber amplifier EYDFA under the effect of neutron irradiation, Figure 7 shows the variation of the signal gain G with the pump power (mW) for the EDFA and EYDFA after exposure to different doses 24, 240, 480 and 720 GY.
The Results in Figure 7 show that the EYDFA has a higher signal gain than that of the EDFA. Meanwhile, the irradiation with neutron doses deteriorates the gain of the amplifiers. Figure 8 shows the deterioration percentage in the signal gain for the EDFA and EYDFA fiber amplifiers as a function of the neutron irradiation doses at a pump power 120 mW. Results show that the deterioration percentage in the gain of the EYDFA amplifier is less than that of the EDFA amplifier. It shows also, that the higher the irradiation doses, the higher the deterioration percentages. As a results of the gain drop, the NF increases significantly by values of 21.9 dB for EYDFA at 720 Gy.
5. Conclusion
The performance of the Erbium-ytterbium co-doped fiber amplifier (EYDFA) has been tested against the Erbium doped fiber amplifier (EDFA) under the effect of neutron irradiation. The signal gain of the EYDFA has been measured and calculated theoretically as presented in this work. Results of the performance testing show that the signal gain for the EYDFA is higher than that of the EDFA. In addition, it show that the higher the irradiation doses, the higher the deterioration in the signal gain. Moreover, we can say that the co-doping technique allows the fiber amplifier to be a radiation resistor. As the deterioration percentage for EYDFA is less than that of the EDFA. In other words, the performance of irradiated EYDFA is better than that of the irradiated EDFA by a value of 1.6 dB.
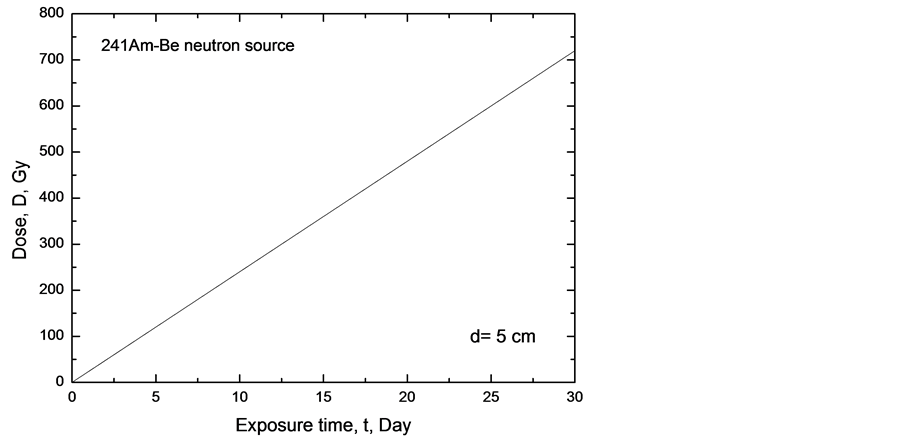
Figure 5. The variation of the neutron doses (GY) of the neutron source with the exposure time (days) at distance 5 cm from the center of the source.
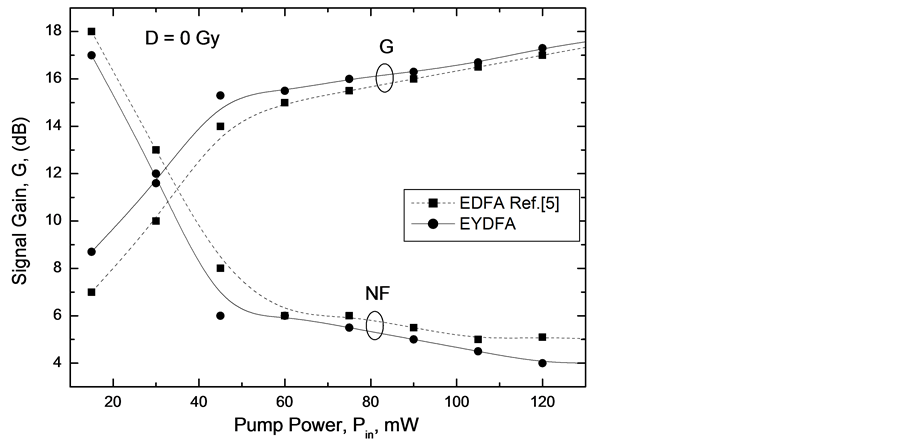
Figure 6. The variation of the signal gain with the input pump power for two amplifiers, EDFA [5] and EYDFA at zero dose, symbols are for the theoretical results whereas, solid lines are experimental data.

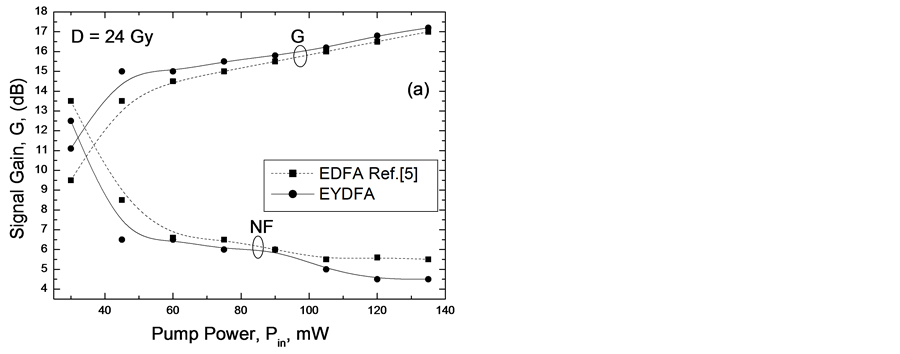


Figure 7. The variation of the signal gain and noise figure with the pump power for EDFA and EYDFA irradiated with doses (a) 24 Gy, ( b) 240 Gy, (c) 480 Gy and (d) 720 Gy, respectively. Circles are for EYDFA and squares are for EDFA.
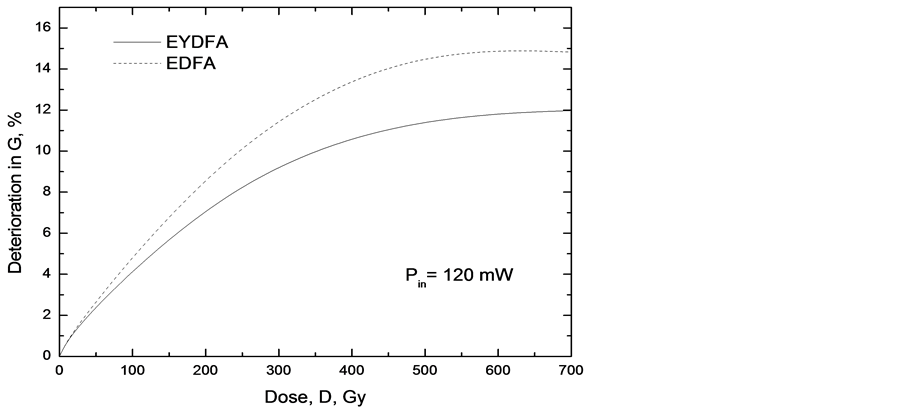
Figure 8. The Gain deterioration percentage as a function of the dose (Gy) for EYDFA and EDFA amplifiers.
Acknowledgements
The authors would like to thank the members of Nuclear Radiation Lab., Physics Department, Faculty of Science, King Abdulaziz University, Jeddah, KSA for their great support.
References
- Desturvire, E. (1994) Erbium Doped Amplifier. John Wiley and Sons, Inc., New York.
- Cheng, Z., Song, F., Zou, C., Su, R. and Jiang, S. (2008) Numerical Investigation of Gain Characteristics of Er/Yb CoDoped Fiber Amplifier. Optical and Quantum Electronics, 40, 1021-1031. http://dx.doi.org/10.1007/s11082-009-9295-0
- Morkel, P., Taylor, E. and Payne, D. (1993) Direct Observation of Cooperative up Conversion Mechanics in EDFA. Presented at ECOC 93, Monteux.
- Abdel hakiem, M., El-Astal, A. and El-Nahal, F. (2011) The Gain and Noise Figure of Yb-Er Co-Doped Fiber Amplifiers Based on the Temperature-Dependent Model. Optical Materials, 33, 543-548.
- Hamdalla, T. and Nafee, S. (2013) Experimental and Theoretical Studies for the Gain of the Neutron Irradiated Erbium Doped Fiber Amplifier. Current Applied Physics, 13, 981-984. http://dx.doi.org/10.1016/j.cap.2013.01.043
- Harun, S., Abdul-Rashid, H., Yassin, S., Rahamn, M. and Ahmad, H. (2008) 37.2 dB Small Signal Gain from Er/Yb Co-Doped Fiber Amplifier with 20 mW Pump Power. Optics Laser Technology, 40, 88-91. http://dx.doi.org/10.1016/j.optlastec.2007.03.010
- Hamdalla, T. and Nafee, S. (2014) Radiation Effects on the Gain of Thulium Doped Fiber Amplifier: Experiment and Modeling. Optics Laser Technology, 55, 46-49.
- Di Pasquale, F. and Federighi, M. (1994) Improved Gain Characteristics in High Concentration Er3+/Yb3+ Codoped Glass Waveguide Amplifies. IEEE Journal of Quantum Electronics, 30, 2127-2131. http://dx.doi.org/10.1109/3.309873
- Berkedmir, C. and Ozsoy, S. (2008) Numerical Analysis of the Signal Gain and Noise Figure of Yb3/Er3 Doped Fiber Amplifier at Different Pumping Power Configurations. Optical Materials, 31, 229-232. http://dx.doi.org/10.1016/j.optmat.2008.03.016
- Amersham (1976) Neutron Sources Americium-241/Beryllium and Californium-252. Technical Bulletin, 76.
- Vitorelli, J.C., Silva, A.X., Crispim, V.R., Da Fonseca, E.S. and Pereira, W.W. (2005) Monte Carlo Simulation of Response Function for a NaI (Tl) Detector for Gamma Rays from 241 Am/Be Source. Applied Radiation and Isotopes, 62, 619-622. http://dx.doi.org/10.1016/j.apradiso.2004.07.010
- Fernandez, A., Gusarov, A., Bodart, B., Lammens, K. and Delchamber, A. (2002) Temperature Monitoring of Nuclear Reactor Cores with Multiplexed Fiber Bragg Grating Sensor. Optical Engineering, 41, 1246-1254. http://dx.doi.org/10.1117/1.1475739
- Fernandez, A., Brichard, B., Berghmans, F. and Decretion, M. (2002) Dose Rate Dependence in Gamma Irradiated in Fiber Bragg Gratings. IEEE Transactions on Nuclear Science, 49, 2874-2878. http://dx.doi.org/10.1109/TNS.2002.805985
- Gusarov, A., Fernandez, A., Vasiliev, F.S., Medvedkov, O., Blondel, M. and Berghmans, F. (2002) Effect of Gamma Neutron Nuclear Reactor on the Properties of Bragg Grating Written in Photosensitive Gr-doped fiber. Nuclear Instruments and Methods in Physics Research Section B, 187, 79-86. http://dx.doi.org/10.1016/S0168-583X(01)00829-1