Journal of Analytical Sciences, Methods and Instrumentation
Vol.2 No.3(2012), Article ID:23281,4 pages DOI:10.4236/jasmi.2012.23022
Computational Modelling of the Hydride Generation Reaction in a Tubular Reactor and Atomization in a Quartz Cell Atomizer
![]()
Department of Chemical and Biological Engineering, The University of Sheffield, Sheffield, UK.
Email: cpp08wsa@sheffield.ac.uk, wameath@yahoo.com
Received May 21st, 2012; revised June 17th, 2012; accepted June 29th, 2012
Keywords: Hydride Generation Process; Tubular Reactor; Quartz Cell Atomizer; Emission Spectroscopy
ABSTRACT
In this study, we present a model whereby the centre of the atomization channel is shown to be the optimal location for the spectrometric data acquisition in a quartz cell atomizer. The study aims to explore the hydride generation technique which is normally coupled with efficient thermal source to apply determination of heavy metals in water samples via spectrometric analysis. The arsenic hydride generation process and the atomization of the generated hydride in a quartz cell atomizer were studied analytically as model case studies. The hydride generation (HG) process was analyzed by adopting two hypotheses, the nascent hydrogen and formation of intermediate hydroboron species, where the results based on the second hypothesis are found to be more realistic for design purposes. Moreover, the release of the generated hydride from the liquid phase and their transport to the gas phase is simulated in a helical tubular section, in which the actual tubular section length required for separation is deduced. The analytical results have been verified experimentally by measuring the signal intensity for the free arsenic atoms against several reaction tube lengths, in which increasing the tubular section length from 12 cm to 100 cm results in signal amelioration by no more than 6.6%. Furthermore, the atomization of the hydride and the distribution of the generated free atoms are deduced in two configurations of tubular quartz atomizers. The results obtained from both studied cases illustrate that a high concentration of the free analyte atoms is generated in the first part of the atomization channel, saturates to a maximum in a position at the atomizer centre, and dissipates at the inside wall of the tubular atomizer before reaching the atomizer outlet edge, which is found to be in total agreement with the current understanding of atomization mechanism in tubular atomizer and emphasizes the fact that the centre of the quartz cell atomizer is the best location for the spectrometric data acquisition.
1. Introduction
The hydride generation (HG) technique coupled with the spectrometric analysis is widely applied for detection and determination of the hydride forming elements (e.g. arsenic, antimony, bismuth, germanium, lead, selenium, tellurium, and tin) and has been applied recently for other group determination including transition and noble metals (e.g. platinum, cobalt, silver, copper, zinc, rhodium, palladium, osmium, chromium, gold, nickel, indium, thallium, and manganese) [1-3]. The working principle of the hydride generation technique relies on the reduction of the element from higher oxidation state to its lowest state (usually II or III), which appears as the volatile species (e.g. hydrides). Precisely speaking, HG technique converts aqueous species of some selected elements to volatile hydrides (As, Sb, Bi, Ge, Sn, Pb, Se, Te) or volatile species (Hg, Cd) or volatile, not yet identified, species (transition and noble metals). In some cases the reduction doesn’t take place; for example inorganic As (III) remains in the same oxidation state passing from H3AsO3 to AsH3. The generated hydrides are transferred with a carrier gas into an atomization cell, where the hydride molecules are dissociated into analyte atoms and atomized in order to be detected by spectrometric analysis. The mechanism of the hydride generation process has been studied thoroughly by different research groups [4-6] proposing different hypotheses and perspectives. The first hypothesis presumes the atomic hydrogen to be the active specie in the derivatization process. The atomic hydrogen which is also referred to as “the nascent hydrogen” is formed during the acidic hydrolysis of a hydroborate compound (e.g. NaBH4). The second hypothesis denies the need for intermediate reactive species and presumes the formation of the hydrides, in a pH range 4.7 to 12.7, occurs due to the action of borohydride compounds (BH4 or X-BH3 where X = Cl, Br, I) on the analyte. On the other hand, the results of another experimental study D’Ulivo et al. [7] showed that the molecular hydrogen and hydroboron species were formed during the hydrolysis of tetrahydroborate, and claimed that the hydrogen bonding to the boron species releases and recombines to form molecular hydrogen. Although the second hypothesis and the experimental evidence have presented solid arguments against the first one, the mechanism of the nascent hydrogen formation is still valid and accepted as a model by several researchers [8,9]. The most important link between the abovementioned hypotheses is: they agree that hydrogen gas is generated as one of the final products of the hydride generation reaction due to decomposition of hydroborate (THB). The decomposition of THB has been referred to be a second order reaction that might be last for few microseconds [1], whereas the generation and transfer of the hydrides from the liquid phase to the gaseous phase were considered to be a first order reaction [10]. On the other hand, the atomization process of the hydride has also been studied by many researchers [11-14] which raised several perspectives about the appropriate consistent mechanism. The general opinion supports the atomization by a thermal decomposition such as the case of electro-thermal atomization in a heated quartz tube. Nonetheless, this theory is found difficult to apply as a general case due to variations in the atomization temperature, which is strongly related to the equipment type. For instance, arsenic atomization is thought to occur at approximately 800˚C in a heated quartz tube, whereas arsenic is reported to atomize at 1700˚C - 1800˚C in a graphite tube furnace. In addition to the thermal decomposition theory, the atomization mechanism is attributed to the effect of free hydrogen radicals and the assistance of oxygen radicals in the atomizer. Generally speaking, the hydrogen radicals are found to be the most effective factor on the atomization process. Moreover, the oxygen radicals are also found to be an important factor, in which the hydride decomposition would occur in the presence of oxygen radicals alone; nevertheless, no atomization could be achieved with temperatures below 1700˚C [13]. Furthermore, the OH radicals which accompany the hydrogen radical formation are reported to play a powerful catalytic role on the hydride generation process. It is worth noting that the recombination of radicals is mentioned to be slower than the onward radical generation; therefore, the number of the hydrogen radicals is always expected to be above the equilibrium value. In practice, one of the most important parameters affecting the performance of such an analytical process is the position used to conduct the spectrometric data acquisition. Nonetheless, no clear guide is available which can show how to decide the optimum location for a fibre optics sensor along the atomization channel and whether an axial or radial data acquisition is optimal for such application. Alternatively, the theoretical investigations are the most practical way to give insight on the system performance even with some deviations in the results. In this sense, we have conducted theoretical investigations related to our work [15] to find the distribution of free arsenic atoms in a dielectric barrier discharge atomizer. For the DBD atomizer studied, the axial viewing at the end of the atomization channel was found the optimal. That result has been verified experimentally, where approximately 40% increase in the signal intensity was obtained upon applying the axial viewing.
The current work, organized in three sections, is dedicated to investigate the generation of the arsenic hydride in tubular reactor and the distribution of the free analyte in two designs of quartz cell atomizers; traditional flame in tube (FIT) atomizer and internally heated quartz tube atomizer (HQTA). In between these two stages, a simulation study is conducted to investigate the effect of adopting a helical tubular section for separating the generated hydrides and the side products from the liquid phase. The findings of the study should indicate the best reaction mechanism and the role of other parameters for the best compromise for design purposes.
2. Study of the Hydride Generation Process in a Tubular Reactor
2.1. Process Description
The hydride generation reaction is investigated in this study by assuming a sample of water contains 0.02 mg/l of arsenic, As (III), with the aim to be converted to arsenic hydride AsH3 upon being reacted with a reducing agent (NaBH4). The reactant streams are assumed to be injected into a tubular reaction section (2.4 mm diameter ) through a T-junction, provided that the reaction tube forms a configuration of helical coil. The inlet streams are assumed to have the following specification on the basis that the feed rate of the reagents (NaBH4 and HCl) to the HG generator is normally applied in a ratio  as reported by Pohl et al. [16].
Stream 1: 2 ml/min H2O aqueous solution contains (0.2 % m/v) sodium tetrahydroborate (THB) stabilized by using (0.1% m/v) NaOH.
Stream 2: 2 ml/min H2O aqueous solution contains 0.02 mg/L As (III) and acidified by using 0.1 (M) HCl.
2.2. Chemical Reaction Mechanisms
2.2.1. Assuming the Evolution of Nascent Hydrogen from the Acidic Hydrolysis of THB
The mechanism of the hydride generation process was represented by the following reaction according to Dedina and Tsalev [1]:
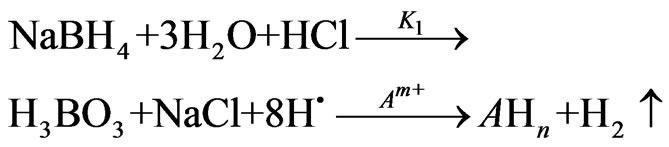 (1)
(1)
where; A: the analyte, m+: the oxidation state of the analyte, n: the coordination number of the hydride, : the nascent hydrogen.
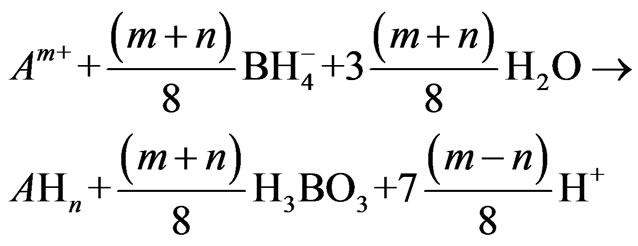
The expected general form of the reaction which leads to the formation of the hydrides was described as follows:
 (2)
(2)
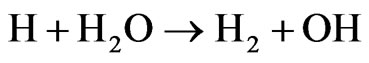
The excess of un-reacted atomic hydrogen was mentioned to form the molecular hydrogen, which is one of the final products of the acidic hydrolysis of tetrahydroborate, as follows [7]:
 (3)
(3)
 (4)
(4)
Another general form was proposed as follows [13, 17]:
 (5)
(5)
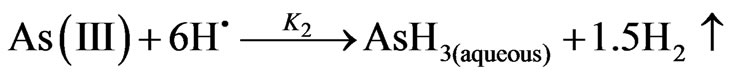
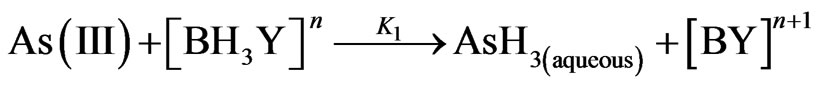
In this part of study, the reaction of arsenic hydride generation is represented by the following equations according to the nascent hydrogen hypothesis, (1st mechanism in the current study), assuming m = 3 and n = 3 and the hydrogen gas is generated directly:
 (6)
(6)
 (7)
(7)
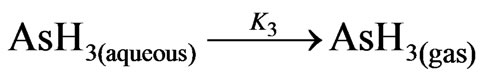 (8)
(8)
where; K1: 2nd order decomposition rate constant = 1.22 ×10⁸ L/mol/min = 2033.3 (m3/mol/sec) [1]; K2: the rate constant of the arsenic hydride formation. According to Van Wagenen et al. [10], the formation of arsenic hydride was found to be a first order reaction with a rate constant equal to 32 (1/sec); K3: 1st order rate constant of arsenic hydride release from the liquid phase, which was estimated equal to 3.5 (1/sec) by Van Wagenen et al. [10] in a three neck round bottom flask hydride generator.
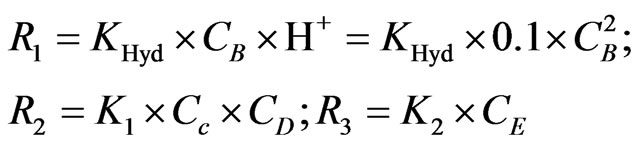
An assumption made that the value and units of the rate constants mentioned above are applicable for the reactions described in the current case study, giving that no changes in the rate constants is expected to occur throughout the reaction series. Moreover, the concentration of (HCL) is considered to be equivalent to 10% of (NaBH4) concentration in the description of hydroborate decomposition rate (R1); this is to obtain the highest As signal to background ratio as demonstrated by Pohl et al. [16]. Thus; the reaction rates, for the current case, are described as follows:
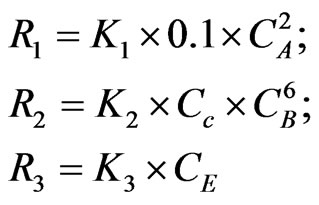
The notations used to describe the species are shown as follows:
A = THB (i.e. NaBH4), B = , C = As (III), D = H2, E = AsH3(aqueous), F = AsH3(gas).
The concentration gradients of the reactants and the products are described as shown in the following equations:
 (9)
(9)
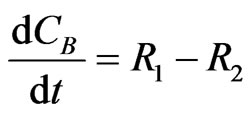 (10)
(10)
 (11)
(11)
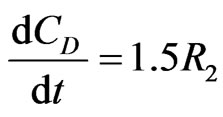 (12)
(12)
 (13)
(13)
 (14)
(14)
In order to find the optimal reactor length, further ordinary differential equations are added to the proposed system, which aims to simulate the velocity and the position required for the optimal conversions, as described by Zimmerman [18]:
 (15)
(15)
 (16)
(16)
where; u = velocity (m/sec), x = position (m), and  = the initial concentration of the hydroborate.
The above system of eight ordinary differential equations has been analyzed using the ordinary differential equation solver (ode 23) in Matlab, which is principally based on the explicit Runge-Kutta method. The initial conditions were applied as follows: (CTHB = 1.347 mol/m3, CAs(III) = 2.66 × 10⁻⁴ mol/m3 , other species = 0 mol/m3 ).
The computations have produced the gradients of species concentration shown in Figure 1, which presents a comparison between the results obtained from the analytical solutions of both hypotheses.
2.2.2. Assuming the Stepwise Decomposition of Hydroborate and Formation of Hydroboron Intermediate Species
Other analytical evidences [8,9,19] supported the hypothesis of forming the hydroboron species with life time longer than the life time of the hydroborate ( ). The borane complex [BH3Y]n , where Y represents neutral or anionic ligand, is hydrolysed in the aqueous phase and catalyzed by acid and eventually decomposes to give molecular hydrogen according to the following reaction path [9]:
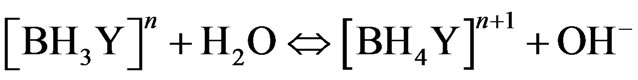 (17)
(17)
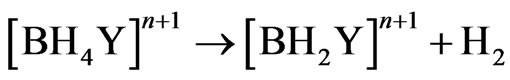 (18)
(18)
The overall hydrolysis rate constant KHyd of THB (second-order reaction) is estimated equal to 1.6 × 10⁶ (L/mol/sec) at 25˚C; where H+ applied in the range (0.2 M - 10 M) [8]. The following reactions are adopted in the current case study to investigate the arsenic hydride generation according to the hydroboron intermediates theory, considering the formation of arsenic hydride occurs due to the reaction of the analyte with the hydrogen atoms that released from the intermediate species,  .
.
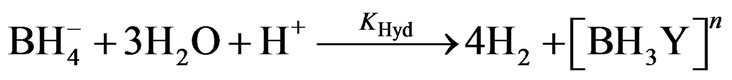 (19)
(19)
 (20)
(20)
 (21)
(21)
where; KHyd = 1.6 × 10⁶ (L/mol/sec) =1600 (m3/mol/sec) and K2 = 3.5 (1/sec). As mentioned previously in Section (2.2.1), the value of (K1 = 32 sec–1) has been utilized to describe the reaction rate by assuming the value and units of K1 are applicable for the current case; moreover, [H+] is assumed equal to 10% of NaBH4 concentration; this is in order to envisage the case where a stable acidity undertaken throughout the reaction series. In light of the hydroboron intermediates hypothesis (2nd mechanism in the current study), the reaction rates contribute in the arsenic hydride production can be approximated according to the following equations:
The notations used for the species are shown as follows:
B = , C =
, C =  , D = As(III), E = AsH3(aqueous)F = AsH3 (gas), G = H2, J =
  .
.
The concentration gradients of the reactants and products are described as follows, where the last two equations are added to estimate the optimal reactor length:
 (22)
(22)
 (23)
(23)
 (24)
(24)
 (25)
(25)
 (26)
(26)
 (27)
(27)
 (28)
(28)
 (29)
(29)
 (30)
(30)
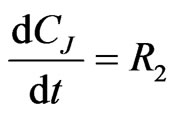
The above system of nine ordinary differential equations was analyzed by using the ordinary differential equation solver (ode 23) in Matlab. The initial conditions were considered to be (CTHB = 1.347 mol/m3, CAs(III) = 2.66 × 10⁻⁴ mol/m3 , other species = 0 mol/m3 ). The results obtained from the analytical solution of the two hypotheses are shown in Figure 1, in which the schemes to the left represent the gradients according to the nascent hydrogen hypothesis whereas the schemes to the right refer to the gradients according to the hydroboron intermediates hypothesis. It can be observed in the schemes shown in Figure 1 that a time slot (0 to 2 seconds) has been selected for the undertaken analysis including all activities. A general overview on the analytic-cal solution shows that the second mechanism reveals that a faster decomposition process occur in comparison with the first mechanism by approximately two orders of magnitude, as presented in Figure 1(a). Since the hydroborate decomposition in both reaction mechanisms was considered to be a second order reaction; therefore the results of both mechanisms have shown a decomposition rate conducted within 0.1 and 0.005 seconds for the first and second mechanism respectively. The results of the second mechanism were found to be in agreement with the data shown in the literature (e.g. 14 × 10–6 second for 0.2 M [H+]) [8].
 (a)
(a) (b)
(b) (c)
(c)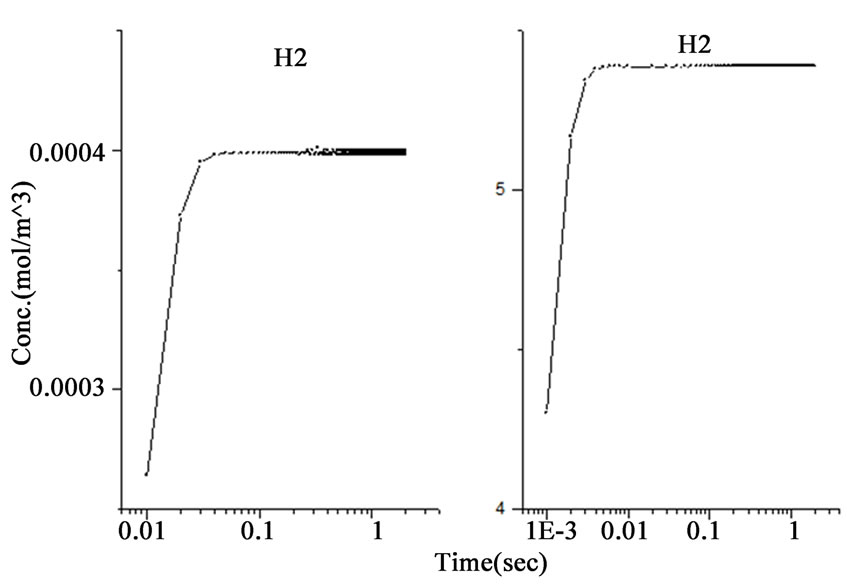 (d)
(d)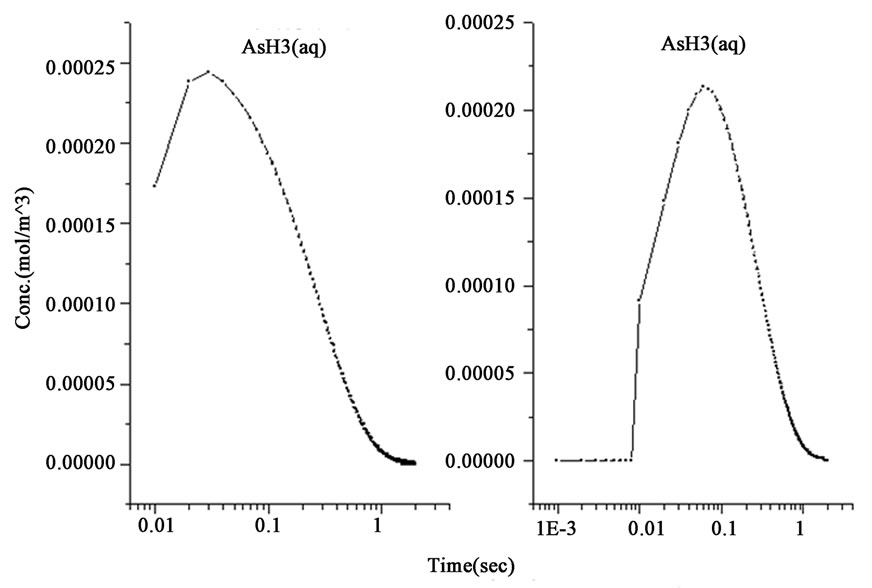 (e)
(e)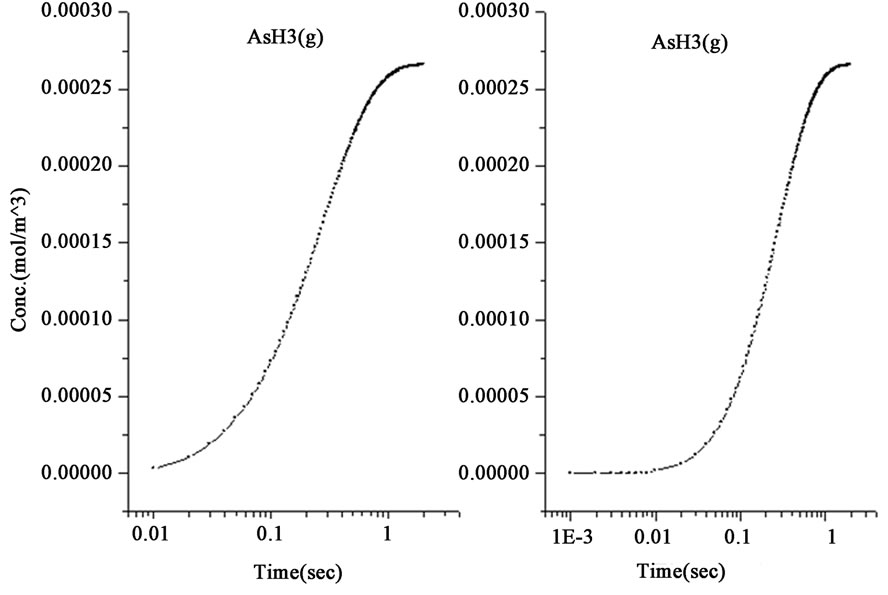 (f)
(f)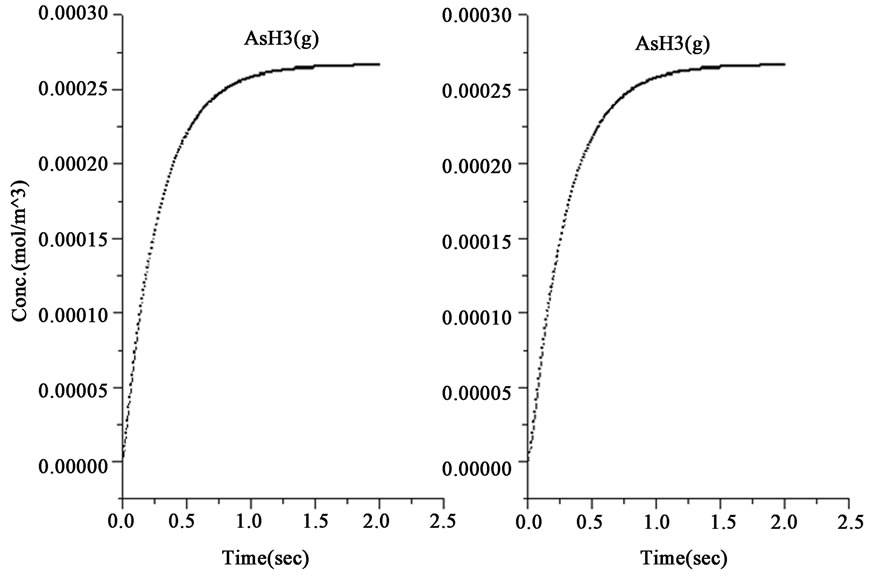 (g)
(g)
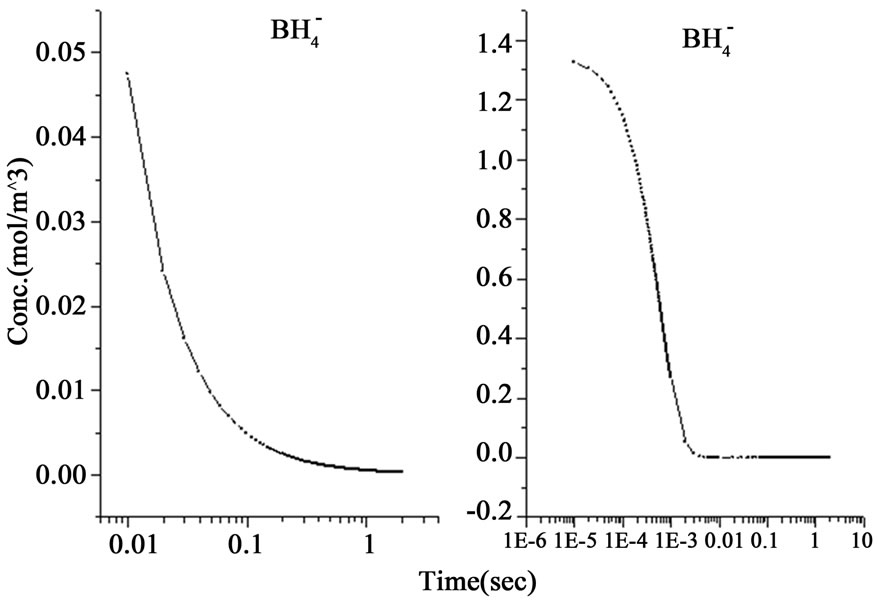
Figure 1. The variations of species concentration with time according to the hypotheses of nascent hydrogen (left side schemes) and the hydroboron intermediates (right side schemes); ((a)-(d)) Schemes illustrate the decomposition of hydroborate, dissipation of the analyte As (III), and formation of the side products and the hydrogen gas respectively, ((e) and (f)) Plots illustrate the formation of the intermediate arsenic hydride (in the aqueous phase) and its release to the gaseous phase (in logarithmic time scale) respectively, (g) Schemes illustrate the formation of the arsenic hydride in the gaseous phase (normal time scale).
The results also show that the intermediate species, represented by the atomic hydrogen in the first mechanism and the intermediate complex  in the second mechanism, saturates to a maximum and become stable within 1.0 second in the first mechanism, whereas it reached the stable concentration value within less than 0.01 second in the second mechanism, as shown in Figure 1(b). Other differences between the examined mechanisms were found in the consumption of arsenic concentration, the generated hydrogen, the formation of the intermediate arsenic hydride (in the aqueous phase), and their release to the gas phase, as presented in Figures 1(c)-(e). In this regard, the arsenic concentration is shown to be totally depleted from the reaction bulk within 0.03 second in the first mechanism whereas it takes approximately 0.1 second according to the second mechanism. In contrast, the peak value of the generated hydrogen was reached after 0.03 second in the first mechanism compared with 0.003 second in the second mechanism. Moreover, the second mechanism shows that a higher amount of hydrogen is generated due to the hydroborate decomposition by approximately 4 orders of magnitude and this is in agreement with the finding of Pohl et al. [16], who reported a hydrogen gas value of 0.6 ml/min is generated from only 0.1 m/v NaBH4 decomposition. Furthermore, both mechanisms show that aqueous arsenic hydride would be generated after 0.001 second of the reaction start up and totally depleted within approximately 1 second. However, the first mechanism showed that 0.03 second is required to reach the peak AsH3(aqueous) concentration, whereas the second mechanism disclosed that more time (about 0.1 second) is required. On the other hand, both mechanisms exhibit arsenic hydride in the gaseous phase generated after 0.01 second of the reaction start up, increasing relatively with time, and reaching its maximum value after approximately 1.8 seconds, as presented in Figures 1(f)-(g). This result indicates that the first part of the reaction tube, which is approximately 5 cm length, is required to achieve the full conversion of arsenic to arsenic hydride. The result might also denote the next portion of the reaction tube would be devoted to conduct the separation of the produced gaseous from the liquid phase. In conclusion, the results of the second mechanism have shown greater agreement with the observations reported in the literature; thus, the results from the second mechanism are adopted to study the separation of the gaseous hydrides in the helical tubular section.
3. Release of the Generated Arsenic Hydride
The second reaction mechanism presumes the arsenic hydride and other side products (H2, and the intermediate borane complex) would be produced at the end of the reaction series. As mentioned earlier, the second part of the reaction tube, which begins after 5 cm, is for separation. Due to a system of two phases, a helical tubular section has been studied to perform the separation process. This configuration has been adopted to utilize the beneficial effect of the secondary flow to enhance the releasing efficiency. The secondary motion (flow perpendicular to the main flow direction) is generated in the curved section of the tube due to the centripetal action which forces the liquid phase towards the tube wall. This phenomenon occurs due to a greater density and inertia of the liquid phase compared to the gaseous phase. As a result, the attraction forces between the two phases would be reduced and finally lead to the gaseous species separation. The effect of using two turns of a helical coil was studied by assuming the following conditions, taking into consideration the main products from the hydride reaction (AsH3 and H2) and neglecting other side products to simplify the computations:
Ø 2 ml/min water stream contains 2.66 × 10⁻⁴ (mol/m3) AsH3 and 5.38 (mol/m3) H2 is introduced to the helical coil. The indicated values refer to the species concentration after passing the first part of the reaction tube, Figures 1(d) and (g).
Ø Two turns of a helical coil (2.4 mm ID) with a top and bottom turn radius of 1 cm, is applied. The total height of the spiral is 2 cm and the total length of the assembled tubular section is 12.56 cm.
The coil configuration is shown in Figure 2.
A geometry of three dimensions represents the helical tube was built in Autocad software and exported to Comsol Multiphysics 3.5 a software to conduct the computations. Two models were used in Comsol to investigate the separation process inside the helical section. The first model is the laminar flow model (incompressible NavierStokes) which was coupled with a mass transfer model (convection and diffusion). The fluid flow is described by incompressible Navier-Stokes equations, in which a laminar flow regime and a constant fluid density were assumed to describe the system in a steady state condition according to the following equations [20]:
 (31)
(31)
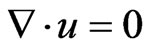 (32)
(32)
Here, η denotes the dynamic viscosity (Ns/m2), u the velocity vector (m/s), ρ the density of the fluid (kg/m3), p the pressure (Pa), and F is a body force term (N/m3).
The boundary conditions were taken as follows: at the inlet of the tubular section, the velocity vector is normal to the boundary, i.e. u∙n = u0; whereas the pressure at the outlet boundary is set (p = p0 = 0). Moreover, the flow is considered running down along the bottom half of the tubular section with a specific velocity, u, whereas the top half of the tubular section is considered as a no-slip
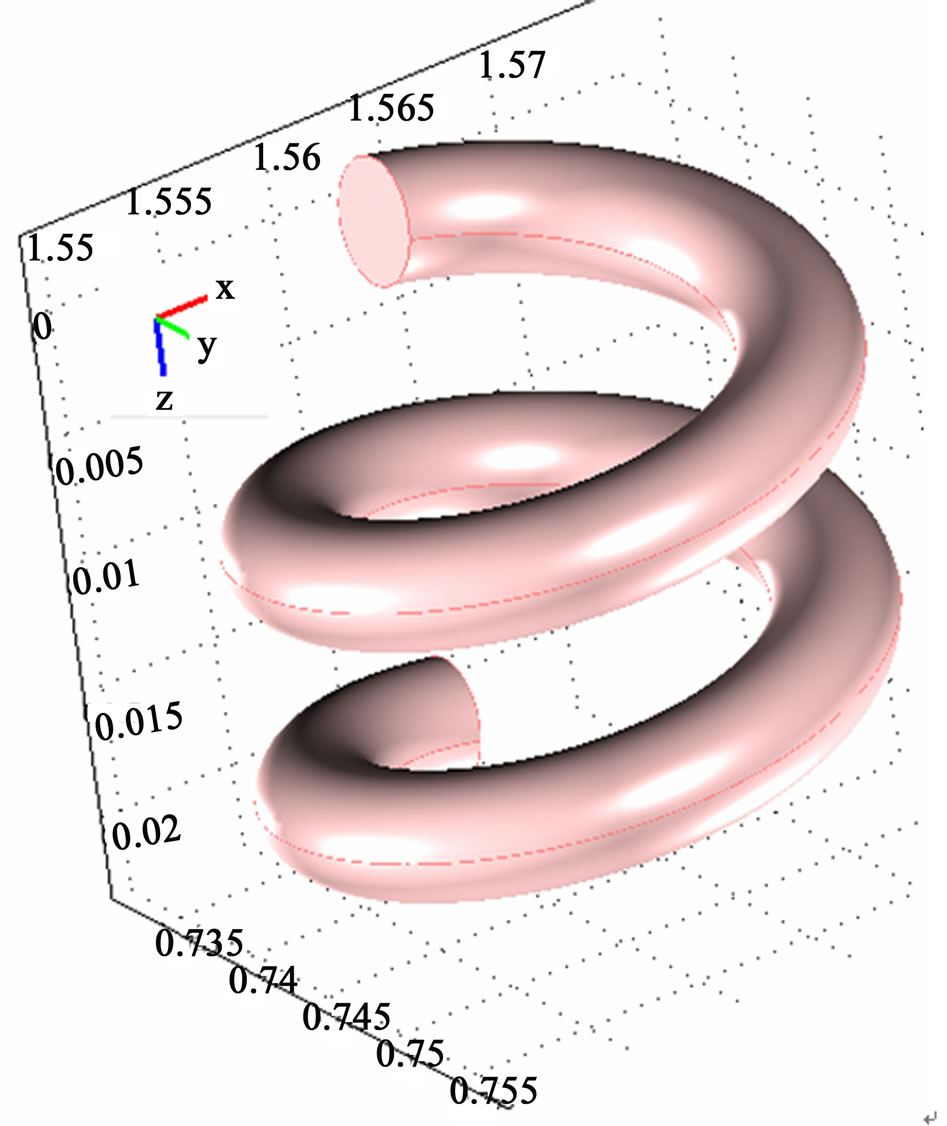
Figure 2. The geometry of the helical tubular section.
boundary (u = 0).
The mass transfer process in the studied helical section is modeled as a convection-diffusion equation:
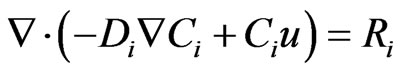 (33)
(33)
where Ci and Di represents the concentration (mol/m3) of species (i) and the diffusion coefficient (m2/s) respecttively, whereas Ri denotes the reaction term (mol/m3/sec). At the inlet section of the tubular helical section, the boundary condition is assumed (Ci = Ci0) which equals the initial concentration. The outlet boundary conditions presume that no mass flux occurs due to diffusion, hence dominated by convection, therefore the total flux is described by:
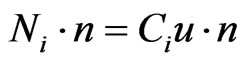 (34)
(34)
Moreover, zero mass transfer is imposed at the interior surfaces due to the assumption of impermeable boundaries. The computations were conducted numerically by applying the finite element method treated by (Lagrange – P2P1) elements for pressure stability. The mesh was refined manually by changing the element size, which consequently result in increasing the accuracy. The accuracy of the solution was inferred by estimating a specific parameter (concentration of AsH3) at a specific point along the helical tube. A numerical error estimation study was conducted to infer the appropriate grid size for higher solution accuracy. Eventually, a very fine mesh of 84,194 elements and 826,978 degrees of freedom were applied in the computations, which produced the lowest relative error. The computation results of the finest grid size are adopted for discussion.
Figure 3 illustrates the simulation results represented by the velocity field distribution and the change of species concentration along (z) coordinate. The results show that a gradual increase in the velocity field along (z) coordinate occurs, which could be attributed to the effect of the secondary motion on the momentum transfer. Moreover, concentration depletion occurs for all species through the helical section which indicates higher probability for species transfer from the liquid phase to the gaseous phase as a result of high diffusion rate. The results also show that both AsH3 and H2 are completely depleted from the liquid phase within the tested length of the helical coil. However, the hydrogen gas is shown to be depleted faster than the arsenic hydride, and this is clearly attributed to a higher diffusion coefficient of hydrogen (1.32 × 10⁻⁷ cm2/sec) compared with the arsenic hydride diffusion coefficient (3.45 × 10⁻¹⁰ cm2/sec) [21, 22]. The diffusion coefficients also result in big differences between the estimated Peclet numbers of the examined species at a specific point along the tubular section (1.5 × 10⁸ for AsH3 and 4 × 10⁵ for H2 estimated at x = 1.5675, y = 0.745, and z = 0.0115), where Peclet number is defined as the ratio of the rate of advection of a physical quantity by the flow to the rate of diffusion of the same quantity driven by an appropriate gradient.
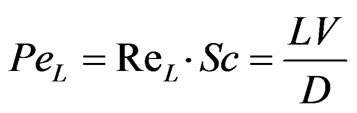 (35)
(35)
where; Re = Reynolds number, Sc = Schmidt number, L = characteristic length, V = velocity magnitude, and D = mass diffusion coefficient.
It can be observed that the combined results from Sections 2 and 3 indicate that a total of 12 cm would be sufficient to apply the reduction reaction and the volatile hydride separation. In order to validate this result, an experimental work was conducted by using the set up illustrated in Figure 4 to generate the arsenic hydride and applying the DBD atomizer that described in our previous work [15] and emission spectroscopy analysis by using USB 2000 spectrometer (Ocean Optics) to monitor the generated arsenic free atoms signal versus several tubular section lengths.
The results are illustrated in Figure 5 which shows that no more than 6.6% increase in the free arsenic atoms intensity upon increasing the tubular section length from 12 to 100 cm. Practically, the improvement achieved in the free arsenic atoms signal intensity upon increasing the tubular section length is found to be limited, which emphasize that the results obtained from the undertaken
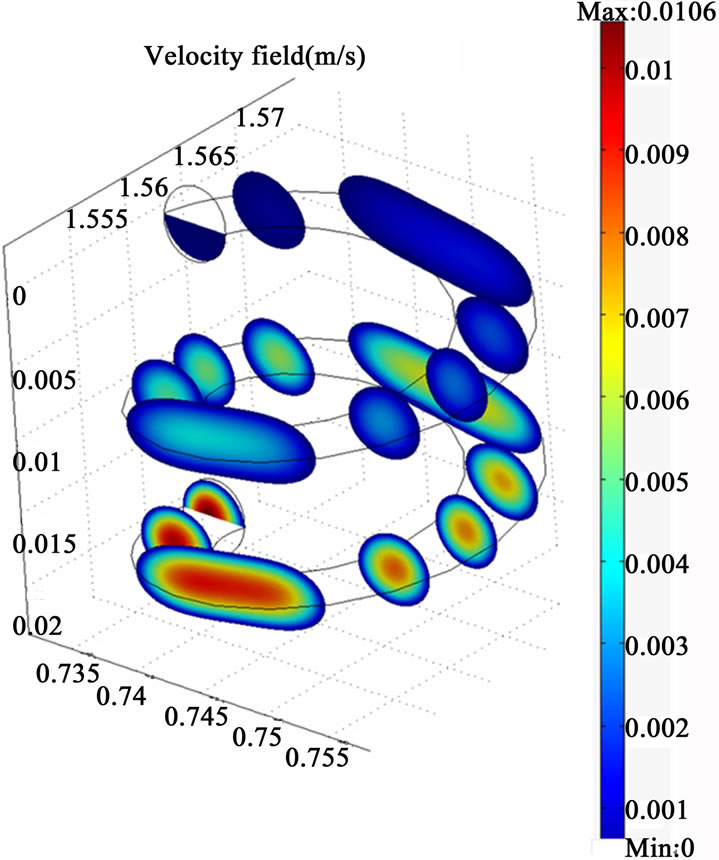
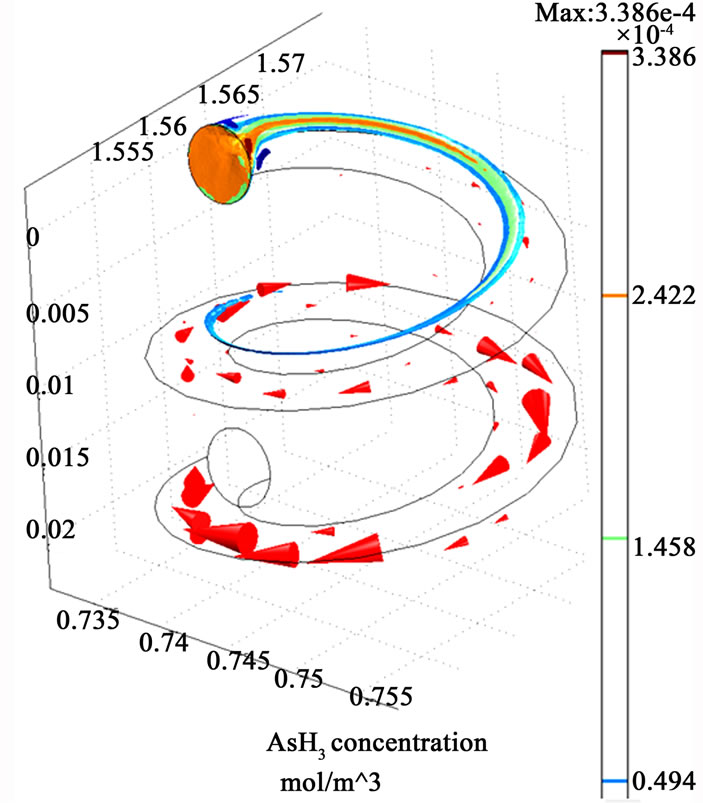
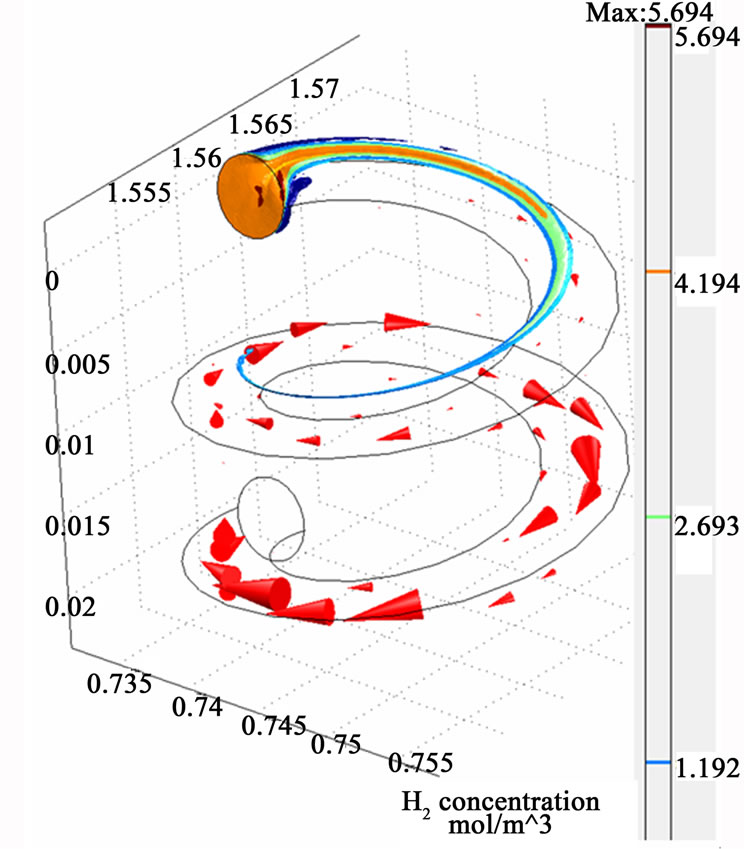
Figure 3. The simulation results of the helical tubular section (three dimensions visual representation). The red arrows indicate the velocity fields.
theoretical studies are factual. It should be mentioned that this finding clearly denotes that the length of the reaction coil should be precisely decided and no need to adopt long reaction coils (50 - 100 cm) which were normally applied to generate the hydride in elsewhere studies.
4. Study of the Atomization of Arsenic Hydride and the Distribution of the Free Analyte Atoms in a Heated Quartz Cell
The arsenic hydride atomization in a heated quartz cell working at 1000˚K is presented in this section; the aim is to speculate the formation and the distribution of the produced free arsenic species through the examined atomizer. It is worth noting that the atomization of volatile hydride forming elements in a heated quartz cell has been described according to the following mechanism [13]:
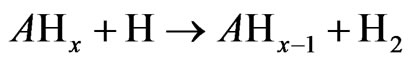
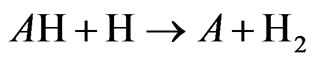
where; A refers to the examined analyte.
The distribution of the free analyte atoms in the tubular atomizer was described according to the laminar flow model, which presumes a laminar flow for the gas only occurs in the longitudinal direction of the atomizer, whilst the transport of the species in the radial direction occurs by diffusion [1]. The following partial differential equation describes the free atoms distribution in the cylindrical coordinates, assuming a uniform diffusion coefficient (Dk) and non uniform atomic density (n):
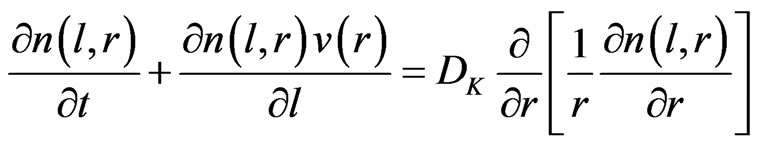 (36)
(36)
If a negligible change of free atom velocity in the axial direction is assumed, the equation can be reduced to the following form:
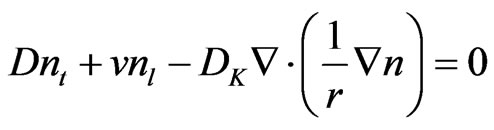 (37)
(37)
The parametric values below are utilized in this work, assuming a 4 cm length and 1 mm diameter tubular atomization channel is applied. The other assumption is the diffusion coefficient of the transferred gases to the atomizer is equal to the hydrogen gas diffusion coefficient in a gas phase.
D = 1, v = 0.084 m/sec, Dk = 1.132 × 10⁻⁴ m2/sec.
The following boundary conditions are applied according to Dedina and Tsalev [1]:
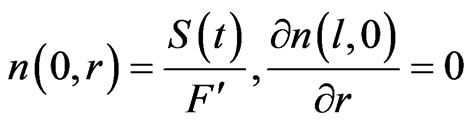
S(t): The hydride supply function which represents the number of the analyte atoms delivered to the atomizer in the form of hydride per unit time.  is the total gas flow rate flowing within the atomizer optical tube, i.e. it is the total gas flow rate entering the atomizer corrected to the atomizer temperature. The distribution criteria shown by Equation (37) is a single partial differential equation in two spaces dimension, which can be categorized as a parabolic equation with the following general form [23]:
 (38)
(38)
ut is the partial derivative of the variable (u) with time In the axial (l) and radial (r) directions, the general form is written as follows:
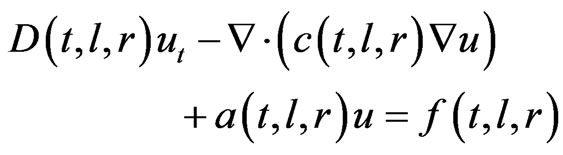 (39)
(39)
The boundary conditions were reformulated according to the following assumptions:
1) Dirichlet boundary condition [u(t; l; r)]:
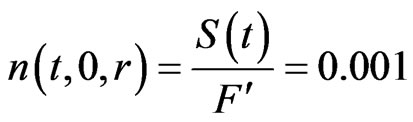 (40)
(40)
i.e. the ratio of the analyte atoms (delivered to the atomizer in the form of hydride) to the total amount of the gases enter the atomizer is equal to .
.
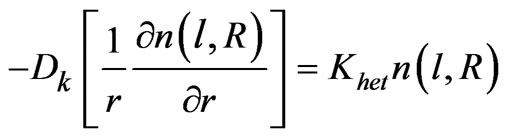
2) Neumann boundary conditions, according to the following relation:
 (41)
(41)
where;  represents a unit vector normal to the domain at r = 0 (at the tube centre),
 (42)
(42)
at r = R (at the tube inside wall surface),
 (43)
(43)
The conversion of arsenic hydride into the arsenic free atoms was addressed taken to with a rate constant of 62 sec–1 [10]. This value was utilized in this study by assuming the value and units of (K) are applicable for  . Thus, the term (K/Dk) is estimated equal to 5.47 × 10⁵ m–2, so that,
 q = 0 & g = 5.47 × 10⁵. It should be noted that a value (c = 1) was used in the general equation as well as the boundary conditions. Moreover, the initial atom density is assumed to be, n(t0) = 0.001 atoms/m3.
The above conditions were applied to analyse the proposed atomizer, where the geometry was set by using the graphical user interface in Matlab software. The results of the free analyte density distributions along the investigated tubular atomizer are shown in Figure 6. The distribution indicates a maximum value in the order of 108 atom·m–3 ( mol·m–3) would be generated in the centre of the atomization cell, whereas the atoms would approximately be vanished at the outlet end due to the dissipation at the inlet walls.
Further investigations are conducted on quartz cell atomizer at a steady state condition by using CFD. One of the well known commonly used atomizers is the externally heated quartz tube atomizer (EHQTA) which applies electrical resistance device or an acetylene-air flame to heat the optical tube to a temperature in the
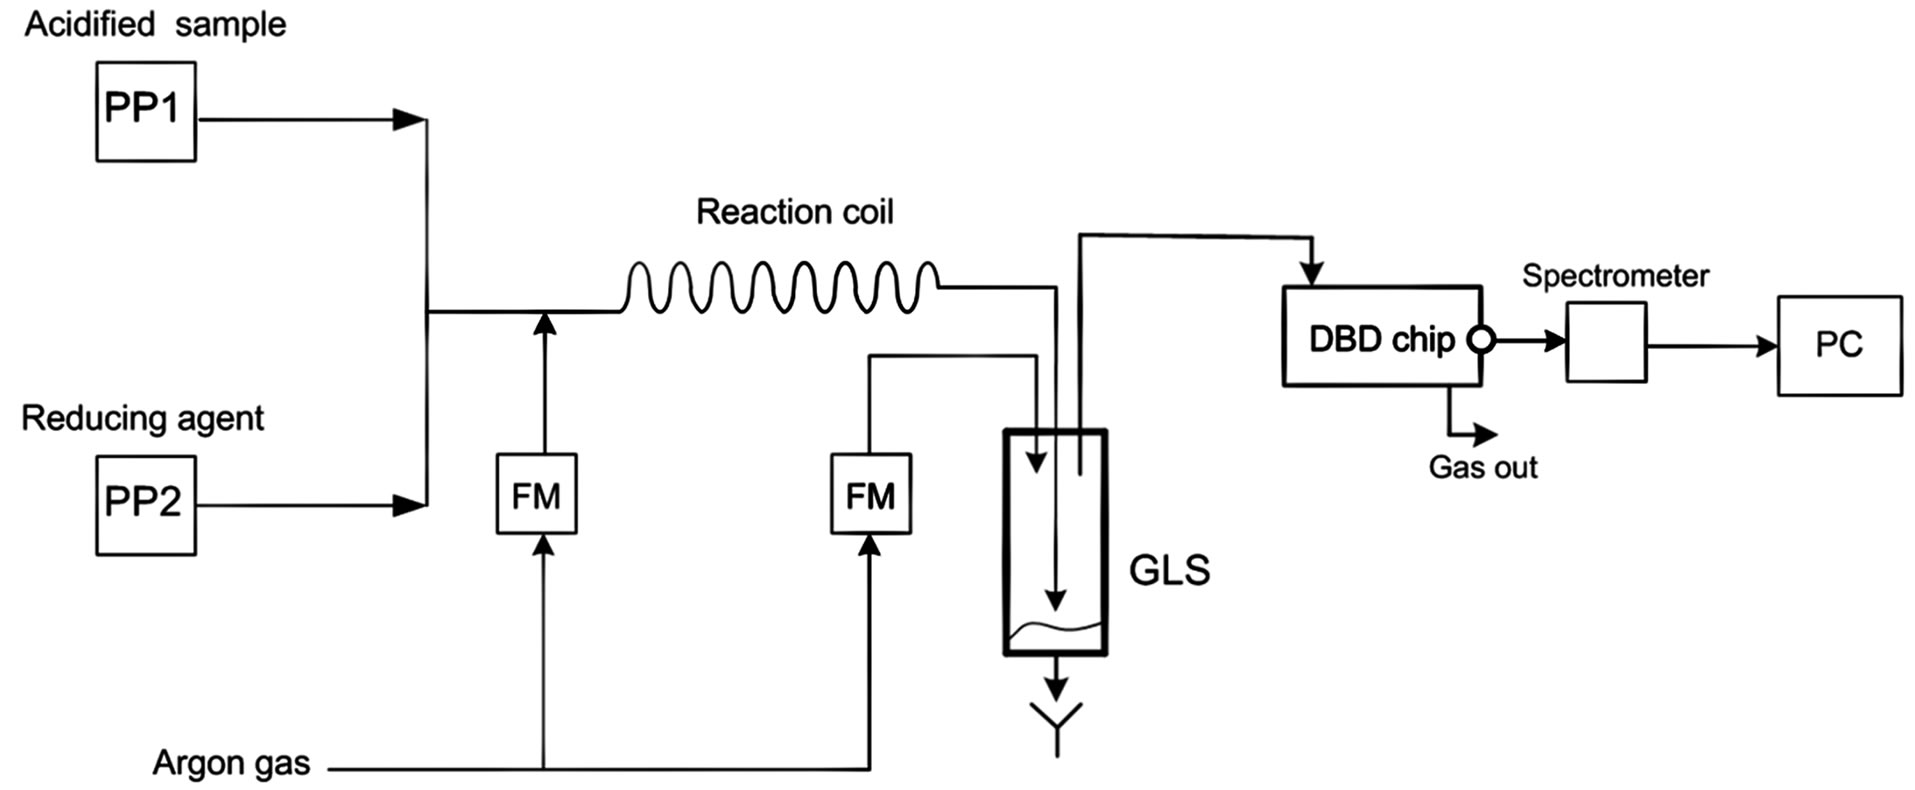
Figure 4. A schematic diagram illustrates the system used to conduct the chemical vapour generation techniques for arsenic; PP indicates peristaltic pump, GLS is a gas/liquid separator, FM is a flow meter.
Figure 5. The variation of free arsenic atoms signal intensities versus different lengths of the tubular reactor; The signals were recorded upon applying 1.3 (M) HCL and 1.5% (m/v) stabilized with 0.5% (m/v) NaOH for 100 µg/L arsenic prepared from the step wise dilution of atomic absorption standard purchased from Sigma Aldrich, UK.
Figure 6. The distribution of the free arsenic atoms in a tubular atomizer (time = 3 seconds).
range (700˚C - 1100˚C) [24]. In the current case study, the atomizer is assumed to be a heated quartz tube atomizer (L-shape HQTA) employing an internal central electrical resistance device to heat the tube bulk up to 1000˚K. The reason for proposing this design is to envisage the effect of the internal heating on the atomization mechanism and the distribution of the examined species along the tubular atomizer. The geometry is shown in Figure 7, in which the gas channel internal diameter is assumed equal to (1 mm) and the arm tube that is utilized to supply the gases to the atomizer is connected from the left hand side.
It should be mentioned that Dedina et al. [25] have attributed the hydride atomization mechanism in a miniature diffusion flame quartz tube into physical processes and chemical reactions. The physical processes are attributed to macroscopic movements (e.g. convection, thermal expansion, and flow turbulances) as well as the free atom diffusion. On the other hand, the chemical reactions are reported to occur with gaseous species
Figure 7. A schematic diagram illustrates top view of the rectangular L-shape HQTA; the illustrated section (75 mm length) represents the atomization channel. The center section (40 mm length) represents the electrical resistance device. AsH3, helium gas and the accompanying hydrogen gas enters the atomizer from the arm tube that is connected to the atomization channel from beneath left hand side (not shown in the diagram).
transfers to the flame as well as the flame components itself. However, they concluded that the only feasible way for the hydride atomization is related to the interaction with hydrogen radicals cloud which forms in the outer zone of the flame due to reactions between oxygen and hydrogen. In a similar elucidation, Dedina [24] reported that a cloud of hydrogen radicals forms in the hot region of the heated quartz tubular atomizer is responsible of the hydride atomization. The cloud position is mentioned to be dependant on the temperature profile and the gas flow rate inside the atomizer. It is also reported that the hydrogen enters to the EHQTA atomizer from the gas-liquid separator, which is generated due to the hydroborate decomposition, is enough to produce the required hydrogen radicals inside the atomization channel. However, a specific amount of oxygen, should be determined based on the total gas flow rate supplied to the atomizer and on the inner diameter of the atomizer, is required to intiate the H2/O2 reaction [24]. Accordingly, it is assumed that the hydrogen radicals are available in the investigated Lshape HQTA atomizer and therefore the current case study is devoted to deduce the distribution of AsH3 species and the created free arsenic atoms along the atomizer. According to Dedina [24], there are two reasons for removing the free analyte atoms from the optical path of the atomizer; the first is the forced convection due to the gas flow inside the HQTA atomizer, while the second reason is the chemical reaction between the unstable free atoms outside the hydrogen radicals cloud, which means the free atoms start to react after leaving the hydrogen radicals cloud.
In practice, the atomization series was demonstrated by a simple first order removal of arsenic hydride from the gas phase and a later displacement of the arsenic atoms from the light path, represented by the following criteria [10].
where; k1 = 3.3 sec–1 and k2 = 62 sec–1.
The abovementioned mechanism has been adopted in this part of the study; hence, the change of species concentration with time is represented as follows:
 (44)
(44)
 (45)
(45)
Three models were coupled simultaneously in Comsol 3.5 a software to investigate the dissociation of the arsenic hydride into free arsenic atoms upon entering the atomization channel and being subjected into thermal effect. The models included momentum, energy transfer (convection and conduction) and mass transfer (convection and diffusion). In the initial conditions, an inlet stream to the atomizer presumed mainly consists of helium gas accompanied by 2.66 × 10⁻⁴ mol/m3 of the arsenic hydride. The produced hydrogen and other gaseous species from the former stages were neglected to simplify the computations. Moreover, the inlet stream velocity was assumed to be 0.084 m/sec. The hydride molecule dissociation into the free atoms was considered to be an exothermic reaction accompanied by elaborating (–189 kJ/mol) [13]. This value has been adopted in this study in order to consider the effect of the generated heat. The fluid flow is described by using the incompressible Navier-Stokes equations, in which a laminar flow regime and constant fluid density was assumed to perceive the system in a steady state condition according to the Equations (31) and (32). The boundary conditions were assigned as follows: at the inlet of the atomization channel, the velocity vector is normal to the boundary, i.e. u.n = u0; whereas the pressure at the outlet boundary is set (p = p0 = 0). Moreover, a no-slip boundary conditions is selected at the interior surfaces of the atomization channel (u = 0).
The mass transfer in the studied domain is considered to occur through a convection-diffusion scheme. The mass balance equation in a steady state condition is described according to Equation (33). At the inlet section of the atomization channel, the boundary condition is assumed (Ci = Ci0) which equals the initial concentration. The outlet boundary conditions assume no mass flux occurs due to diffusion, hence dominated by convection; therefore the total flux is described as shown in Equation (34). Moreover, zero mass transfer is imposed at the interior surfaces due to the assumption of insulated boundaries.
The heat transfer in the atomizer domain is considered to occur through a convection-conduction scheme. The energy balance equation in a steady state condition is shown as follows:
 (46)
(46)
Here, Cp denotes the specific heat capacity (J/kg/K), K is the thermal conductivity (W/m/˚K), and Q is a sink or source term (W/m3). At the inlet boundary, the temperature is assumed equal to an ambient temperature (T = T0); whereas a continuity boundary condition is assigned for the interior surfaces in touch with the atomization channel to assure heat transfer to and from the channel through these areas. Furthermore, thermal insulation boundary conditions are assigned for the outer surfaces. At the outlet section, a convective flux condition is assumed across the boundary, in which all energy transport is conducted through the convective flux, which indicates no heat flux occurs due to conduction. This assumption result in the following description for the total heat flux:
 (47)
(47)
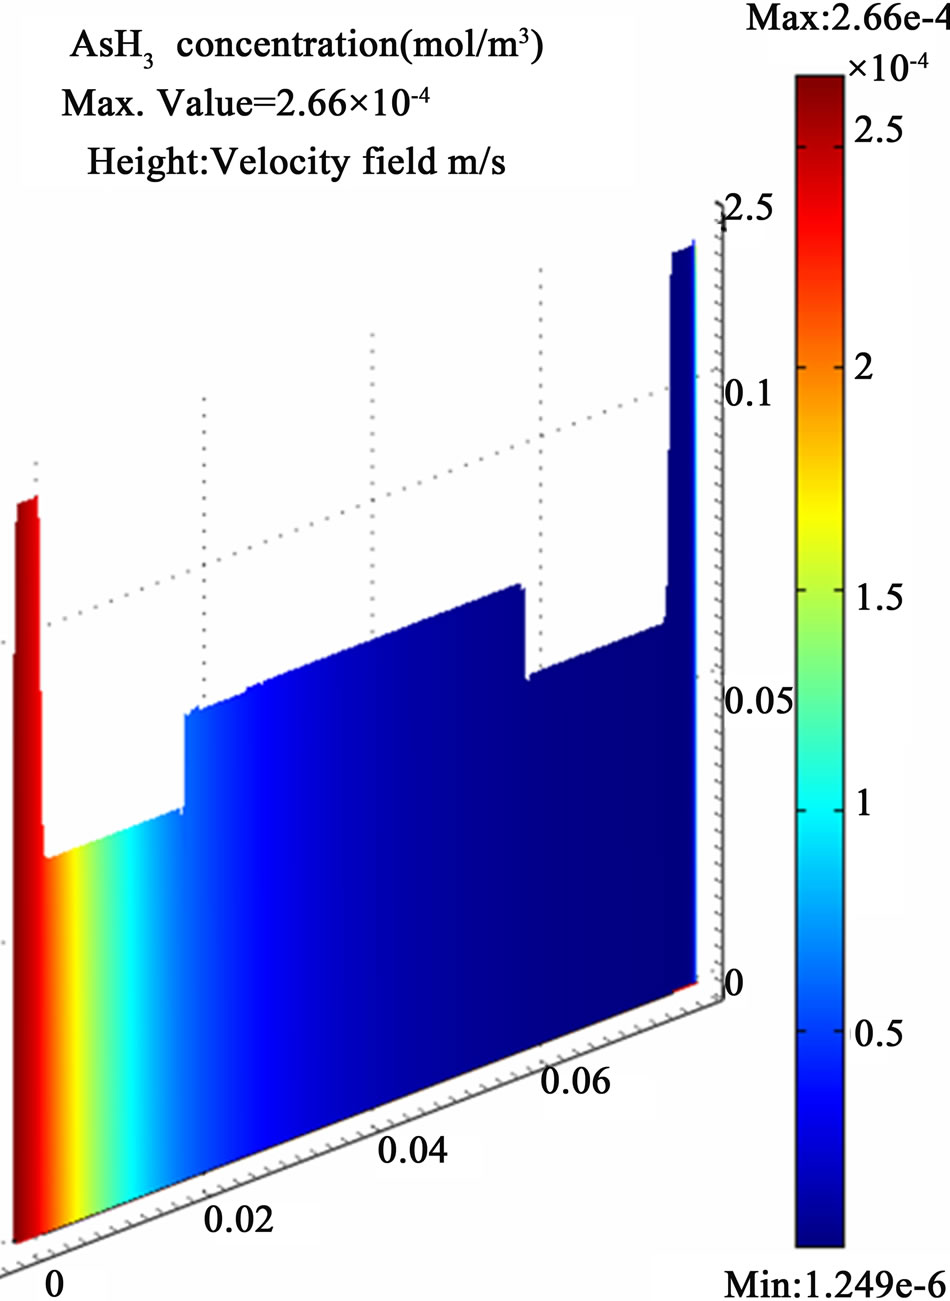
All the equations described above and the boundary conditions are discretized according to the Galerkin finite element method with Lagrange second order elements except the pressure which has been treated by the hybrid P2 – P1 scheme. A numerical error estimation study was conducted to infer the appropriate grid size for higher solution accuracy. Eventually, a fine mesh with 50,936 elements and 557,246 degrees of freedom was applied in the computations which produced a relative error less than 0.5 % for the estimated arsenic free atoms concentration at the end of the atomization channel. The results of the finest grid size, shown in Figure 8, are adopted for discussion. The results have shown the whole atomization process is conducted within approximately (0.4 sec) in the first quarter of the atomization channel. A maximum value (1.5 × 10⁻⁵ mol/m3) of the arsenic free atoms is produced from 2.66 × 10⁻⁴ mol/m3 arsenic hydride enters the atomization cell and dissipates directly in a very short period upon being subjected to the applied thermal energy from a heat source working at 1000˚K in addition to the presumed collisions with a cloud of hydrogen radicals.
Although different concentrations are estimated for the free arsenic atoms from the aforementioned case studies (the analytical and simulation studies), it could be noted that a similar pattern has produced in both cases which show that the free arsenic atoms generate and dissipate inside the atomizer before reaching the far end of the atomization channel. It should be noted that the aforementioned results are found totally compatible with the findings mentioned by Dedina [24] who reported that under typical conditions in a quartz tube atomizer, all free atoms disappear before reaching the optical tube ends due to series of recombination reactions outside the hydrogen radicals cloud. These results indicate that the centre of the atomization cell is the appropriate position for the spectrometric data acquisition, which conse-
 (a)
(a)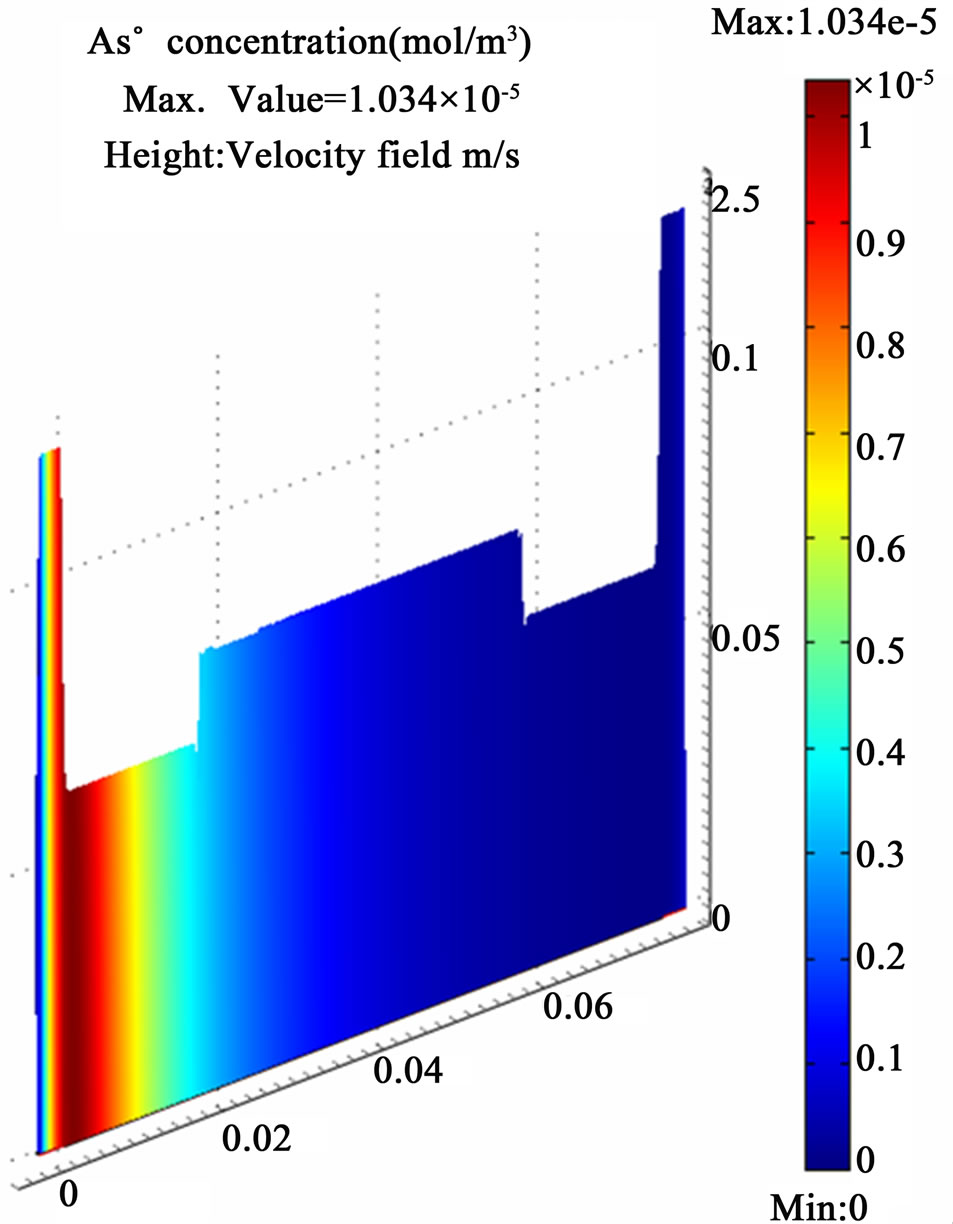 (b)
(b)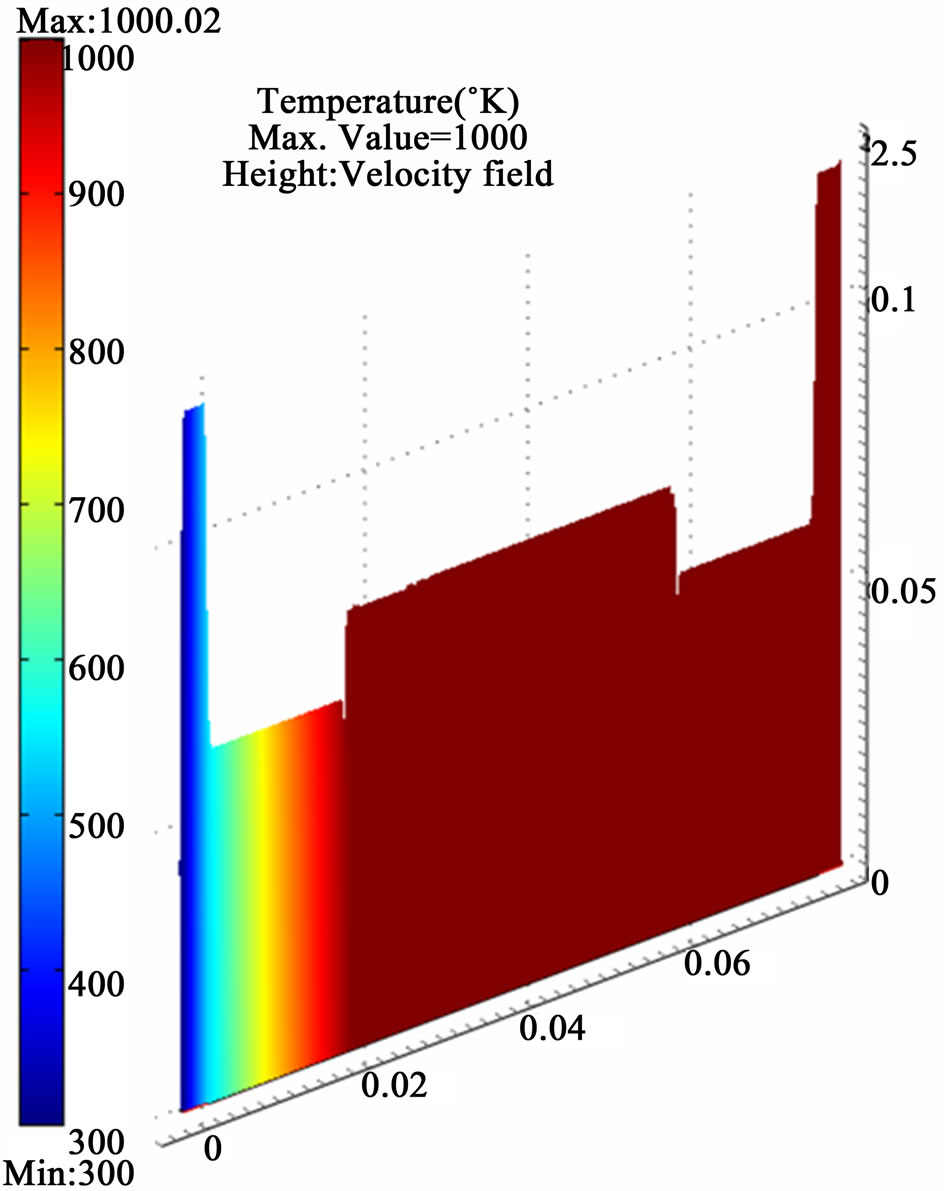 (c)
(c)
Figure 8. The simulation results of internally heated quartz cell atomizer; (a) The concentration distribution of AsH3 along the quartz cell at (y = 0.0012 mm); (b) The concentration distribution of the arsenic free atoms As along the quartz cell at (y = 0.0012 mm); (c) The temperature distribution along the atomization tube.
quently denotes the radial data acquisition is more reliable in the proposed design of HQTA.
5. Conclusion
Two mechanisms were explored to study the arsenic hydride generation process in a tubular reactor. The computations show that the second mechanism is more realistic with the observations mentioned elsewhere in the literature, in which the hydroborate decomposition was required few milliseconds to accomplish and higher hydrogen quantity is produced. This result has indicated a full reaction sequence for the conversion of arsenic into arsenic hydride and their release to the gaseous phase would occur within 5 cm length of the reaction tube. The simulation results of the helical tube show a beneficial effect on the separation efficiency, which is produced from the secondary motion along the helical tube. The results also showed that the tested helical section was proved sufficient to achieve the full separation of both arsenic hydride and the hydrogen gas from the liquid phase and their transfer into the accompanying gas phase.
The combined results from the above case studies indicated that no more than 12 cm from the tubular reactor length is required to achieve the reaction and separation stages. This result has been verified experimentally which means no need to adopt longer tubular reaction sections mentioned elsewhere in the literature. The distribution of the free analyte atoms in FIT and HQTA atomizers revealed that a higher density of atoms form in the first part of the atomization channel, saturates to a maximum, and dissipates at the inside wall of the atomizer before reaching the outlet far end. This result is found in agreement with the current knowledge mentioned elsewhere in the literature, and indicates that the atomizer centre is the optimal position for the radial data acquisition in this kind of atomizers.
6. Acknowledgements
Wameath S. Abdul-Majeed acknowledges the Iraqi ministry of higher education and scientific research (IMOHE) for a doctoral scholarship. William B. Zimmerman thanks the royal society for a Mercer Innovation Award and the Royal Academy of Engineering for an industrial secondment award with AECOM Design Build.
REFERENCES
- J. Dedina and D. Tsalev, “Hydride Generation Atomic Absorption Spectrometry,” John Wiley & Sons Ltd., Chichester, 1995.
- Y. Feng, J. Lam and R. Sturgeon, “Expanding the Scope of Chemical Vapor Generation for Noble and Transition Metals,” Analyst, Vol. 126, No. 11, 2001, pp. 1833-1837. doi:10.1039/b107494f
- P. Pohl and B. Prusisz, “Chemical Vapor Generation of Noble Metals for Analytical Spectrometry,” Analytical and Bioanalytical Chemistry, Vol. 388, No. 4, 2007, pp. 753-762. doi:10.1007/s00216-006-0678-9
- J. Dedina, “Optimization of Hydride Generation Methods for AAS,” Fresenius’ Journal of Analytical Chemistry, Vol. 323, 1986, pp. 771-782.
- X. Wang, “A Mathematical Model for Continuous Hydride Generation with Inductively Coupled Plasma Spectrometry Analysis: I. Hydride Transfer,” Spectrochimica Acta Part B: Atomic Spectroscopy, Vol. 41, No. 9, pp. 967-977. doi:10.1016/0584-8547(86)80100-8
- X. Wang and R. Barnes, “A Mathematical Model for Continuous Hydride Generation with Inductively Coupled Plasma Spectrometry: II. pH Dependence of Hydride Forming Elements,” Spectrochimica Acta Part B: Atomic Spectroscopy, Vol. 42, No. 1-2, 1987, pp. 139-156. doi:10.1016/0584-8547(87)80057-5
- A. D’ulivo, Z. Mester and R. Sturgeon, “The Mechanism of Formation of Volatile Hydrides by Tetrahydroborate (III) Derivatization: A Mass Spectrometric Study Performed with Deuterium Labeled Reagents,” Spectrochimica Acta Part B: Atomic Spectroscopy, Vol. 60, No. 4, 2005, pp. 423-438. doi:10.1016/j.sab.2005.03.015
- A. D’ulivo, M. Onor and E. Pitzalis, “Role of Hydroboron Intermediates in the Mechanism of Chemical Vapor Generation in Strongly Acidic Media,” Analytical Chemistry, Vol. 76, No. 21, 2004, pp. 6342-6352. doi:10.1021/ac040078o
- A. D’ulivo, J. Dědina, Z. Mester, R. Sturgeon, Q. Wang and B. Welz, “Mechanisms of Chemical Generation of Volatile Hydrides for Trace Element Determination (IUPAC Technical Report),” Pure and Applied Chemistry, Vol. 83, No. 6, 2011, pp. 1283-1340. doi:10.1351/PAC-REP-09-10-03
- S. Van Wagenen, D. Carter, A. Ragheb and Q. Fernando, “Kinetic Control of Peak Shapes in Atomic Absorption Arsenic Determinations by Arsine Generation,” Analytical Chemistry, Vol. 59, No. 6, 1987, pp. 891-896. doi:10.1021/ac00133a022
- B. Welz and M. Melcher, “Investigations on Atomisation Mechanisms of Volatile Hydride-Forming Elements in a Heated Quartz Cell. Part 1. Gas-Phase and Surface Effects; Decomposition and Atomisation of Arsine,” Analyst, Vol. 108, No. 1283, 1983, pp. 213-224. doi:10.1039/an9830800213
- B. Welz and M. Schubert-Jacobs, “Investigations on Atomization Mechanisms in Hydride-Generation Atomic Absorption Spectrometry,” Fresenius’ Journal of Analytical Chemistry, Vol. 324, 1986, pp. 832-838.
- A. R. Kumar and P. Riyazuddin, “Mechanism of Volatile Hydride Formation and Their Atomization in Hydride Generation Atomic Absorption Spectrometry,” Analytical Sciences, Vol. 21, No. 12, 2005, pp. 1401-1410. doi:10.2116/analsci.21.1401
- J. Dedina and I. Rubeka, “Hydride Atomization in a Cool Hydrogen-Oxygen Flame Burning in a Quartz Tube Atomizer,” Spectrochimica Acta Part B: Atomic Spectroscopy, Vol. 35, No. 3, 1980, pp. 119-128. doi:10.1016/0584-8547(80)80059-0
- W. Abdul-Majeed, J. Parada and W. Zimmerman, “Optimization of a Miniaturized DBD Plasma Chip for Mercury Detection in Water Samples,” Analytical and Bioanalytical Chemistry, Vol. 401, No. 9, 2011, pp. 2713- 2722. doi:10.1007/s00216-011-5118-9
- P. Pohl, I. Zapata, N. Bings, E. Voges and J. Broekaert, “Optical Emission Spectrometric Determination of Arsenic and Antimony by Continuous Flow Chemical Hydride Generation and a Miniaturized Microwave Microstrip Argon Plasma Operated inside a Capillary Channel in a Sapphire Wafer,” Spectrochimica Acta Part B: Atomic Spectroscopy, Vol. 62, No. 5, 2007, pp. 444-453. doi:10.1016/j.sab.2007.04.007
- F. Laborda, “Hydride Generation in Analytical Chemistry and Nascent Hydrogen: When Is It Going to Be Over?” Spectrochimica Acta, Vol. 57, No. 4, 2002, pp. 797-802. doi:10.1016/S0584-8547(02)00010-1
- W. B. Zimmerman, “Multiphysics Modelling with Finite Element Methods,” World Scientific Publishing Co. Pte. Ltd., London, 2006.
- F. Wang and W. Jolly, “Kinetic Study of the Intermediates in the Hydrolysis of the Hydroborate Ion,” Inorganic Chemistry, Vol. 11, No. 8, 1972, pp. 1933-1941. doi:10.1021/ic50114a042
- COMSOL, “Chemical Engineering Module User’s Guide Version 3.5,” 2008.
- C. Wilke, “A Viscosity Equation for Gas Mixtures,” The Journal of Chemical Physics, Vol. 18, No. 4, 1950, p. 517. doi:10.1063/1.1747673
- H. Chung and A. Dalgarno, “Diffusion of Hydrogen Atoms in Helium Gas and Helium Atoms in Hydrogen Gas,” Physical Review A, Vol. 66, No. 1, 2002, Article ID: 012712. doi:10.1103/PhysRevA.66.012712
- P. Howard, “Partial Differential Equations in Matlab 7.0,” 2005. http://www.tem.uoc.gr/~marina/pdemat.pdf.
- J. Dedina, “Atomization of Volatile Compounds for Atomic Absorption and Atomic Fluorescence Spectrometry: On the Way towards the Ideal Atomizer,” Spectrochimica Acta Part B: Atomic Spectroscopy, Vol. 62, No. 9, 2007, pp. 846-872. doi:10.1016/j.sab.2007.05.002
- J. Dedina, A. D’ulivo, L. Lampugnani, T. Matousek and R. Zamboni, “Selenium Hydride Atomization, Fate of Free Atoms and Spectroscopic Temperature in Miniature Diffusion Flame Atomizer Studied by Atomic Absorption Spectrometry,” Spectrochimica Acta Part B: Atomic Spectroscopy, Vol. 53, No. 13, 1998, pp. 1777-1790. doi:10.1016/S0584-8547(98)00223-7