Paper Menu >>
Journal Menu >>
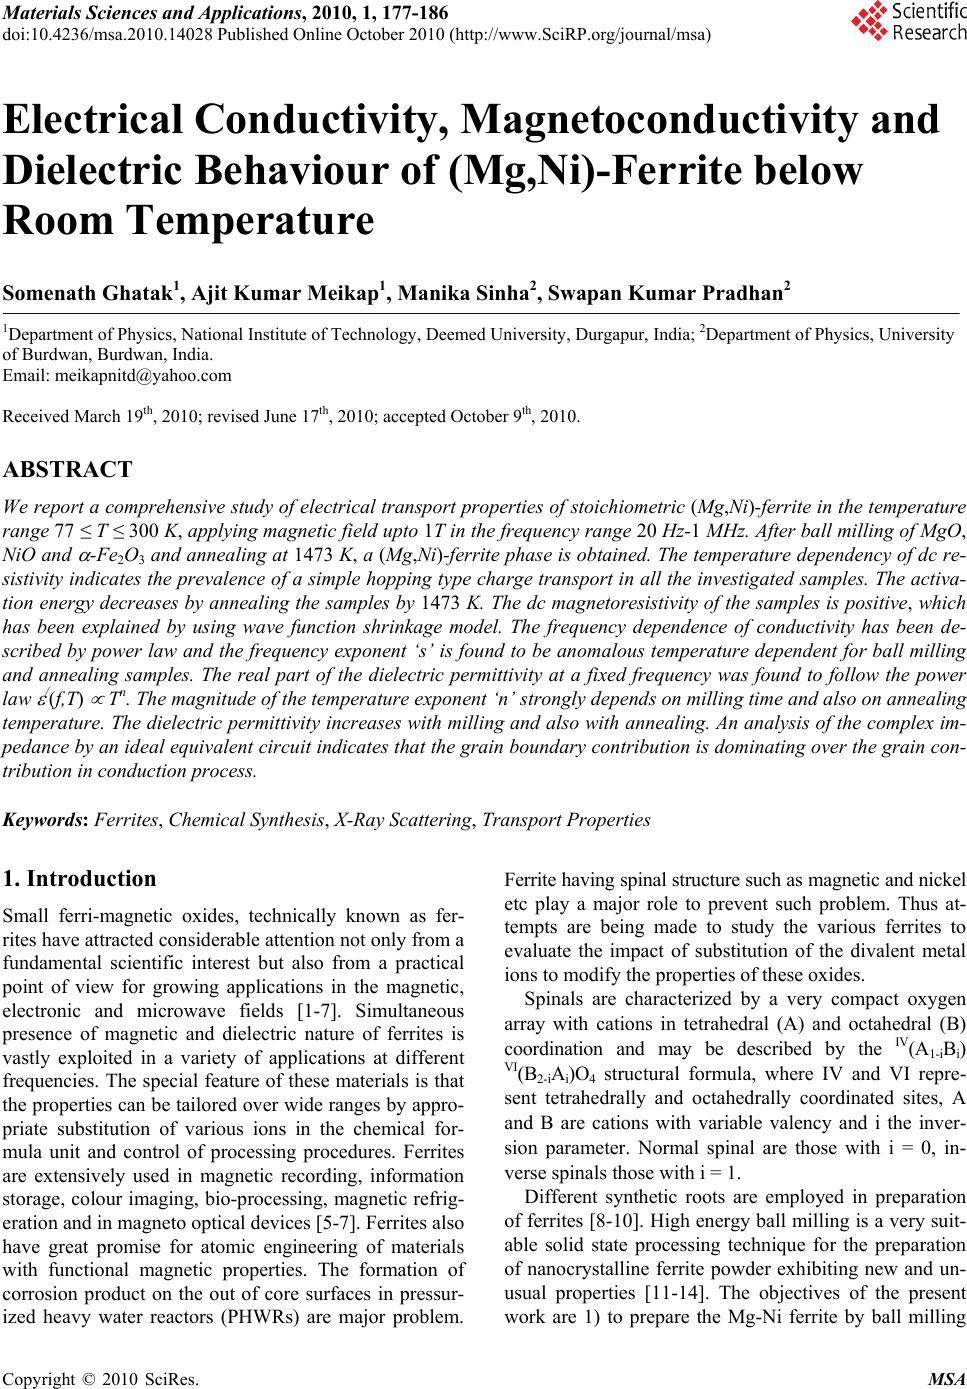 Materials Sciences and Applications, 2010, 1, 177-186 doi:10.4236/msa.2010.14028 Published Online October 2010 (http://www.SciRP.org/journal/msa) Copyright © 2010 SciRes. MSA 177 Electrical Conductivity, Magnetoconductivity and Dielectric Behaviour of (Mg,Ni)-Ferrite below Room Temperature Somenath Ghatak1, Ajit Kumar Meikap1, Manika Sinha2, Swapan Kumar Pradhan2 1Department of Physics, National Institute of Technology, Deemed University, Durgapur, India; 2Department of Physics, University of Burdwan, Burdwan, India. Email: meikapnitd@yahoo.com Received March 19th, 2010; revised June 17th, 2010; accepted October 9th, 2010. ABSTRACT We report a comprehensive study of electrical transport properties of stoichiometric (Mg,Ni)-ferrite in the temperature range 77 ≤ T ≤ 300 K, applying magnetic field upto 1T in the frequency range 20 Hz-1 MHz. After ball milling of MgO, NiO and -Fe2O3 and annealing at 1473 K, a (Mg,Ni)-ferrite phase is obtained. The temperature dependency of dc re- sistivity indicates the prevalence of a simple hopping type charge transport in all the investigated samples. The activa- tion energy decreases by annealing the samples by 1473 K. The dc magnetoresistivity of the samples is positive, which has been explained by using wave function shrinkage model. The frequency dependence of conductivity has been de- scribed by power law and the frequency exponent ‘s’ is found to be anomalous temperature dependent for ball milling and annealing samples. The real part of the dielectric permittivity at a fixed frequency was found to follow the power law /(f,T) Tn. The magnitude of the temperature exponent ‘n’ strongly depends on milling time and also on annealing temperature. The dielectric permittivity increases with milling and also with annealing. An analysis of the complex im- pedance by an ideal equivalent circuit indicates that the grain boundary contribution is dominating over the grain con- tribution in conduction process. Keywords: Ferrites, Chemical Synthesis, X-Ray Scattering, Transport Properties 1. Introduction Small ferri-magnetic oxides, technically known as fer- rites have attracted considerable attention not only from a fundamental scientific interest but also from a practical point of view for growing applications in the magnetic, electronic and microwave fields [1-7]. Simultaneous presence of magnetic and dielectric nature of ferrites is vastly exploited in a variety of applications at different frequencies. The special feature of these materials is that the properties can be tailored over wide ranges by appro- priate substitution of various ions in the chemical for- mula unit and control of processing procedures. Ferrites are extensively used in magnetic recording, information storage, colour imaging, bio-processing, magnetic refrig- eration and in magneto optical devices [5-7]. Ferrites also have great promise for atomic engineering of materials with functional magnetic properties. The formation of corrosion product on the out of core surfaces in pressur- ized heavy water reactors (PHWRs) are major problem. Ferrite having spinal structure such as magnetic and nickel etc play a major role to prevent such problem. Thus at- tempts are being made to study the various ferrites to evaluate the impact of substitution of the divalent metal ions to modify the properties of these oxides. Spinals are characterized by a very compact oxygen array with cations in tetrahedral (A) and octahedral (B) coordination and may be described by the IV(A1-iBi) VI(B2-iAi)O4 structural formula, where IV and VI repre- sent tetrahedrally and octahedrally coordinated sites, A and B are cations with variable valency and i the inver- sion parameter. Normal spinal are those with i = 0, in- verse spinals those with i = 1. Different synthetic roots are employed in preparation of ferrites [8-10]. High energy ball milling is a very suit- able solid state processing technique for the preparation of nanocrystalline ferrite powder exhibiting new and un- usual properties [11-14]. The objectives of the present work are 1) to prepare the Mg-Ni ferrite by ball milling 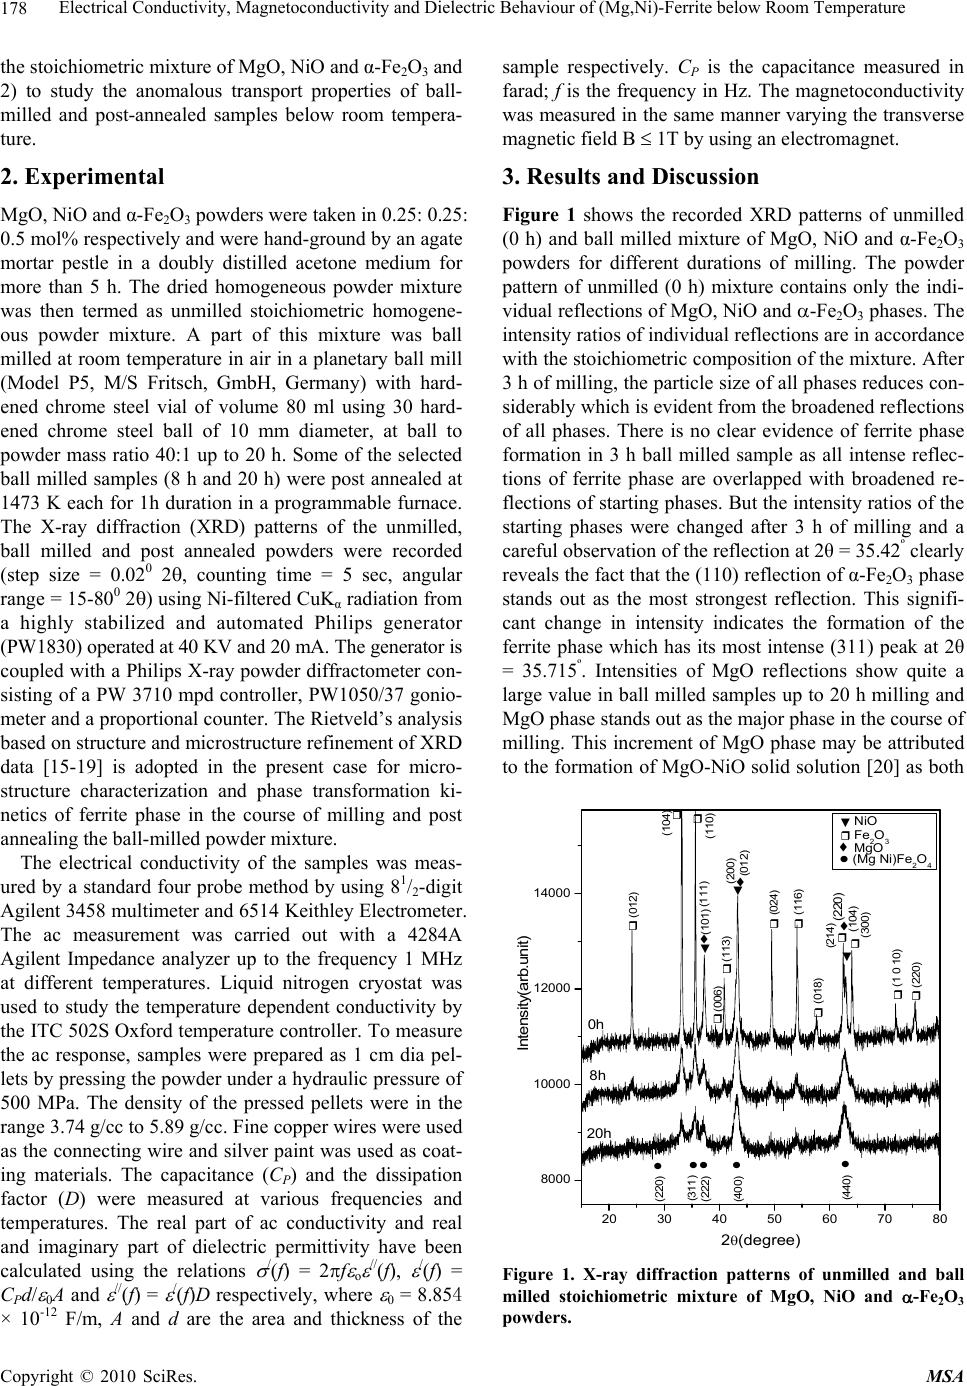 Electrical Conductivity, Magnetoconductivity and Dielectric Behaviour of (Mg,Ni)-Ferrite below Room Temperature Copyright © 2010 SciRes. MSA 178 the stoichiometric mixture of MgO, NiO and α-Fe2O3 and 2) to study the anomalous transport properties of ball- milled and post-annealed samples below room tempera- ture. 2. Experimental MgO, NiO and α-Fe2O3 powders were taken in 0.25: 0.25: 0.5 mol% respectively and were hand-ground by an agate mortar pestle in a doubly distilled acetone medium for more than 5 h. The dried homogeneous powder mixture was then termed as unmilled stoichiometric homogene- ous powder mixture. A part of this mixture was ball milled at room temperature in air in a planetary ball mill (Model P5, M/S Fritsch, GmbH, Germany) with hard- ened chrome steel vial of volume 80 ml using 30 hard- ened chrome steel ball of 10 mm diameter, at ball to powder mass ratio 40:1 up to 20 h. Some of the selected ball milled samples (8 h and 20 h) were post annealed at 1473 K each for 1h duration in a programmable furnace. The X-ray diffraction (XRD) patterns of the unmilled, ball milled and post annealed powders were recorded (step size = 0.020 2, counting time = 5 sec, angular range = 15-800 2) using Ni-filtered CuKα radiation from a highly stabilized and automated Philips generator (PW1830) operated at 40 KV and 20 mA. The generator is coupled with a Philips X-ray powder diffractometer con- sisting of a PW 3710 mpd controller, PW1050/37 gonio- meter and a proportional counter. The Rietveld’s analysis based on structure and microstructure refinement of XRD data [15-19] is adopted in the present case for micro- structure characterization and phase transformation ki- netics of ferrite phase in the course of milling and post annealing the ball-milled powder mixture. The electrical conductivity of the samples was meas- ured by a standard four probe method by using 81/2-digit Agilent 3458 multimeter and 6514 Keithley Electrometer. The ac measurement was carried out with a 4284A Agilent Impedance analyzer up to the frequency 1 MHz at different temperatures. Liquid nitrogen cryostat was used to study the temperature dependent conductivity by the ITC 502S Oxford temperature controller. To measure the ac response, samples were prepared as 1 cm dia pel- lets by pressing the powder under a hydraulic pressure of 500 MPa. The density of the pressed pellets were in the range 3.74 g/cc to 5.89 g/cc. Fine copper wires were used as the connecting wire and silver paint was used as coat- ing materials. The capacitance (CP) and the dissipation factor (D) were measured at various frequencies and temperatures. The real part of ac conductivity and real and imaginary part of dielectric permittivity have been calculated using the relations /(f) = 2f o //(f), /(f) = CPd/ 0A and //(f) = /(f)D respectively, where 0 = 8.854 × 10⁻¹² F/m, A and d are the area and thickness of the sample respectively. CP is the capacitance measured in farad; f is the frequency in Hz. The magnetoconductivity was measured in the same manner varying the transverse magnetic field B 1T by using an electromagnet. 3. Results and Discussion Figure 1 shows the recorded XRD patterns of unmilled (0 h) and ball milled mixture of MgO, NiO and α-Fe2O3 powders for different durations of milling. The powder pattern of unmilled (0 h) mixture contains only the indi- vidual reflections of MgO, NiO and -Fe2O3 phases. The intensity ratios of individual reflections are in accordance with the stoichiometric composition of the mixture. After 3 h of milling, the particle size of all phases reduces con- siderably which is evident from the broadened reflections of all phases. There is no clear evidence of ferrite phase formation in 3 h ball milled sample as all intense reflec- tions of ferrite phase are overlapped with broadened re- flections of starting phases. But the intensity ratios of the starting phases were changed after 3 h of milling and a careful observation of the reflection at 2θ = 35.42º clearly reveals the fact that the (110) reflection of α-Fe2O3 phase stands out as the most strongest reflection. This signifi- cant change in intensity indicates the formation of the ferrite phase which has its most intense (311) peak at 2θ = 35.715º. Intensities of MgO reflections show quite a large value in ball milled samples up to 20 h milling and MgO phase stands out as the major phase in the course of milling. This increment of MgO phase may be attributed to the formation of MgO-NiO solid solution [20] as both 20 30 40 50 60 70 80 8000 10000 12000 14000 (111) (440) (400) (222) (311) (220) (Mg Ni)Fe 2 O 4 (220) (200) MgO Fe 2 O 3 NiO (104) (012) (101) (220) (1 0 10) (300) (214) (018) (116) (024) (006) (113) (110) (104) (012) 0h 8h 20h Int ens i t y( ar b. un i t ) 2 (degree) Figure 1. X-ray diffraction patterns of unmilled and ball milled stoichiometric mixture of MgO, NiO and -Fe2O3 powders. 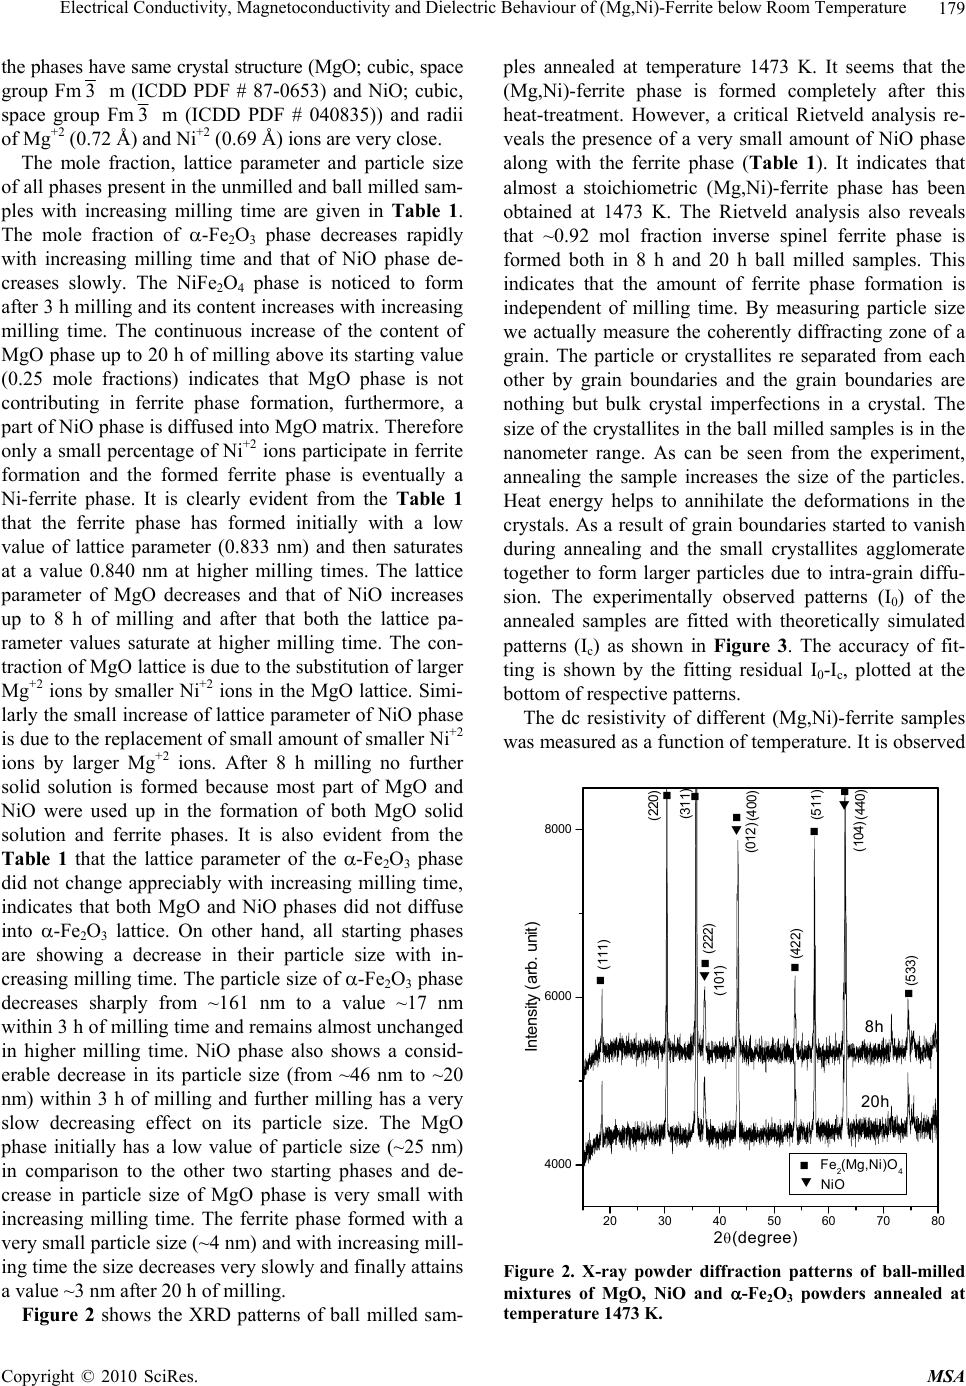 Electrical Conductivity, Magnetoconductivity and Dielectric Behaviour of (Mg,Ni)-Ferrite below Room Temperature Copyright © 2010 SciRes. MSA 179 the phases have same crystal structure (MgO; cubic, space group Fm3 m (ICDD PDF # 87-0653) and NiO; cubic, space group Fm3 m (ICDD PDF # 040835)) and radii of Mg+2 (0.72 Å) and Ni+2 (0.69 Å) ions are very close. The mole fraction, lattice parameter and particle size of all phases present in the unmilled and ball milled sam- ples with increasing milling time are given in Table 1. The mole fraction of -Fe2O3 phase decreases rapidly with increasing milling time and that of NiO phase de- creases slowly. The NiFe2O4 phase is noticed to form after 3 h milling and its content increases with increasing milling time. The continuous increase of the content of MgO phase up to 20 h of milling above its starting value (0.25 mole fractions) indicates that MgO phase is not contributing in ferrite phase formation, furthermore, a part of NiO phase is diffused into MgO matrix. Therefore only a small percentage of Ni+2 ions participate in ferrite formation and the formed ferrite phase is eventually a Ni-ferrite phase. It is clearly evident from the Table 1 that the ferrite phase has formed initially with a low value of lattice parameter (0.833 nm) and then saturates at a value 0.840 nm at higher milling times. The lattice parameter of MgO decreases and that of NiO increases up to 8 h of milling and after that both the lattice pa- rameter values saturate at higher milling time. The con- traction of MgO lattice is due to the substitution of larger Mg+2 ions by smaller Ni+2 ions in the MgO lattice. Simi- larly the small increase of lattice parameter of NiO phase is due to the replacement of small amount of smaller Ni+2 ions by larger Mg+2 ions. After 8 h milling no further solid solution is formed because most part of MgO and NiO were used up in the formation of both MgO solid solution and ferrite phases. It is also evident from the Table 1 that the lattice parameter of the -Fe2O3 phase did not change appreciably with increasing milling time, indicates that both MgO and NiO phases did not diffuse into -Fe2O3 lattice. On other hand, all starting phases are showing a decrease in their particle size with in- creasing milling time. The particle size of -Fe2O3 phase decreases sharply from ~161 nm to a value ~17 nm within 3 h of milling time and remains almost unchanged in higher milling time. NiO phase also shows a consid- erable decrease in its particle size (from ~46 nm to ~20 nm) within 3 h of milling and further milling has a very slow decreasing effect on its particle size. The MgO phase initially has a low value of particle size (~25 nm) in comparison to the other two starting phases and de- crease in particle size of MgO phase is very small with increasing milling time. The ferrite phase formed with a very small particle size (~4 nm) and with increasing mill- ing time the size decreases very slowly and finally attains a value ~3 nm after 20 h of milling. Figure 2 shows the XRD patterns of ball milled sam- ples annealed at temperature 1473 K. It seems that the (Mg,Ni)-ferrite phase is formed completely after this heat-treatment. However, a critical Rietveld analysis re- veals the presence of a very small amount of NiO phase along with the ferrite phase (Table 1). It indicates that almost a stoichiometric (Mg,Ni)-ferrite phase has been obtained at 1473 K. The Rietveld analysis also reveals that ~0.92 mol fraction inverse spinel ferrite phase is formed both in 8 h and 20 h ball milled samples. This indicates that the amount of ferrite phase formation is independent of milling time. By measuring particle size we actually measure the coherently diffracting zone of a grain. The particle or crystallites re separated from each other by grain boundaries and the grain boundaries are nothing but bulk crystal imperfections in a crystal. The size of the crystallites in the ball milled samples is in the nanometer range. As can be seen from the experiment, annealing the sample increases the size of the particles. Heat energy helps to annihilate the deformations in the crystals. As a result of grain boundaries started to vanish during annealing and the small crystallites agglomerate together to form larger particles due to intra-grain diffu- sion. The experimentally observed patterns (I0) of the annealed samples are fitted with theoretically simulated patterns (Ic) as shown in Figure 3. The accuracy of fit- ting is shown by the fitting residual I0-Ic, plotted at the bottom of respective patterns. The dc resistivity of different (Mg,Ni)-ferrite samples was measured as a function of temperature. It is observed 20 30 40 5060 70 80 4000 6000 8000 (104) (012) (222) (101) (533) (440) (422) (511) (400) (311) (220) (111) NiO Fe2(Mg,Ni)O4 8h 20h Intensity (arb. unit) 2(degree) Figure 2. X-ray powder diffraction patterns of ball-milled mixtures of MgO, NiO and -Fe2O3 powders annealed at temperature 1473 K.  Electrical Conductivity, Magnetoconductivity and Dielectric Behaviour of (Mg,Ni)-Ferrite below Room Temperature Copyright © 2010 SciRes. MSA 180 Table 1. Microstructure parameters of unmilled and ball milled (Mg,Ni)-ferrite revealed by Rietveld’s X-ray powder struc- ture refinement analysis. Lattice parameter Sample Phase Present Mole fraction a (nm) c (nm) Particle size (nm) MgO 0.2549 0.4212 25.12 NiO 0.1703 0.4177 46.72 MNF-0 h (0 h ballmilled) α- Fe2O3 0.5747 0.5035 1.3753 161.47 MgO 0.3715 0.4197 20.94 NiO 0.1102 0.4178 20.25 α- Fe2O3 0.4149 0.5038 1.3758 17.03 MNF-3 h (3 h ballmilled) NiFe2O4 0.1033 0.8330 4.44 MgO 0.3871 0.4193 15.88 NiO 0.1103 0.4180 15.61 α-Fe2O3 0.3565 0.5041 1.3761 16.08 MNF-8 h (8 h ballmilled) NiFe2O4 0.1460 0.8404 4.99 MgO 0.4589 0.4194 12.78 NiO 0.0402 0.4180 12.05 α- Fe2O3 0.1514 0.5050 1.3733 15.72 MNF-20 h (20 h ballmilled) NiFe2O4 0.3495 0.8401 2.71 Fe2(Mg,Ni)O4 0.9232 0.8357 495.49 MNF-8 h-1473 K (8 h ballmilled & annealed at 1473 K) NiO 0.0768 0.4195 217.67 Fe2(Mg,Ni)O4 0.9208 0.8353 574.44 MNF-20 h-1473 K (20 h ballmilled & annealed at 1473 K) NiO 0.0792 0.4194 211.41 that resistivity decrease with increasing temperature, which suggests the semi conducting behavior of the sam- ples. Generally in ferrite phase the conduction mecha- nism arises due to exchange of electrons between the ions of the same elements present in more than one val- ance state, more are randomly distributed over crystallo- graphic lattices site. It is well known that in spinal ferrite Ni and Mg ions prefer to occupy ‘B’ and ‘A’ sites re- spectively. The conductivity in (Mg,Ni)-ferrite may be due to electron hopping between Fe+3 Fe+2 and hole hopping between Ni+2 Ni+3 at octahedral site. The decrease in resistivity with increase in temperature is due to the increase in drift mobility of the charge carriers. The temperature dependence of resistivity found to fol- low the Arrhenius equation, 0exp a B E T K T (1) where (0) is the resistivity at infinite temperature, Ea is the activation energy, KB is the Boltzmann constant. Ac- cording to the Figure 4 the linear variation of ln[ (T)] with 1/T indicates the prevalence of a simple hopping type charge transport in all the investigated samples. The values of Ea are obtained from the slopes of the different straight lines curves in the Figure 4 (0.29 eV for MNF-8 h, 0.13 eV for MNF-8 h-1473 K, 0.36 eV for MNF-20 h, 0.12 eV for MNF-20 h-1473 K). Hence the activation energy increases by increasing milling time due to de- crease of particle size. However, it is also seen that the activation energy decreases by annealing the samples by 1473 K. This decrease of activation energy may be due to the increase of particle size where the metal core in- creases by vanishing the grain boundaries by annealing the samples. The magnetic field dependent resistivity of the sam- ples has been measured under the influence of magnetic field of strength < 1T. The variation of magnetoresistiv- ity with magnetic field at T = 300 K for different samples  Electrical Conductivity, Magnetoconductivity and Dielectric Behaviour of (Mg,Ni)-Ferrite below Room Temperature Copyright © 2010 SciRes. MSA 181 20 3040 50 60 7080 4000 6000 14000 16000 18000 20000 NiO Fe2(Mg,Ni)O4 _ . Ic I0 I0-Ic I0-Ic 8h 20h Intensity (arb.unit) 2(degree) Figure 3. Observed (.) and calculated (-) X-ray powder dif- fraction patterns of post annealed ballmilled powder mix- ture of MgO, NiO and -Fe2O3 revealed by Rietveld powder structure refinement analysis. Peak positions of phases pre- sent are shown at base line as small markers (I). is shown in Figure 5. It is observed that the room tem- perature magnetoresistivity of all samples is positive. The magnitude of the maximum percentage change of resistivities [{((B,T) − (0,T))/(0,T)} × 100] in the presence of magnetic field of 0.8 T at 300 K were ob- served about 57.4% for MNF-0 h, 24.1% for MNF-20 h and 3.4% for MNF-20 h-1473 K. It is observed that the magnetoresistivity of the investigated samples decreases with increasing the milling time and also by annealing. The measured magnetoresistivity data could be explained by simple phenomenological model that consists of two simultaneously acting hopping processes, namely the wave function shrinkage model [21,22] and the forward interference model [23-25]. The wave function shrinkage model corroborates the fact that by applying a magnetic field the wave functions of electrons are contracted and reduces the average hopping length. This corresponds to a positive magnetoresistivity (negative magnetoconduc- tivity) i.e., resistivity increases with increasing magnetic field. On the other hand, the forward interference model takes into account the effect of forward interference among random paths in the hopping process between two sites spaced at a distance equal to the optimum hopping distance and the theory predicts the negative magnetore- sistivity (positive magnetoconductivity). For the sample having small localization length, the average hopping length Rhop = (3/8)(TMott/T)1/4Lloc is small and the wave Figure 4. Temperature dependence of dc resistivity of dif- ferent (Mg,Ni)-ferrite samples. Figure 5. Variation of dc magnetoconductivity with mag- netic field at temperature T = 300 K of different samples. function shrinkage effect is dominated. But this effect is not evident in samples having large localization length, where the quantum interference effect [26,27] is domi- nated. Therefore, the sign and magnitude of the magne- toresistivity changes due to competition of the two (wave function shrinkage and quantum interference) types of contributions. As the magnetoresistivity ratio of the in- vestigated samples increases with increasing magnetic field at a temperature 300 K, we assume that the contri- bution due to wave function shrinkage model predomi- nated over the quantum interference model. So, we ana- lyzed our measured data in the light of the wave function shrinkage model. According to this model, for a small magnetic field, the magnetoconductivity ratio can be expressed by the following relationship [21] 3/ 4 24 2 12 , ln 0, loc Mott BT eL T tB TT (2) where, t1 = 5/2016 and Lloc is the localization length. Figure 5 shows a linear variation in the plot of ln [ (B,T)/ (0,T)] versus B2 for different samples. The  Electrical Conductivity, Magnetoconductivity and Dielectric Behaviour of (Mg,Ni)-Ferrite below Room Temperature Copyright © 2010 SciRes. MSA 182 points are the experimental data while the solid lines represent the best fits obtained on the basis of the wave function shrinkage model. It is evident from the Figure 5 that the experimental data can be well described by the theory as indicated in (2). It is observed from the fitting that the slope of the curves are 0.59 for MNF-0 h, 0.19 for MNF-20 h and 0.07 for MNF-20 h-1473 K samples. The slope of unmilled MNF-0 h sample is much greater than the ballmilled and annealed samples. This is because in unmilled sample, the individual phases of oxides of Fe, Ni and Mg contribute the magnetoresistivity. However in ballmilled and annealed samples, ferrite phases exist and by milling, the particle size decreases and more disorder presents in the sample. Since, in sample with higher dis- order, electronic wave functions are more localized within smaller regions resulting smaller localization length. Therefore, the lowering of slope arises due to reduction of localization length. The ac conductivity of Mg-Ni ferrite samples are in- vestigated in the frequency range 20 Hz to 1 MHz and in the temperature range 77 T 300 K. The measured data showed that the variation of conductivity with fre- quency at a particular temperature is prominent at higher frequencies, whereas at low frequencies it is almost in- dependent with frequencies, this could be attributed to the dc contribution. A general feature of amorphous semiconductors or disordered systems is that the fre- quency dependent conductivity ac(f) obeys a power law with frequency. The total conductivity /(f) at a particular temperature over a wide range of frequencies can be ex- pressed as [28-30] /() () s dc acdc f ff (3) where dc is the dc conductivity, is the temperature dependent constant and the frequency exponent s < 1. The value of ac(f) has been determined upon subtraction of the dc contribution from the total frequency dependent conductivity /(f). Figure 6 shows the linear variation of ln[ ac(f)] with ln(f) at different temperatures for the sam- ple MNF-20 h-1473 K. Similar behavior was observed for all other samples. The value of ‘s’ at each temperature has been calculated from the slope of ln[ ac(f)] versus ln(f) plot for each temperature. The trend of change in ‘s’ with temperature is shown in Figure 7 for different sam- ples. The temperature dependency of ‘s’ of disordered systems has been explained by two physical processes such as correlated barrier hopping (CBH) [30] and quan- tum mechanical tunneling (QMT) like electron tunneling (ET) [31], small polaron tunneling (SPT) [30] and large polaron tunneling (LPT) [29]. As the nature of tempera- ture dependency of ‘s’ for different conduction processes are different, the exact nature of charge transport may be obtained experimentally from the temperature variation Figure 6. Frequency dependent ac conductivity at different temperatures of MNF-20 h-1473 K sample. of the frequency exponent ‘s’. According to the corre- lated barrier hopping model ‘s’ increases with the de- crease in temperature. From the trend of change in ‘s’ with temperature for unmilled sample (MNF-0 h), it is presumed that the correlated barrier hopping is suitable. According to this model, the charge carrier hops between the sites over the potential barrier separating them and the frequency exponent ‘s’ is given by the expression [30]. 0 6 11 ln B HB kT s WkT (4) where WH is the effective barrier height and o is the characteristic relaxation time. According to (4), for large values of WH/kBT, the variation of ‘s’ with frequency is so small that it is effectively independent of frequency [32]. On the other hand, the linear variation of ln[ ac(f)] vs ln(f) in Figure 6 supports that ‘s’ is independent of frequency in our investigated samples. Therefore, we fitted experimental data with (4) as function of tempera- ture alone with WH and o as fitting parameters. In Fig- ure 7 the points represent the experimental data whereas solid lines are the theoretical best fit values obtained from (4) for MNF-0 h sample and the best fitted values of the parameters WH and o (at a fixed frequency of f = 10 KHz) are 1.16 eV and 5.97 × 10⁻¹³ S. The value of WH are, as expected, higher than the activation energy meas- ured from dc contribution and the values of the cha- racteristic relaxation time o are comparable with those that would be expected for typical inverse phonon fre- quency. Therefore, it may be concluded that the ac con- ductivity of MNF-0 h sample can be described by CBH model. But for MNF-20 h sample, ‘s’ has to increase first upto T < 150 K and then decrease with further increasing of temperature (T > 150 K). Similar trend was observed in annealed (MNF-20 h-1473 K) sample with weaker temperature dependency. Hence, the anomalous behavior  Electrical Conductivity, Magnetoconductivity and Dielectric Behaviour of (Mg,Ni)-Ferrite below Room Temperature Copyright © 2010 SciRes. MSA 183 Figure 7. Variation of frequency exponent ‘s’ with tempera- ture of different samples. of ‘s’ with temperature (T < 150 K) for MNF-20 h and MNF-20 h-1473 K cannot be understood completely with CBH model and indicates the another mechanism of transport for carriers in these investigated systems. How- ever, according to small polaron tunneling ‘s’ only in- creases with increasing temperature. We try to fit the experimental data for T < 150 K with the small polaron tunneling (SPT) theory [30], but the fit yields the un- physical values of the parameters. So the temperature dependence of ‘s’ is in conflict with SPT theory. To have a clear concept of this, we plotted the variation of /(f) with temperature for MNF-20 h-1473 K sample in the Figure 8. At a particular frequency the real part of com- plex conductivity increases with temperature and is found to follow a power law /(f) Tn, which are shown as the solid lines in Figure 8. The values of n have been calculated from the power law fitting and found to be strongly frequency dependent. With increasing frequency from 1 KHz to 1 MHz the values of ‘n’ decreases from 10.1 to 7.3 for MNF-20 h and 9.5 to 7.2 for MNF-20 h-1473 K. According to the CBH model [30] the ac con- ductivity /(f) is expressed as /(f) T2R 6 Tn with n = 2 + (1-s)ln(1/ o) for broad band limit and /(f) R 6 Tn with n = (1-s)ln(1/ o) for narrow band limit, where R = e2/{ o[WH – kBTln(1/ o)]}. We have calculated theoretically the values of ‘n’, taking o = 4.34 × 10⁻¹⁴ s and the value of s = 0.74 for 300 K and 0.79 for 77 K for MNF-20 h sample. With increasing frequency from 1 KHz to 1 MHz, the calculated values of ‘n’ varies 7.73 to 5.93 for 300 K and 6.63 to 5.17 for 77 K for broad band limit and 5.7 to 3.9 for 300 K and 4.6 to 3.2 for 77 K for narrow band limit. The experimental values did not match with the theoretical values, this indicates that both the broad band and narrow band are not suitable for ex- Figure 8. AC conductivity as a function of temperature at different frequencies of MNF-20 h-1473 K sample. plaining the temperature dependency of ac conductivity. Therefore, this observation cannot be understood com- pletely in terms of the existing theory of charge transport. Anyway, more studies are necessary to formulate the true mechanism and this experimental result may add impetus to the theoretical community to rethink this issue. The variation of real part of dielectric permittivity /(f,T) with temperature is shown in Figure 9 for differ- ent samples at f = 1 MHz. In the /-T plot there is no sharp peak till the temperature is raised to 300 K, which is the maximum temperature employed in our investiga- tion. At a particular frequency the real part of dielectric permittivity increases with temperature and is found to follow a power law /(f) Tn, which are shown as the solid lines in Figure 9. The values of n have been calcu- lated from the power law fitting and found that its value is strongly dependent on milling time and also on an- nealing temperature. Generally the ferrite exhibits inter- facial polarization due to structural inhomogeneities and existence of free charges [33]. It is thought that the hop- ping electrons at low frequencies may be trapped by the inhomogeneities. The increase of /(f) with temperature at a particular frequency is due to the drop in the resis- tance of the ferrite with increasing temperature. The low resistance promotes electron hopping, hence resulting in a larger polarizability or larger /(f). The frequency de- pendence of real part of the dielectric permittivity /(f) have also been studied for different samples and shown in Figure 10 for T = 300 K and in Figure 11 for MNF- 20 h-1473 K sample at different yet constant temperatures. A weak variation is noticed in the dielectric pemittivity at lower temperature, although a large variation of the same is observable at higher temperature for all the samples.  Electrical Conductivity, Magnetoconductivity and Dielectric Behaviour of (Mg,Ni)-Ferrite below Room Temperature Copyright © 2010 SciRes. MSA 184 Figure 9. Thermal variation of dielectric constant of differ- ent samples at 1 MHz frequency. Figure 10. Variation of dielectric constant as function of frequency at T = 300 K for different samples. Figure 11. Variation of dielectric constant as function of frequency at different temperatures of MNF-20 h-1473 K sample. At a fixed temperature, the dielectric pemittivity /(f) increase sharply with decreasing frequency and this sharp increase shifts to lower frequencies as the temperature is reduced. Such sudden increase of real part of the dielec- tric constant /(f) at low frequency can be attributed to the presence of large degree of dispersion due to charge transfer within the interfacial diffusion layer present be- tween the electrodes. The magnitude of the dielectric dispersion is temperature dependent. At lower tempera- ture, the freezing of the electric dipoles through the re- laxation process is easier. So there exists decay in po- larization with respect to the applied electric field, which is evidenced by the sharp decrease in /(f) at lower fre- quency region. When the temperature is high, the rate of polarization formed is quick and thus the relaxation oc- curs in high frequency. Due to this, the position of the sharp increase shifts towards higher frequency by in- creasing temperature. Therefore, the frequency behavior of /(f) is due to inhomogeneous nature (containing dif- ferent permittivity and conductivity regions) of the sam- ples, where the charge carriers are blocked by poorly conducting region. The effective dielectric permittivity of such inhomogeneous systems is given by Maxwell Wagner capacitor model [34-35]. The complex imped- ance of such systems can also be modeled by an ideal equivalent circuit consisting of resistance and capaci- tance due to grain and interfacial grain boundary contri- bution and it can be expressed as /// 0 1 Z ZiZ iC (5) / 22 11 ggb gggb gb RR Z RCR C (6) 22 // 22 11 gggb gb gggb gb RCR C Z RCR C (7) where sub indexes ‘g’ and ‘gb’ refer to the grain and in- terfacial grain boundary respectively, R = resistance, C = capacitance, = 2f and C0 = free space capacitance. The real part of the complex impedance have been cal- culated from the experimental data for real ( /) and imaginary ( //) part of the dielectric permittivity by using the relation Z/(f) = //(f)/[ Co( /(f)2 + //(f)2)] for different samples and analyzed by (6). Figure 12 shows the fre- quency dependence of the real part of the complex im- pedance at room temperatures for different samples. The points are the experimental data and the solid lines are the theoretical values obtained from (6). The grain and grain boundary resistances and capacitances have been extracted from this analysis at room temperature, whose values lie within the range 25 to 87 K for Rg, 0.5  Electrical Conductivity, Magnetoconductivity and Dielectric Behaviour of (Mg,Ni)-Ferrite below Room Temperature Copyright © 2010 SciRes. MSA 185 Figure 12. The real part of the complex impedance versus frequency at T = 300 K of different samples. to 1.02 M for Rgb, 0.63 to 1.56 nF for Cg and 0.43 to 0.92 nF for Cgb for different samples. It is observed from the Figure 12 that the experimental data are reasonably well fitted with the theory. It is observed that the grain capacitance (Cb) are comparable with the grain boundary capacitance (Cgb) for the investigated samples. However, the resistance due to interfacial grain boundary is much larger in compare to the grain resistance. This implies that the grain boundary contribution dominates over the grain contribution. Since the ferrites are semiconductors, the conduction process can be explained by hopping mechanism, where the carrier mobility is dominated by a factor that increases with temperature exponentially. This temperature dependent factor is controlled by thermal activation in order to overcome the potential barrier be- tween the sites by hopping. 4. Conclusions The above experimental observations suggest the foll- owing facts: 1) A Ni-ferrite phase and MgO-NiO solid solution is obtained in ball milling the powder mixtures of MgO, NiO and -Fe2O3; 2) Ni-ferrite phase is ob- tained in the ball milling process is a non-stoichiometric phase with a number of cation vacancies; 3) Particle size of Ni-ferrite phase reduces to ~3 nm within 20 h of mill- ing; 4) After annealing at 1473 K, ~0.92 mol fraction of (Mg,Ni)-ferrite phase is obtained. The dc resistivity de- creases with increasing temperature and the same follows a hopping type charge transport. The magnetoresistivity is positive and its magnitude reduces with increasing the milling time and also by annealing and it can be ex- plained by the wave function shrinkage model. The real part of the complex ac conductivity was found to follow the power law /(f) T pf s. The magnitude of the tem- perature exponent ‘p’ strongly depends on frequency and its value decreases with increasing frequency. A detailed analysis of the temperature dependence of the universal dielectric response parameter ‘s’ revealed that the corre- lated barrier hopping is the dominating charge transport mechanism for only unmilled sample, however, anoma- lous temperature dependency has been observed for ball milling and annealing samples, which cannot be ex- plained in terms of existing theory of charge transport. Anyway, more studies are necessary to formulate the true mechanism and this experimental result may add impetus to the theoretical community to think about this issue. At a particular frequency the real part of the dielectric per- mittivity was found to follow the relation /(f,T) Tn. The magnitude of the temperature exponent ‘n’ strongly depends on milling time and also on annealing tempera- ture. The frequency dependent real part of the dielectric permittivity shows large degree of dispersion at low fre- quency, but rapid polarization at high frequencies, which can be interpreted by Maxwell-Wagner capacitor model. The complex impedance of such systems can also be modelled by an ideal equivalent circuit consisting of re- sistance and capacitance due to grain and interfacial grain boundary contribution. The details analysis of this indicates that the grain and grain boundary capacitances are comparable with each other; however, the resistance due to interfacial grain boundary is much larger in com- pare to the grain resistance. 5. Acknowledgements This work has been carried out under Grant nos. F.27-1/ 2002. TS.V dated 19.03.2002 and F.28-1/2003.TS.V dated 31-03.2003 sanctioned by the MHRD, Government of India. The authors gratefully acknowledge the principal assistance received from the above organization during this work. REFERENCES [1] I. Anton., I. D. Dabata and L. Vekas, “Application Orien- tated Researches on Magnetic Fluids,” Journal of Mag- netism and Magnetic Materials, Vol. 85, No. 1-3, 1990, pp. 219-226. [2] R. D. McMickael, R. D. Shull, L. J. Swartzendruber, L. H. Bennett and R. E. Watson, “Magnetocaloric Effect in Su- perparamagnets,” Journal of Magnetism and Magnetic Materials, Vol. 111, No. 1-2, 1992, pp. 29-33. [3] D. L. Leslie-Pelecky and R. D. Rieke,” Magnetic Proper- ties of Nanostructures Materials,” Chemistry of Materials, Vol. 8, No. 8, 1996, pp. 1770-1783. [4] T. Hirai, J. Kobayashi and I. Koasawa, “Preparation of Acicular Ferrite Fine Particles Using an Emulsion Liquid  Electrical Conductivity, Magnetoconductivity and Dielectric Behaviour of (Mg,Ni)-Ferrite below Room Temperature Copyright © 2010 SciRes. MSA 186 Membrane System,” Langmuir, Vol. 15, No. 19, 1999, pp. 6291-6298. [5] R. H. Kodama, “Magnetic Nanoparticles,” Journal of Magnetism and Magnetic Materials, Vol. 200, No. 1-3, 1999, pp. 359-372. [6] K. V. P. M. Shafi, Y. Koltypin, A. Gedanken, R. Pro- zorov, J. Balogh, J. Lendvai and I. Felner, “Sonochemical Preparation of Nanosized Amorphous NiFe2O4 Particles,” The Journal of Physical Chemistry B, Vol. 101, No. 33, 1996, pp. 6409-6414. [7] D. Niznansky, M. Drillon and J. L. Renspinger, “Prepara- tion of Magnetic Nanoparticles (γ-Fe2O3) in the Silica Matrix,” IEEE Transaction on Magnetics, Vol. 30, No. 2, 1994, pp. 821-823. [8] J. M. Yang, W. J. Tsuo and F. S. J. Yen, “Preparation of Ultrafine Nickel Ferrite Powder Using Ni and Fe Tar- trates,” Journal of Solid State Chemistry, Vol. 145, No. 1, 1999, pp. 50-57. [9] Y. Shi, J. Ding, X. Liu and J. Wang, “NiFe2O4 Ultrafine Particles Prepared by Co-Precipitation/Mechanical Al- loying,” Journal of Magnetism and Magnetic Materials, Vol. 205, No. 2-3, 1999, pp. 249-254. [10] P. Druska, U. Steinike and V. Sepelak, “Surface Structure of Mechanically Activated and of Mechanosynthesized Zinc Ferrite,” Journal of Solid State Chemistry, Vol. 146, No. 1, 1999, pp. 13-21. [11] V. Sepelak, K. Tkacova, V. V. Boldyrev and U. Steinike, “Crystal Srtucture Refinement of the Mechanically Acti- vated Spinel-Ferrite,” Materials Science Forum, Vol. 228-231, 1996, pp. 783-788. [12] V. Sepelak, A. Yu, U. Rogachev, D. Steinike, C. Uecker, S. Wibmann and K. D. Becker, “Structure of Nanocrys- talline Spinel Ferrite Produced by High Energy Ballmilling Method,” Acta Crystallographica A, Vol. A 52, No. (Suppl.), 1996, p. C367 [13] V. Sepelak, A. Yu, U. Rogachev, D. Steinike, C. Uecker, F. Krumcich, S .Wibmann and K. D. Becker, “The Syn- thesis and Structure of Nanocrystalline Spinel Ferrite Pro- duced by High Energy Ball-Milling Method,” Materials Science Forum, Vol. 235-238, 1997, pp. 139-144. [14] V. Sepelak, U. Steinike, D. C. Uecker, S. Wibmann and K. D. Becker, “Structural Disorder in Mechanosynthe- sized by Zinc Ferrite,” Journal of Solid State Chemistry, Vol. 135, No. 1, 1998, pp. 52-58. [15] H. M. Rietveld, “Line Profile of Neutron Powder Diffrac- tion Peaks for Structure Refinement,” Acta Crystal- lographica, Vol. 22, 1967, pp. 151-152. [16] H. M. Rietveld, “A Profile Refinement Method for Nu- clear and Magnetic Structures,” Journal of Applied Crys- tallography, Vol. 2, 1969, pp. 65-71. [17] R. A. Young, “The Rietveld Method,” Oxford University Press, Oxford, 1996. [18] L. Lutterotti, P. Scardi and P. Maistrelli, “LSI-a Com- puter Program for Simultaneous Refinement of Material Structure and Microstructure,” Journal of Applied Crys- tallography, Vol. 25, No. 3, 1992, pp. 459-462. [19] L. Lutterotti, “MAUD Version 2.046.” http://www.ing. unitn. it/~luttero/maud [20] W. D. Kingery, H. K. Bowen and D. R. Uhlmann, “In- troduction to Ceramics,” 2nd Edition, John Wiley and Sons, New York, 1976. [21] B. I. Shklovskii, “Positive Magnetoresistance in the Vari- able Range Hopping Conduction Regimes,” Soviet Phys- ics Semiconductors, Vol. 17, 1983, p. 1311. [22] B. I. Shklovskii and A. L. Efros, “Electronic Properties of Doped Semiconductors,” Springer, Berlin, 1994. [23] V. L. Nguyen, B. Z. Spivak and B. I. Shklovskii, “Tunnel Hops in Disordered Systems,” Soviet Physics-JETP, Vol. 62, 1985, p. 1021. [24] U. Sivan, O. Entin-Wohiman and O. Imry, “Orbital Mag- netoconduction in the Variable-Range-Hopping Regime,” Physical Review Letters, Vol. 60, No. 15, 1988, pp. 1566-1569. [25] R. Rosenbaum, A. Milner, S. Hannens, T. Murphy, E. Palm and B. Brandt, “Magnetoresistance of an Insulating Amorphous Nickel-Silicon Film in Large Magnetic Fields,” Physica B, Vol. 294-295, 2001, pp. 340-346. [26] M. S. Fuhrer, W. Holmes, P. L. Richards, P. Delaney, S. G. Louie and A. Zettl, “Nonlinear Transport and Local- ization in Single Walled Carbon Nanotubes,” Synthetic Metals, Vol. 103, No. 1-3, 1999, pp. 2529-2532. [27] Y. Yosida and I. Oguro, “Variable Range Hopping Con- duction in Bulk Samples Composed of Single Walled Carbon Nanotubes,” Journal of Applied Physics, Vol. 86, No. 2, 1999, pp. 999-1003. [28] N. F. Mott and E. Davis, “Electronic Process in Noncrys- talline Materials,” 2nd Edition, Clarendon, Clarendo, 1997. [29] A. R. Long, “Frequency-Dependent Lossin Amorphous Semi-Conductors,” Advances in Physics, Vol. 31, No. 5, 1982, pp. 553-637. [30] S. R. Elliott, “a.c. Conduction in Amorphous Chalco- genide and Pnictide Semiconductors,” Advances in Phys- ics, Vol. 36, No. 2, 1987, pp. 135-217. [31] A. L. Efros, “On the Theory of a.c. Conduction in Amor- phous Semiconductors and Chalcogenide Glasses,” Phi- losophical Magazine B, Vol. 43, No. 5, 1981, pp. 829-838. [32] M. Ghosh, A. Barman, S. K. De and S. Chatterjee, “Transport Properties of Hcl Doped Polyaniline and Poly- aniline-Methyl Cellulose Dispersion,” Journal of Applied Physics, Vol. 84, No. 2, 1998, pp. 806-811. [33] B. G. Soares, M. E. Leyva, G. M. O. Barra and D. Khast- gir, “Dielectric Behaviour of Polyaniline Synthesized by Different Techniques,” European Polymer Journal, Vol. 42, No. 3, 2006, pp. 676-686. [34] S. S. Suryavanshi, S. R. Patil, S. A. Patil and S. R. Sa- want, “d.c. Conductivity and Dielectric Behaviour of Ti4+ Substituted Mg-Zn Ferrites,” Journal of the Less-Com- mon Metals, Vol. 168, No. 2, 1991, pp. 169-174.. [35] J. C. Maxwell, “A Treatise on Electricity and Magnet- ism,” Vol. 1, Oxford University Press, Oxford, 1988. |