Paper Menu >>
Journal Menu >>
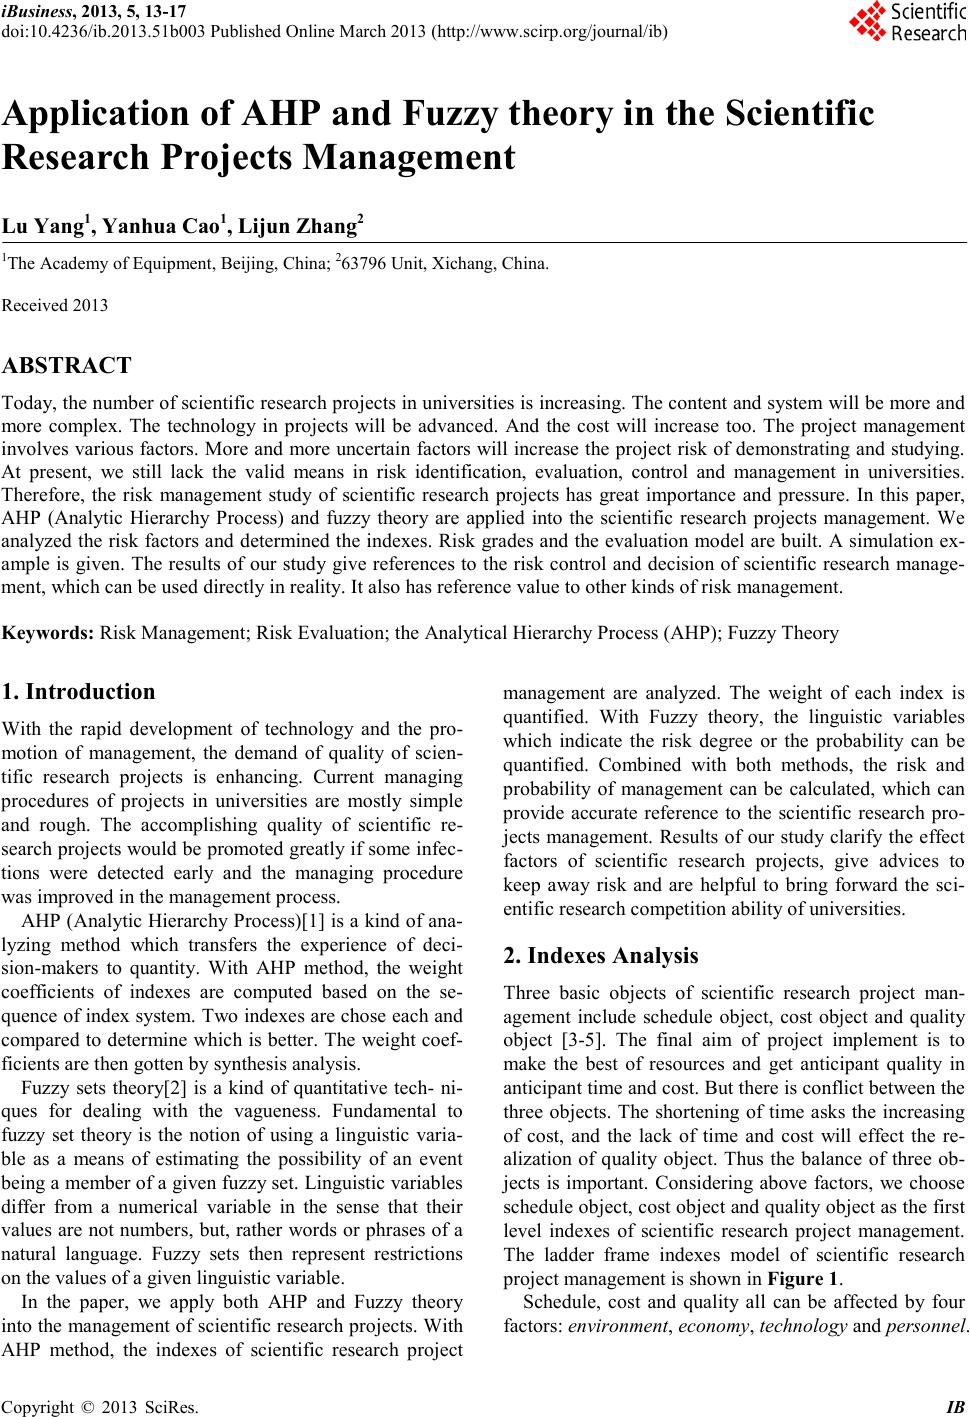 iBusiness, 2013, 5, 13-17 doi:10.4236/ib.2013.51b003 Published Online March 2013 (http://www.scirp.org/journal/ib) Copyright © 2013 SciRes. IB 13 Application of AHP and Fuzzy theory in the Scientific Research Projects Man agem en t Lu Yang1, Yanhua Cao1, Lijun Zhang2 1The Academy of Equipment, Beijing, China; 263796 Uni t , Xic ha n g, China. Received 2013 ABSTRACT Today, the n umber of scientific research projects in universities is increasing. T he content and system will be more and more complex. The technology in projects will be advanced. And the cost will increase too. The project management invol ves vari ous facto rs. More and more uncertain factors will increase the project risk of demonstrating and studying. At present, we still lack the valid means in risk identification, evaluation, control and management in universities. Therefore, the risk management study of scientific research projects has great importance and pressure. In this paper, AHP (Analytic Hierarchy Process) and fuzzy theory are applied into the scientific research projects management. We analyzed the risk factors and determined the indexes. Risk grades and the evaluatio n mo del are built. A si mulatio n ex- ample is given. The results of our study give references to the risk control and decision of scientific research manage- ment, which can be used directly in reality. It also has reference value to other kinds of risk management. Keywords: Risk Manage ment; R isk E valuation; the Analytical Hierarchy Process (AHP); Fuzzy T heory 1. Introduction With the rapid development of technology and the pro- motion of management, the demand of quality of scien- tific research projects is enhancing. Current managing procedures of projects in universities are mostly simple and rough. The accomplishing quality of scientific re- search projects would be p romoted greatly if some infec- tions were detected early and the managing procedure was improved in the management proc ess. AHP (Analytic Hierarchy Process)[1] is a kind of ana- lyzing method which transfers the experience of deci- sion-make rs to quantity. With AHP method, the weight coefficients of indexes are computed based on the se- quence of inde x syste m. Two ind exes are chose each and compared to determine which is better. The weight coef- ficients a re then gotten b y synthesis analysis. Fuzzy sets theory[2] is a kind of quantitative tech- ni- ques for dealing with the vagueness. Fundamental to fuzzy set theory is the notion of using a linguistic varia- ble as a means of estimating the possibility of an event being a member of a given fuzz y set. Linguistic variables differ from a numerical variable in the sense that their value s are not numbers, but, rather words or phrases of a natural language. Fuzzy sets then represent restrictions on the values of a give n l inguist ic variable. In the paper, we apply both AHP and Fuzzy theory into the management of scientific research projects. With AHP method, the indexes of scientific research project management are analyzed. The weight of each index is quantified. With Fuzzy theory, the linguistic variables which indicate the risk degree or the probability can be quantified. Combined with both methods, the risk and probability of management can be calculated, which can provide accurate reference to the scientific research pro- jects management. Re sults of our study clarify the effec t factors of scientific research projects, give advices to keep away risk and are helpful to bring forward the sci- entific research competition ability of universities. 2. Indexes Analysis Three basic objects of scientific research project man- agement include schedule object, cost object and quality object [3-5]. The final aim of project implement is to make the best of resources and get anticip ant quality in anticipant time and cost. But there is conflict bet ween the three objects. The shortening of time asks the increasing of cost, and the lack of time and cost will effect the re- alization of quality object. Thus the b alance of three ob- jects is important. Considering above factors, we choose schedule obj ect, cost object and quality obj ect as the first level indexes of scientific research project management. The ladder frame indexes model of scientific research project management is shown in Figure 1. Schedule, cost and quality all can be affected by four factors: environment, economy, technology and personnel.  Application of AHP and Fuzzy theory in the Scientific Research Projects Management Copyright © 2013 SciRes. IB 14 Thus, they are selected as the indexes in the second level. Figure 1. The ladder frame indexes model of scientific re- search project manag ement. Environment factors include natural environment, so- cial environment and research environment. The chang- ing of environment can bring uncontrolled risk to the scientific research project, such as earthquake, war, law amending and so on. Economy factors include fund budget, price fluctua- tion and fund utilization. The utilizatio n of budge t fund has been considered as an important index in scientific research projects examining. If funds carried out were too low, it would be seen as makin g a false report of fund or lacking related research, which would have bad influ- ence on future project approval. Otherwise, if f unds were overspent, it would be seen as not worthy or irrational i mpl eme n t. Technology factors include validity, c o mplexity, ma- turity and relevancy. Scientific research project always has difficulty and risk. The quality of project is usually connected with the technology measures used. The risk of project, especially the technology measures, shall be paid enough importanc e on at the be ginn ing. Personnel factors include professional capability, working attitude, relative experience and staff fluxion. It’s very important to exert the individual initiative in research. Better state of personnel is helpful for the ac- complishment of scientific research project at shorter time and in lo wer c ost. 3. Weight Quanti fication with AHP AHP method is applied to quantify the indexes’ weights of scientific research project management. We use 1-9 markers for experts’ scoring to build the relative weight matr ix between each two indexes. The meanings of 1-9 markers are shown in Table 1 . T he random index C.R. is sho wn in Tabl e 2 which will be used in this paper [1]. Co mpa ring o ne ind ex wit h ano ther, the j udgi ng mat rix A(aij) can be obtained. Each element aij in the matrix in- dicates the relative importance of inde x Ai compared with index Aj according to 1-9 mar kers in Table 2. Table 1. The meanings of 1-9 markers. Marker Meanings 1 Compared both factor s, they h ave the sa me weigh t. 3 Compared both factors, one is slightly more important than an other. 5 Compared both factors, one is clearly more imp ortant than an other. 7 Compared both factors, one is intensively mor e impor- tant than another. 9 Compared both factors, one is absolutely more impor- tant than another. 2,4,6,8 The middle value bet wee n two above-mentioned neighboring values. reciprocal If bij is the judging result when i is compared with j, bji=1/ bij is the judging result when j is c ompared with i. Talbe 2. The random index C. R. n 1 2 3 4 5 6 7 8 9 10 11 C.R. 0 0 0.58 0.9 1.12 1.24 1.32 1.41 1.45 1.49 1.51 In the first level, we take schedule as A1, cost as A2 and quality as A3. Generally speaking, quality is slightly more important than cost and schedule. Cost is sli g htl y more impo rtant t han sc hedule . Ac cor ding to our understanding, we get the judging matrix A as follows. = 134 3/113 4/13/11 A In the second level of Table 1, we have four indexes which is environment (B1), economy (B2), technology (B3) and personnel (B4). Similarly, compared these indexes with each other separately for the three factors in the first level, we get the judging matrixes A1, A2 and A3 as fol- lows . = 123/14/1 2/115/15/1 3513/1 4531 1 A = 12/14/12 213/13 4315 2/13/15/11 2 A = 12/135 2125 3/12/113 5/15/13/11 3 A The second level objects of environment (B1), economy (B2), technology (B3) and personnel (B4) are still affected by the factors such as natural environment (C1), social  Application of AHP and Fuzzy theory in the Scientific Research Projects Management opyright © 2013 SciRes. IB 15 environment (C2), research environment (C3), fund budget (D1), price fluctuation (D2), fund utilization (D3), validity (E1), comp le xity (E2), ma tu rity (E3), relevancy (E4), professional capability (F1), working attitude (F2), relative experience (F3) and staff fluxion (F4). Compared these factor with each other further, we get the judging matrixes B1, B2, B3 and B4. = 13/12 312 22/11 1 B = 153 5/113/1 3/131 2 B = 1322/1 3/112/15/1 2/1214/1 2541 3 B = 123/12/1 2/117/13/1 3712 232/11 4 B The eigenvectors can be computed according to the judging matrixes we got above. First we transfer the jud ging matrix A to a new matrix X. Then eigenvector W can be got from matrix X. The elements xi in X and wi in W have special relation with the elements aij in A as fol- lows . ∑ = = n jiji a n x 1 1 , n is the size of matrix A. ∑ = = n iiii x/xw 1 Thus the eigenvectors W, W1, W2, W3, WB1, WB2, WB3 and WB4 of judging matrixes A, A1, A2, A3, B1, B2, B3 and B4 is obtained. = 5749.0 3114.0 1138.0 W , = 1288.0 0683.0 3355.0 4673.0 1 W , = 1493.0 2522.0 5176.0 0810.0 2 W , = 3645.0 3836.0 1854.0 0665.0 3 W , = 1618.0 5294.0 3088.0 1B W , = 6054.0 1031.0 2915.0 2B W , = 2677.0 0837.0 1544.0 4942.0 3B W , = 1515.0 0781.0 5136.0 2568.0 4B W During the building process of judging matrixes, the jud gme nt may conflict with each other co n sideri ng p eople’s subjective understanding. In order to assur e the validity of ana lysis, we check up the consistency as fo llows. =⋅ 9641.1 8443.0 3613.0 WA , 1012.3) 5749.0 9641.1 3114.0 8443.0 1138.0 3613.0 ( 3 1 max =++= λ 0506.0.. =IC According to Table 3, the random index C.R. is set as 0.58. The consis tency index CR is computed as follows. 1.00872.0 58.0 0506.0 .. .. <=== RC IC CR Since CR < 0.1, It indicates that the consistency of judging matrix A is acceptable and the weight eigenvec- tor W are rational. Similarl y, we compute the consistency indexes of other judging matrixes. The consistency in- dexes CR are 0.0695, 0.0244, 0.0596, 0.0477, 0.0107 and 0.0052 corresponding to A1, A2, A3, B1, B2, B3 and B4. Thus, the eigenvectors W1, W2, W3, WB1, WB2, WB3 and WB4 are all acceptable and can be taken as the weight of each risk factor. 4. Risk Analysis with Fuzzy Theory Risk e valuatio n is an i mpor tant co ntent in t he risk ana ly- sis of scientific research project management. Besides the risk indexes, we need to confirm the risk probability degree and harm degree [6-7]. We usually use linguistic variables to state the probability and harm of various risks, such as “very likely to happen”, “contingently to happen”, “infrequently to happen”, “very harmful”, “slightly harmful”, “harml ess” and so on. Thus, we clas- sify both probability and harm degree into five grades as A, B, C, D and E shown in Table 3 . According to the five grades, the risk factors of envi- ronment, economy, technology and personnel and their junior risk factors can all be described by similar mode. Experts’ scoring method can be used to obtain the lin- guistic variables as inputs. Each expert e valuates whether risk factor Ai (i=1,2,…,m) belongs to risk grade Dj (j=1,2,…,n). Then, the evaluation matrix R(rij) can be obtained. The matri x element rij is computed a s follows. experts ofnumber totalThe grade tobelongs factor risk consider whoexperts ofnumber Theji rij= Table 3. The risk grades ( include probability and harm ) descri ption. grade Risk pro babili ty (quantitative ran ge) Risk harm (quantitative ran ge) A Frequently (100%~80%) Very harmful (100%~80%) B Very likely (80%~60%) Rather harm ful (80%~60%)  Application of AHP and Fuzzy theory in the Scientific Research Projects Management Copyright © 2013 SciRes. IB 16 C Likely (60%~40%) Generally harmful (60%~40%) D Contingently (40%~20%) Slightly harmful (40%~20%) E Infrequently (20%~0) Rarely harmful (20 %~0) = mnmm n n rrr rrr rrr R 21 22221 11211 Co mbi ning e valua tion matri x R with weig ht matrix W, we can get the fuzzy evaluat ion set B. ],,,[],,,[ 21 21 22221 11211 21n mnmm n n mbbb rrr rrr rrr wwwRWB = ⋅=⋅= ],,,[ 21 n bbbB = , ∑ = =n ii i ib b b 1 In the formu la above, B is the fuzzy synthesis judg- ing matrix and )1( nib i = is the fuzzy synthesis judging index. Here is a simulation example. Supposing there are five experts scoring to an scientific research project. Their evalua tion re sults o f inde xes Ai (i=1, 2,…, 14) are shown in Table 4. The risk prob ability evaluation matrix RD and the harm evaluation matrix RH is shown as fo llows: = 8.00002.0006.002.0004.01 2.00004.002.04.02.08.02.006.00 06.04.04.04.06.06.004.006.04.000 04.06.04.004.02.004.002.04.000 0002.000000002.000 D R = 0000000002.00000 6.08.0004.02.00006.006.04.00 4.02.02.04.06.04.06.06.02.02.06.04.04.02.0 004.04.004.04.04.06.004.002.06.0 004.02.000002.000002.0 H R Table 4. The evaluation r esults of experts. Risk probability (number of experts) Risk harm (number of experts) A B C D E A B C D E Natural environment 0 0 0 0 5 1 3 1 0 0 Social environment 0 0 0 3 2 0 1 2 2 0 Research environment 1 2 2 0 0 0 0 2 3 0 Fund budge t 0 1 3 1 0 0 2 3 0 0 Price fluctuation 0 0 0 4 1 0 0 1 3 1 Fund utilization 0 2 2 1 0 1 3 1 0 0 Validity 0 0 0 2 3 0 2 3 0 0 Complexity 0 1 3 1 0 0 2 3 0 0 Maturity 0 2 3 0 0 0 2 2 1 0 Relevancy 0 0 2 2 1 0 0 3 2 0 Professional capability 1 2 2 0 0 1 2 2 0 0 Working attitude 0 3 2 0 0 2 2 1 0 0 Rela ti ve ex perience 0 2 3 0 0 0 0 1 4 0 Staff fluxion 0 0 0 1 4 0 0 2 3 0 According to the formula above, we obtain the total probability fuzzy synthesis judging matrix TBD and the har m fuzz y synthesis j ud gin g ma tr i x TBH of the project.  Application of AHP and Fuzzy theory in the Scientific Research Projects Management opyright © 2013 SciRes. IB 17 = 2072.0 2284.0 3080.0 2389.0 0177.0 D TB , = 0063.0 1345.0 3915.0 3541.0 1138.0 H TB , Choosing the ma x imu m value in each matrix as the final result, it is seen that the total risk probability of the project is 30.8% and the total harm degree is 39.15%. REFERENCES [1] G. Eason, B. Noble, and I. N. Sneddon, “On certain inte- grals of Lipschitz-Hankel type involving products of Bessel functions,” Phil. Trans. Roy. Soc. London, vol. A247, pp. 52 9–551, Apri l 1955. (references) [2] Jian-ming Shen, “Project Risk Management”. Beijing: Press of mechanical industry. (2003) 110-121. (in Chinese) [3] Zad eh L A, “Fuzzy Sets. Information and Control”. No. 8 (1965) 338-353. [4] Bennet P. Lientz, Kathryn. Rea, “Project Management”. For the 21st Century.Third Edition. California: Academic Press . (2002). [5] Blanchard B S, “Logistics Engineering and Manage- ment”.5th ed. New York: Prentice Hall. (1998). [6] Blanchard B S, “System engineering management”. John Wiley & Sons. New York. (1997). [7] Neil J. Tuholski, Henrik Gluver. Etc, “Risk Assessment Procedures for Innovative of Navigation”. U.S. Army corps of Engineers. Washington, DC. (2000)12. [8] The PMI Standards Committee, “A Guide to the Project Management Body of Knowledge”. Philadelphia: project Management Institute. (1994). |