Paper Menu >>
Journal Menu >>
 Journal of Software Engineering and Applications, 2013, 6, 42-47 doi:10.4236/jsea.2013.63b010 Published Online March 2013 (http://www.scirp.org/journal/jsea) Copyright © 2013 SciRes. JSEA A Novel Model Calculated Distribution Systems Planning Intergrated Distribution Generators for Competitive Electricity Markets V. V. Thang1, N. T. D. Thuy1, D. Q. Thong2, B. Q. Khanh2 1Department of Electric Power Systems, Thainguyen University of Technology (TNUT), Thainguyen, Vietnam; 2Department of Electric Power Systems, Hanoi University of Science and Technology (HUST), Hanoi, Vietnam. Email: thangvvhtd@tnut.edu.vn, bq_khanh-htd@mail.hut.edu.vn Received 2013 ABSTRACT Recently, the distributed generator (DG) has been successfully studied and applied in distribution system at many coun- tries around the world. Many planning models of the DG integrated distribution system have been proposed. These models can choose the optimization locations, capacities and technologies of DG with the objective function minimiz- ing power loss, investment costs or total life cycle costs of the investment project. However, capacity of DG that uses renewable energy resources is natural variability according to primary energy. This study proposed a planning model of optimized distribution system that integrates DG in the competitive electricity market. Model can determine equipment sizing and timeframe requiring for upgrading equipment of distribution system as well as select DG technologies with power variable constraints of DG. The objective function is minimizing total life cycle cost of the investment project. The proposed model is calculated and tested for a 48-bus radial distribution system in the GAMS programming lan- guage. Keywords: Competitive Electricity Markets (CEM); Distributed Generators (DG); Distribution Systems (DS) Planning 1. Introduction In the past decade, distribution system planning had ma- jor changed due to the impact of competitive electricity market, DG technological development and environ- mental pollutions. In particular, DG connecting directly to DS or directly supplying to customers is used as a popular planning approach. These sources normally use electric generating technologies such as gas turbines, combined heat and power, Fuel Cells, solar energy and wind energies. Therefore, the benefits of DG including reduction of transmission and distribution cost, power loss and enhancement of flexibility and reliability of DS, improvement of differential voltage at nodes as well as reduction of environmental pollution [1]. However, DG requires high investment, makes increasing the complex- ity in measurement and relay protection as well as opera- tion of DS [2]. Besides, DG using renewable energy re- sources has the naturally variable power according to primary energy. Many planning models of the DG integrated distribu- tion system are already been researched and proposed. The authors in [3] presented a long-term DS planning model in order to determine capacity, location and a new building investment process or to upgrade current equipments by using popular mathematical programming. The objectives of model are the minimum total of in- vestment and operation costs of DG, the investing cost for feeder and substation transformers during planning period. The details of DG technology is not mentioned because of the assumption that the costing functions and effects of DG in DS planning are the same, but these are impossible in reality. Another model in [4] was proposed with the objective function including the total investing and operating costs of DG, feeders and substation trans- formers upgrading costs, energy expenses and minimum interruptible load costs. In this research, effects of DG technology are also not mentioned in selecting variables. The objective function of the two-stage DS planning model in [5] includes the minimum of total costs for up- grading feeders, substation transformers and DG con- struction, energy expenses purchased from market and environmental pollution costs. Similarly, [6] introduced a DS planning model determining optimized equipment sizing and timeframe required for DS upgrading. The selection issues optimal displacement, sizing, installation period and technology of DG to meet the demand growth are presented in [6]. In previous studies, the power of DG  A Novel Model Calculated Distribution Systems Planning Intergrated Distribution Generators for Competitive Electricity Markets Copyright © 2013 SciRes. JSEA 43 is always assumed to be constant without regarding to the natural variability of DG capacity which depends on the primary energy, this is not practical. Therefore, this paper proposes an optimized DS planning model that integrates output power characteristics of DG in the CEM. The next parts of this paper are organized as follows. Section II introduces a mathematical model with objec- tive function and constraints. Section III shows calcula- tion results from the 48-bus DS. Conclusion is presented in Section IV 2. The Mathematical Model In competitive electricity market, DS are managed by distribution companies. These companies can buy elec- trical energy completely from electricity market or com- bine with investing DG in order to meet load demands in future. So, economic and technical indices of planning project are changed which affects considerably to time, upgrading capacity of feeders and substations when DG are chosen in DS planning. 2.1. Objective Function The objective function of proposed model is to minimize total life cycle cost of the investment project during cal- culation period as shown in Equation (1). ,, , 11 ,,, 111 ,,, ,,, 1 , ,,,,,,,, , 1.( .) (1 ) (.) . (. ...) (. . TNN FFFC Fijtij t tij NSNDG KDG SFSC SDGDG itk ikt iik NS SSHQS PS SS sPh isthQisth h ish QDG PDG DGDG skh iksthiksth kh JCCSL r CCS CS kkP kQ kP Q ① ②③ ④ 11 ) ,,, ,, NDG KDG SSH iksh Min ijNkKDGsSShHt T ⑤ (1) where: Components in are upgrading costs of feeders for year t with fixed capital cost (CFF) and variable capi- tal cost (CFC); Substation transformers upgrading costs in year t with fixed capital cost (CSF) and variable capital cost (CSC) in ; are new investment costs in year t with technologies k of DG; Electrical energy purchased cost from electricity market in and are fuel, opera- tion and maintenance costs of DG depending per tech- nology k, operation season s and time h; 1/(1 )t r cal- culated total cost at base year with discount rate r. 2.2. The Constraints 1) Contraints for nodal power balance The output power characteristics of each DG technol- ogy using renewable energy resources fluctuate by time of day and season in year so the power of DG is also de- termined by each hour, season and specially, each tech- nology k of DG. Therefore, constraint of nodal power balance of the model proposed in the new conditions is expressed as shown in(2). ,,,,,,,,,, 1 , ,,,,,,,,,,,,, 1 , ,,,,,,,,, 1 , ,,,,,,,,,,,,, 1 .. .cos() .. .sin() KNG DG S iksth isthisth k N ijti sthjst hijtj st hi sth j KNGDG S iksth isthisth k N ijtisthjsthijtjsth isth j PPPD YU U QQQD YU U ,,, ,,ijNkKDGsSSh HtT (2) 2) Constraints of DG capacity limit These constraints allow computed DG capacity at nodes in limit of DG technology, and it ensures annually upgrading power corresponding to equipment parameters as shown in (3). ,, max,,,max, ,,,, 1,,,, 1 0,0 , 1, , DG DGDGDG ikt kiktk DG DGDGDG ikt iktiktikt PP QQ P PP QQQ tiNDG kKDG (3) 3) Constraints of feeders capacity limits The feeders upgrading constraints and upgrading power satisfying equipment parameters are shown in(4). ,,0ij,ij,,,, ,0 , (), () 1, ,,,, F FFFF FF ij tijts thij tij SSSmaxSS SS tijNtTsSShH (4) 4) Constraints of substation transformers capacity lim- its These constraints allow to maximize the use of exist- ing substation transformers capacity and to satisfy up- grading power corresponding to equipment parameters as(5). ,,0, ,,,,,1 ., (), 1,, ,, SSS SSSS i tptiiti s thi ti t SkSSmaxS SSS tiNStTsSShH (5) 5) Constraints of limited nodal voltage Technical requirement constraints of limited nodal voltage are given in equation(6). Voltages at substation nodes are assumed constantly. min,,,max ,,, ,,, ,,, isth isth UU UiNLsSStThH UconstaniNSsSS tThH (6) The proposed planning model is a Nonlinear Pro- 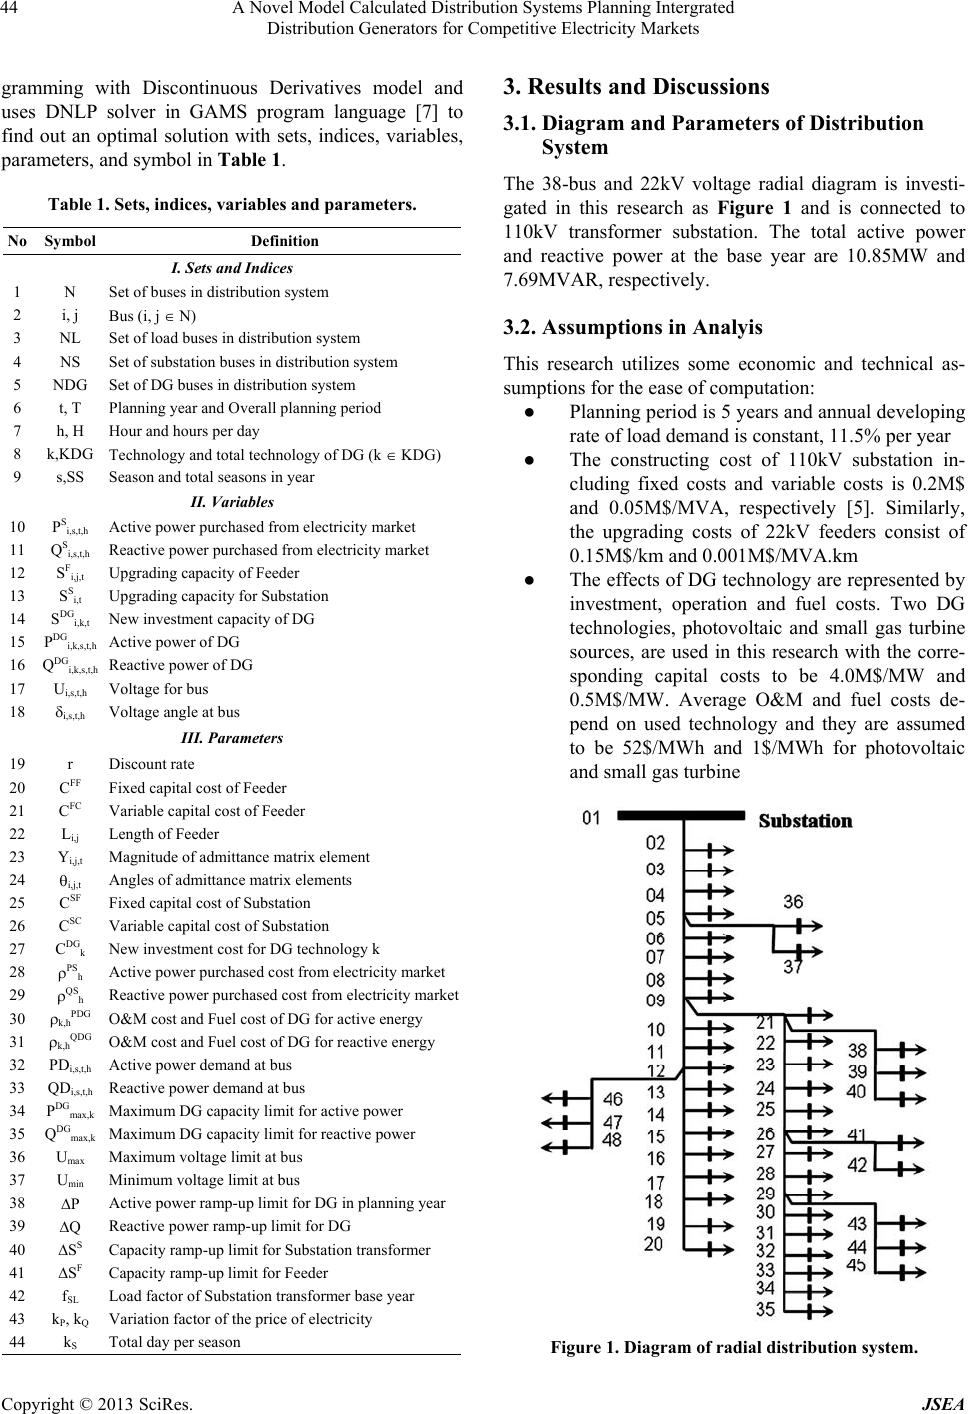 A Novel Model Calculated Distribution Systems Planning Intergrated Distribution Generators for Competitive Electricity Markets Copyright © 2013 SciRes. JSEA 44 gramming with Discontinuous Derivatives model and uses DNLP solver in GAMS program language [7] to find out an optimal solution with sets, indices, variables, parameters, and symbol in Table 1. Table 1. Sets, indices, variables and parameter s. No Symbol Definition I. Sets and Indices 1 N Set of buses in distribution system 2 i, j Bus (i, j N) 3 NL Set of load buses in distribution system 4 NS Set of substation buses in distribution system 5 NDG Set of DG buses in distribution system 6 t, T Planning year and Overall planning period 7 h, H Hour and hours per day 8 k,KDG Technology and total technology of DG (k KDG) 9 s,SS Season and total seasons in year II. Variables 10 PSi,s,t,h Active power purchased from electricity market 11 QSi,s,t,h Reactive power purchased from electricity market 12 SFi,j,t Upgrading capacity of Feeder 13 SSi,t Upgrading capacity for Substation 14 SDGi,k,t New investment capacity of DG 15 PDGi,k,s,t,h Active power of DG 16 QDGi,k,s,t,h Reactive power of DG 17 Ui,s,t,h Voltage for bus 18 i,s,t,h Voltage angle at bus III. Parameters 19 r Discount rate 20 CFF Fixed capital cost of Feeder 21 CFC Variable capital cost of Feeder 22 Li,j Length of Feeder 23 Yi,j,t Magnitude of admittance matrix element 24 i,j,t Angles of admittance matrix elements 25 CSF Fixed capital cost of Substation 26 CSC Variable capital cost of Substation 27 CDGk New investment cost for DG technology k 28 PSh Active power purchased cost from electricity market 29 QSh Reactive power purchased cost from electricity market 30 k,hPDG O&M cost and Fuel cost of DG for active energy 31 k,hQDG O&M cost and Fuel cost of DG for reactive energy 32 PDi,s,t,h Active power demand at bus 33 QDi,s,t,h Reactive power demand at bus 34 PDGmax,k Maximum DG capacity limit for active power 35 QDGmax,k Maximum DG capacity limit for reactive power 36 Umax Maximum voltage limit at bus 37 Umin Minimum voltage limit at bus 38 P Active power ramp-up limit for DG in planning year 39 Q Reactive power ramp-up limit for DG 40 SS Capacity ramp-up limit for Substation transformer 41 SF Capacity ramp-up limit for Feeder 42 fSL Load factor of Substation transformer base year 43 kP, kQ Variation factor of the price of electricity 44 kS Total day per season 3. Results and Discussions 3.1. Diagram and Parameters of Distribution System The 38-bus and 22kV voltage radial diagram is investi- gated in this research as Figure 1 and is connected to 110kV transformer substation. The total active power and reactive power at the base year are 10.85MW and 7.69MVAR, respectively. 3.2. Assumptions in Analyis This research utilizes some economic and technical as- sumptions for the ease of computation: ● Planning period is 5 years and annual developing rate of load demand is constant, 11.5% per year ● The constructing cost of 110kV substation in- cluding fixed costs and variable costs is 0.2M$ and 0.05M$/MVA, respectively [5]. Similarly, the upgrading costs of 22kV feeders consist of 0.15M$/km and 0.001M$/MVA.km ● The effects of DG technology are represented by investment, operation and fuel costs. Two DG technologies, photovoltaic and small gas turbine sources, are used in this research with the corre- sponding capital costs to be 4.0M$/MW and 0.5M$/MW. Average O&M and fuel costs de- pend on used technology and they are assumed to be 52$/MWh and 1$/MWh for photovoltaic and small gas turbine Figure 1. Diagram of radial distribution system. 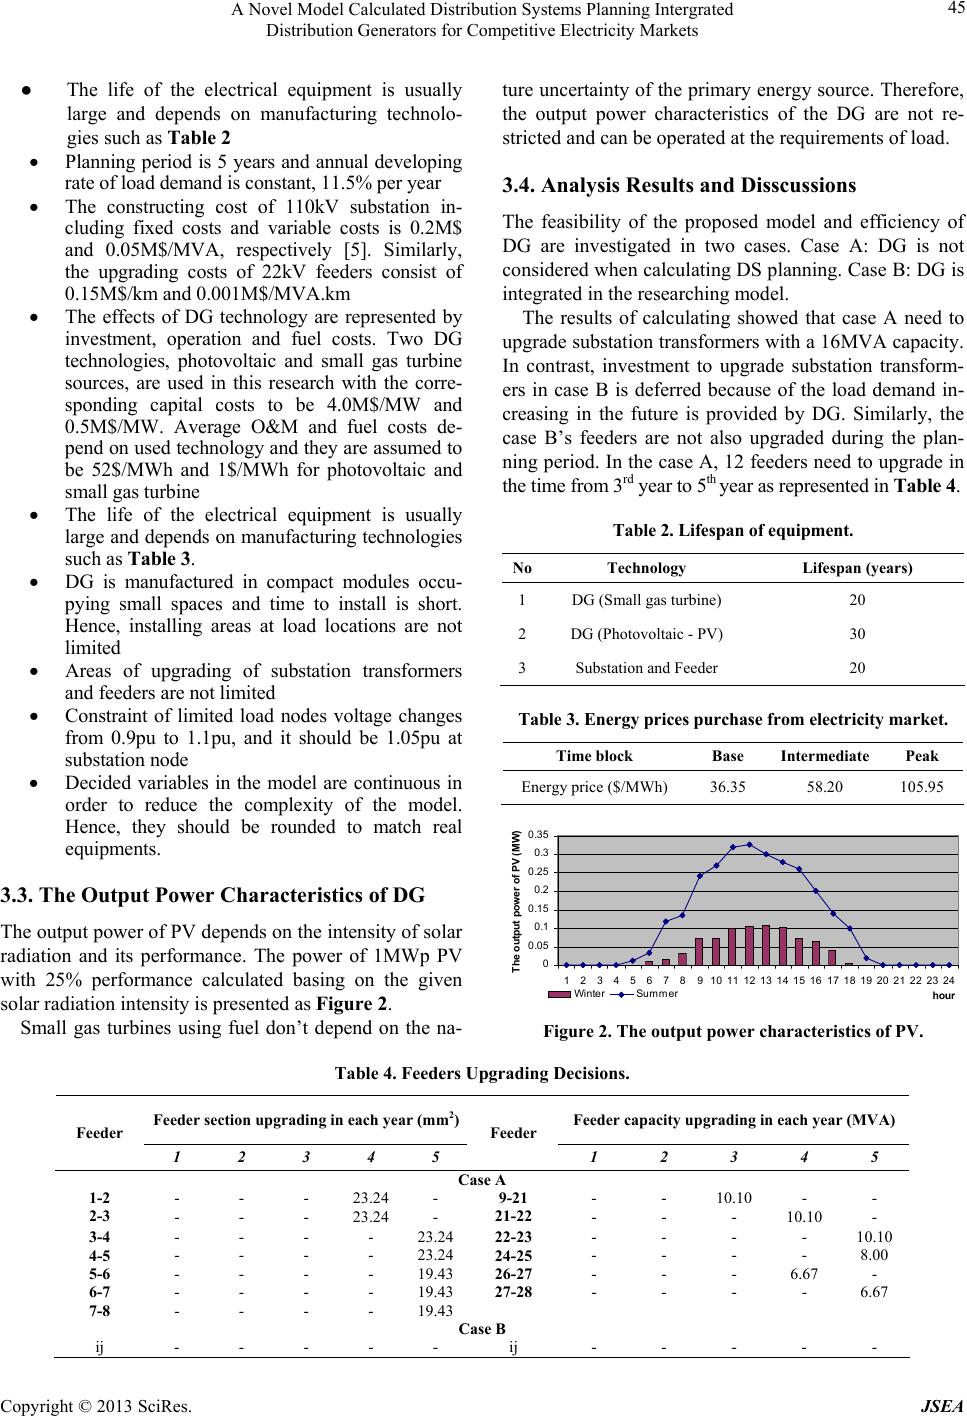 A Novel Model Calculated Distribution Systems Planning Intergrated Distribution Generators for Competitive Electricity Markets Copyright © 2013 SciRes. JSEA 45 ● The life of the electrical equipment is usually large and depends on manufacturing technolo- gies such as Table 2 Planning period is 5 years and annual developing rate of load demand is constant, 11.5% per year The constructing cost of 110kV substation in- cluding fixed costs and variable costs is 0.2M$ and 0.05M$/MVA, respectively [5]. Similarly, the upgrading costs of 22kV feeders consist of 0.15M$/km and 0.001M$/MVA.km The effects of DG technology are represented by investment, operation and fuel costs. Two DG technologies, photovoltaic and small gas turbine sources, are used in this research with the corre- sponding capital costs to be 4.0M$/MW and 0.5M$/MW. Average O&M and fuel costs de- pend on used technology and they are assumed to be 52$/MWh and 1$/MWh for photovoltaic and small gas turbine The life of the electrical equipment is usually large and depends on manufacturing technologies such as Table 3. DG is manufactured in compact modules occu- pying small spaces and time to install is short. Hence, installing areas at load locations are not limited Areas of upgrading of substation transformers and feeders are not limited Constraint of limited load nodes voltage changes from 0.9pu to 1.1pu, and it should be 1.05pu at substation node Decided variables in the model are continuous in order to reduce the complexity of the model. Hence, they should be rounded to match real equipments. 3.3. The Output Power Characteristics of DG The output power of PV depends on the intensity of solar radiation and its performance. The power of 1MWp PV with 25% performance calculated basing on the given solar radiation intensity is presented as Figure 2. Small gas turbines using fuel don’t depend on the na- ture uncertainty of the primary energy source. Therefore, the output power characteristics of the DG are not re- stricted and can be operated at the requirements of load. 3.4. Analysis Results and Disscussions The feasibility of the proposed model and efficiency of DG are investigated in two cases. Case A: DG is not considered when calculating DS planning. Case B: DG is integrated in the researching model. The results of calculating showed that case A need to upgrade substation transformers with a 16MVA capacity. In contrast, investment to upgrade substation transform- ers in case B is deferred because of the load demand in- creasing in the future is provided by DG. Similarly, the case B’s feeders are not also upgraded during the plan- ning period. In the case A, 12 feeders need to upgrade in the time from 3rd year to 5th year as represented in Table 4. Table 2. Lifespan of equipment. NoTechnology Lifespan (years) 1 DG (Small gas turbine) 20 2 DG (Photovoltaic - PV) 30 3 Substation and Feeder 20 Table 3. Energy prices p urchase from electricity market. Time block Base Intermediate Peak Energy price ($/MWh) 36.35 58.20 105.95 0 0.05 0.1 0.15 0.2 0.25 0.3 0.35 123456789101112131415161718192021222324 hour The output power of PV (MW) Winter Summer Figure 2. The output power characteristics of PV. Table 4. Feeders Upgrading Decisions. Feeder section upgrading in each year (mm2)Feeder capacity upgrading in each year (MVA) Feeder 1 2 3 4 5 Feeder 1 2 3 4 5 Case A 1-2 - - - 23.24- 9-21 - - 10.10 - - 2-3 - - - 23.24- 21-22 - - - 10.10 - 3-4 - - - - 23.2422-23 - - - - 10.10 4-5 - - - - 23.2424-25 - - - - 8.00 5-6 - - - - 19.4326-27 - - - 6.67 - 6-7 - - - - 19.4327-28 - - - - 6.67 7-8 - - - - 19.43 Case B ij - - - - - ij - - - - - 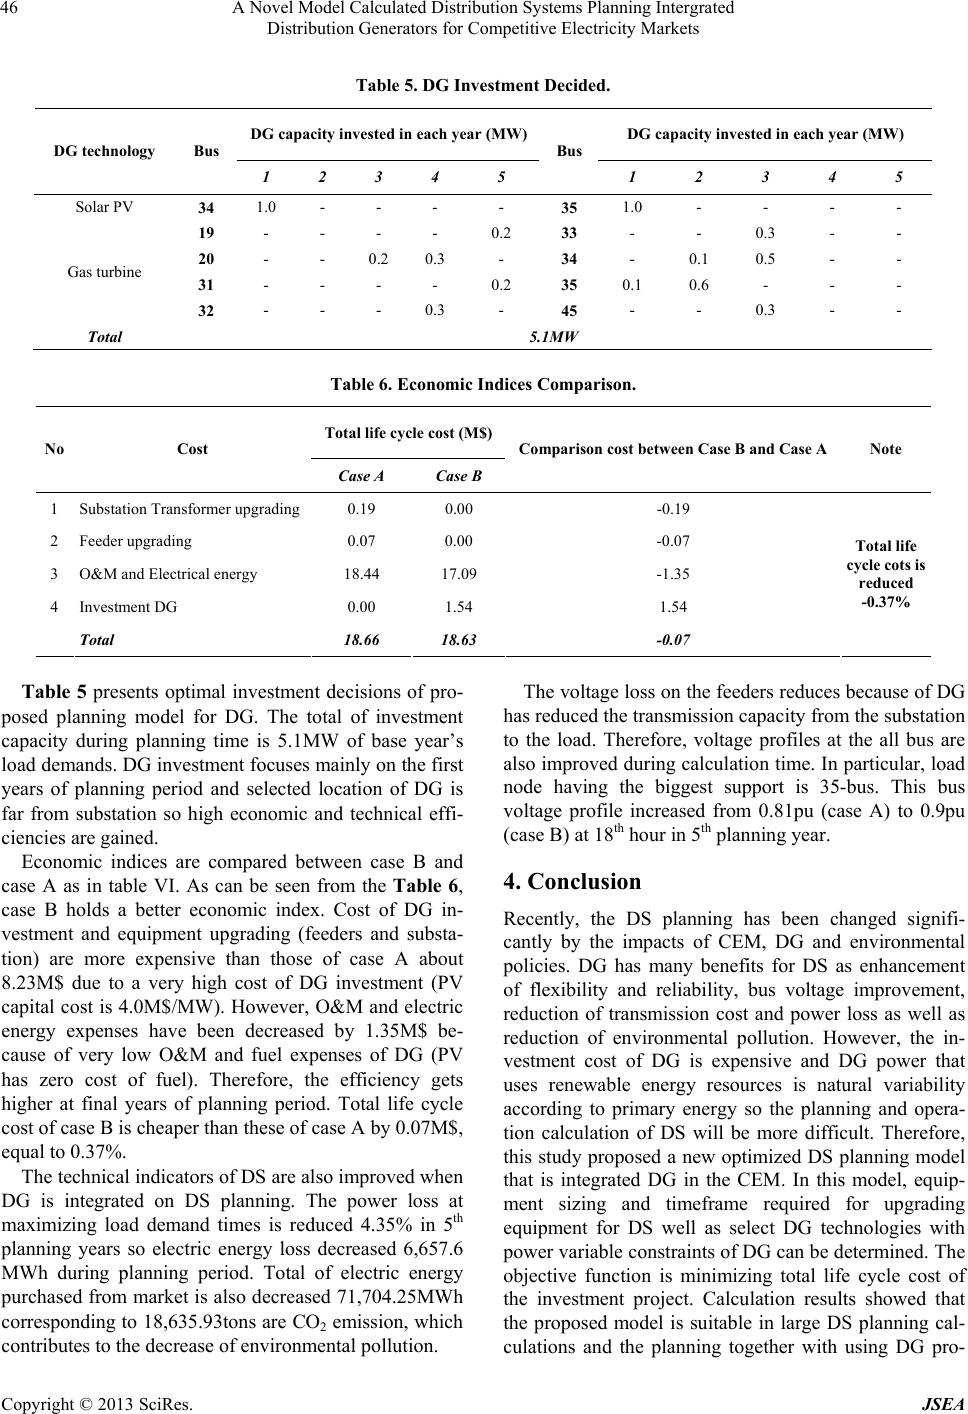 A Novel Model Calculated Distribution Systems Planning Intergrated Distribution Generators for Competitive Electricity Markets Copyright © 2013 SciRes. JSEA 46 Table 5. DG Investment Decided. DG capacity invested in each year (MW)DG capacity invested in each year (MW) DG technology Bus 1 2 3 4 5 Bus 1 2 3 4 5 Solar PV 34 1.0 - - - - 35 1.0 - - - - 19 - - - - 0.2 33 - - 0.3 - - 20 - - 0.2 0.3 - 34 - 0.1 0.5 - - 31 - - - - 0.2 35 0.1 0.6 - - - Gas turbine 32 - - - 0.3 - 45 - - 0.3 - - Total 5.1MW Table 6. Economic Indices Comparison. Total life cycle cost (M$) No Cost Case A Case B Comparison cost between Case B and Case A Note 1 Substation Transformer upgrading 0.19 0.00 -0.19 2 Feeder upgrading 0.07 0.00 -0.07 3 O&M and Electrical energy 18.44 17.09 -1.35 4 Investment DG 0.00 1.54 1.54 Total 18.66 18.63 -0.07 Total life cycle cots is reduced -0.37% Table 5 presents optimal investment decisions of pro- posed planning model for DG. The total of investment capacity during planning time is 5.1MW of base year’s load demands. DG investment focuses mainly on the first years of planning period and selected location of DG is far from substation so high economic and technical effi- ciencies are gained. Economic indices are compared between case B and case A as in table VI. As can be seen from the Table 6, case B holds a better economic index. Cost of DG in- vestment and equipment upgrading (feeders and substa- tion) are more expensive than those of case A about 8.23M$ due to a very high cost of DG investment (PV capital cost is 4.0M$/MW). However, O&M and electric energy expenses have been decreased by 1.35M$ be- cause of very low O&M and fuel expenses of DG (PV has zero cost of fuel). Therefore, the efficiency gets higher at final years of planning period. Total life cycle cost of case B is cheaper than these of case A by 0.07M$, equal to 0.37%. The technical indicators of DS are also improved when DG is integrated on DS planning. The power loss at maximizing load demand times is reduced 4.35% in 5th planning years so electric energy loss decreased 6,657.6 MWh during planning period. Total of electric energy purchased from market is also decreased 71,704.25MWh corresponding to 18,635.93tons are CO2 emission, which contributes to the decrease of environmental pollution. The voltage loss on the feeders reduces because of DG has reduced the transmission capacity from the substation to the load. Therefore, voltage profiles at the all bus are also improved during calculation time. In particular, load node having the biggest support is 35-bus. This bus voltage profile increased from 0.81pu (case A) to 0.9pu (case B) at 18th hour in 5th planning year. 4. Conclusion Recently, the DS planning has been changed signifi- cantly by the impacts of CEM, DG and environmental policies. DG has many benefits for DS as enhancement of flexibility and reliability, bus voltage improvement, reduction of transmission cost and power loss as well as reduction of environmental pollution. However, the in- vestment cost of DG is expensive and DG power that uses renewable energy resources is natural variability according to primary energy so the planning and opera- tion calculation of DS will be more difficult. Therefore, this study proposed a new optimized DS planning model that is integrated DG in the CEM. In this model, equip- ment sizing and timeframe required for upgrading equipment for DS well as select DG technologies with power variable constraints of DG can be determined. The objective function is minimizing total life cycle cost of the investment project. Calculation results showed that the proposed model is suitable in large DS planning cal- culations and the planning together with using DG pro-  A Novel Model Calculated Distribution Systems Planning Intergrated Distribution Generators for Competitive Electricity Markets Copyright © 2013 SciRes. JSEA 47 vided better economic and technical indicators. REFERENCES [1] Thomas Ackermann, Go¨ran Andersson, Lennart So¨der, “Distributed generation: a definition”, Electric Power Systems Research 57, 2001 [2] S. Wong, K. Bhattacharya and J.D.Fuller, “Comprehen- sive framework for long-term distribution system plan- ning”, Proc. IEEE PES Annual General Meeting, Tampa, USA, 2007 [3] Algarni, A.A.S.; Bhattacharya, K., “A Novel Approach to Disco Planning in Electricity Markets: Mathematical Model”, Power Systems Conference and Exposition, 2009. PSCE '09. IEEE/PES [4] El-Khattam, W.; Hegazy, Y.; Salama, M., “An integrated distributed generation optimization model for distribution system planning”, Power Engineering Society General Meeting, IEEE, 2005 [5] S. Wong, K. Bhattacharya1and J.D. Fuller, “Electric power distribution system design and planning in a de- regulated environment”, IET Generation, Transmission & Distribution, 2009 [6] V.V.Thang, D.Q.Thong, B.Q.Khanh, “A New Model Applied to the Planning of Distribution Systems for Com- petitive Electricity Markets”, The Fourth International Conference on Electric Utility Deregulation and Restruc- turing and Power Technologies (DRPT) 2011, Shandong, China, 2011 [7] Richard E. Rosenthal, “GAMS - A User's Guide”, GAMS Development Corporation, Washington, USA, 2010. |