Paper Menu >>
Journal Menu >>
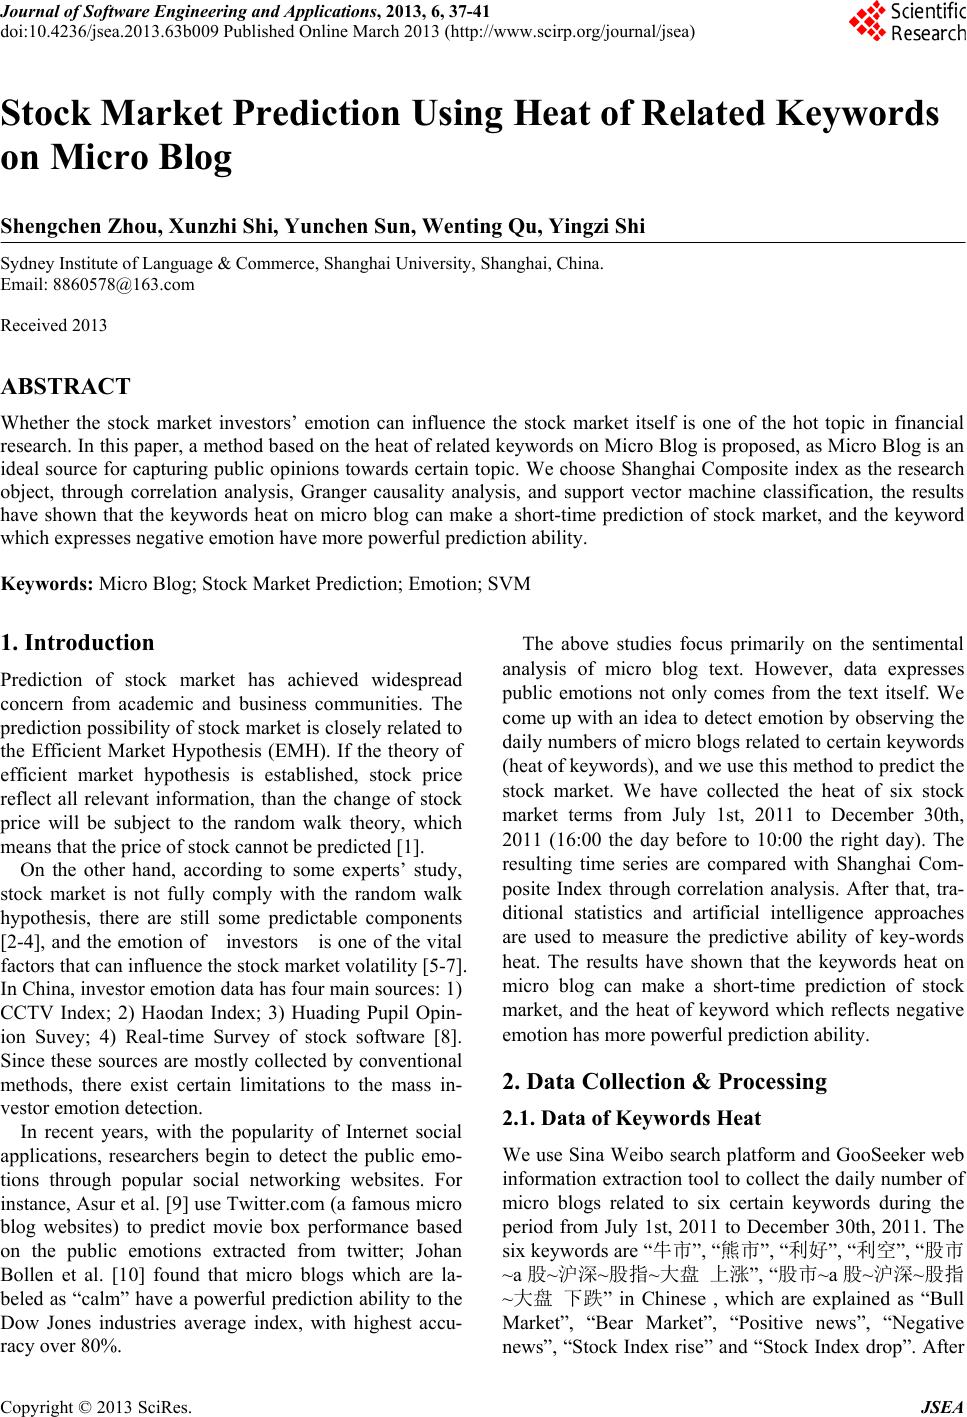 Journal of Software Engineering and Applications, 2013, 6, 37-41 doi:10.4236/jsea.2013.63b009 Published Online March 2013 (http://www.scirp.org/journal/jsea) Copyright © 2013 SciRes. JSEA 37 Stock Market Prediction Using Heat of Related Keywords on Micro Blog Shengchen Zhou, Xunzhi Shi, Yunchen Sun, Wenting Qu, Yingzi Shi Sydney Institute of Language & Commerce, Shanghai University, Shanghai, China. Email: 8860578@163.com Received 2013 ABSTRACT Whether the stock market investors’ emotion can influence the stock market itself is one of the hot topic in financial research. In this paper, a method based on the heat of related keywords on Micro Blog is proposed, as Micro Blog is an ideal source for capturing public opinions towards certain topic. We choose Shanghai Composite index as the research object, through correlation analysis, Granger causality analysis, and support vector machine classification, the results have shown that the keywords heat on micro blog can make a short-time prediction of stock market, and the keyword which expresses negative emotion have more powerful prediction ability. Keywords: Micro Blog; Stock Market Prediction; Emotion; SVM 1. Introduction Prediction of stock market has achieved widespread concern from academic and business communities. The prediction possibility of stock market is closely related to the Efficient Market Hypothesis (EMH). If the theory of efficient market hypothesis is established, stock price reflect all relevant information, than the change of stock price will be subject to the random walk theory, which means that the price of stock cannot be predicted [1]. On the other hand, according to some experts’ study, stock market is not fully comply with the random walk hypothesis, there are still some predictable components [2-4], and the emotion of investors is one of the vital factors that can influence the stock market volatility [5-7]. In China, investor emotion data has four main sources: 1) CCTV Index; 2) Haodan Index; 3) Huading Pupil Opin- ion Suvey; 4) Real-time Survey of stock software [8]. Since these sources are mostly collected by conventional methods, there exist certain limitations to the mass in- vestor emotion detection. In recent years, with the popularity of Internet social applications, researchers begin to detect the public emo- tions through popular social networking websites. For instance, Asur et al. [9] use Twitter.com (a famous micro blog websites) to predict movie box performance based on the public emotions extracted from twitter; Johan Bollen et al. [10] found that micro blogs which are la- beled as “calm” have a powerful prediction ability to the Dow Jones industries average index, with highest accu- racy over 80%. The above studies focus primarily on the sentimental analysis of micro blog text. However, data expresses public emotions not only comes from the text itself. We come up with an idea to detect emotion by observing the daily numbers of micro blogs related to certain keywords (heat of keywords), and we use this method to predict the stock market. We have collected the heat of six stock market terms from July 1st, 2011 to December 30th, 2011 (16:00 the day before to 10:00 the right day). The resulting time series are compared with Shanghai Com- posite Index through correlation analysis. After that, tra- ditional statistics and artificial intelligence approaches are used to measure the predictive ability of key-words heat. The results have shown that the keywords heat on micro blog can make a short-time prediction of stock market, and the heat of keyword which reflects negative emotion has more powerful prediction ability. 2. Data Collection & Processing 2.1. Data of Keywords Heat We use Sina Weibo search platform and GooSeeker web information extraction tool to collect the daily number of micro blogs related to six certain keywords during the period from July 1st, 2011 to December 30th, 2011. The six keywords are “牛市”, “熊市”, “利好”, “利空”, “股市 ~a 股~沪深~股指~大盘 上涨”, “股市~a 股~沪深~股指 ~大盘 下跌” in Chinese , which are explained as “Bull Market”, “Bear Market”, “Positive news”, “Negative news”, “Stock Index rise” and “Stock Index drop”. After 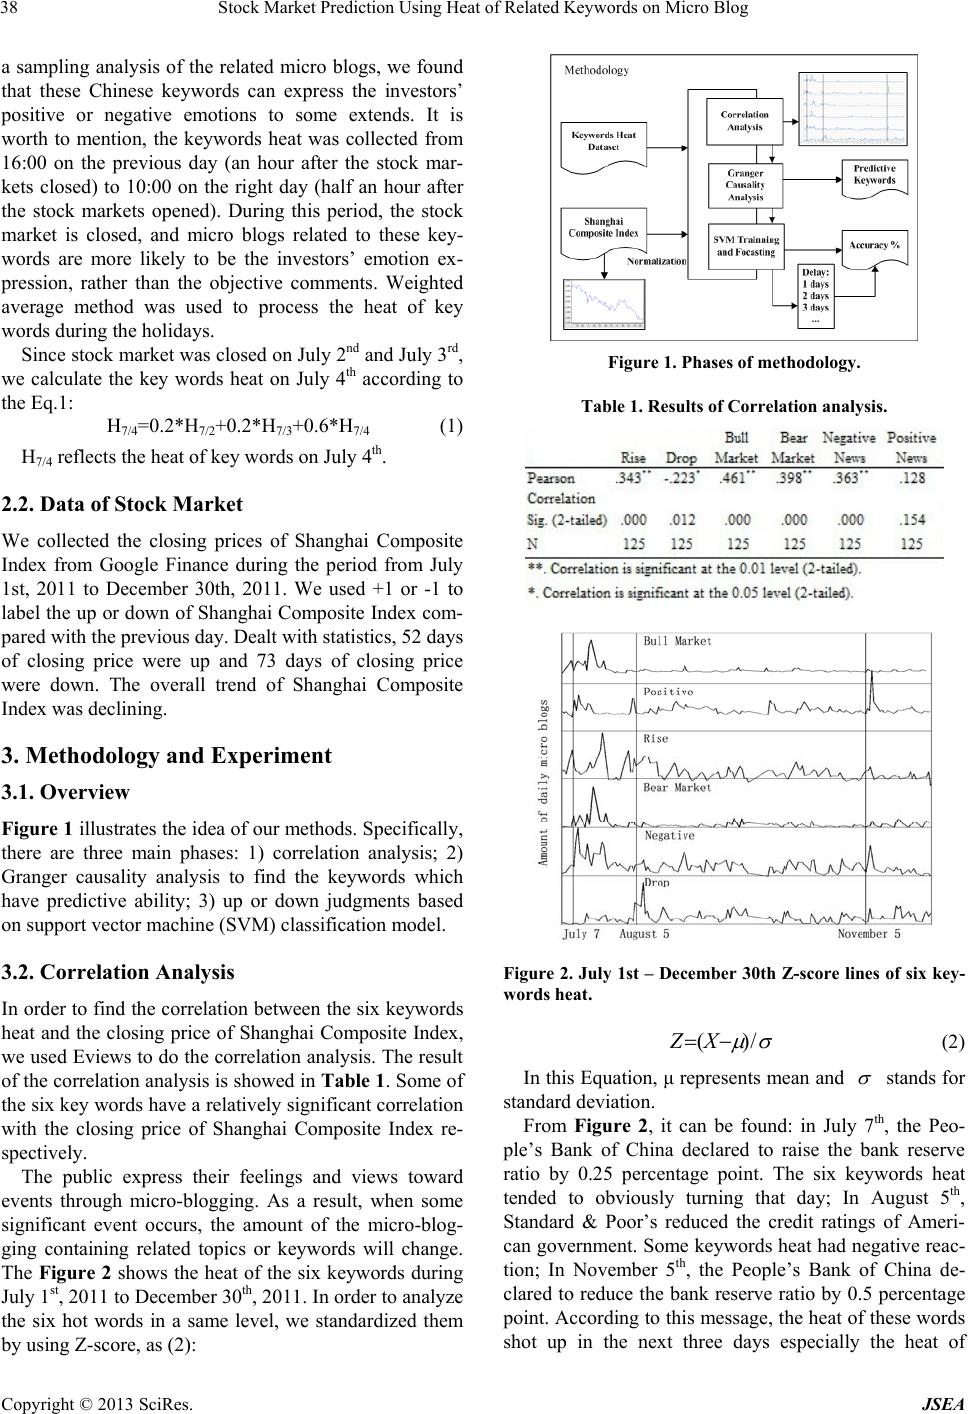 Stock Market Prediction Using Heat of Related Keywords on Micro Blog Copyright © 2013 SciRes. JSEA 38 a sampling analysis of the related micro blogs, we found that these Chinese keywords can express the investors’ positive or negative emotions to some extends. It is worth to mention, the keywords heat was collected from 16:00 on the previous day (an hour after the stock mar- kets closed) to 10:00 on the right day (half an hour after the stock markets opened). During this period, the stock market is closed, and micro blogs related to these key- words are more likely to be the investors’ emotion ex- pression, rather than the objective comments. Weighted average method was used to process the heat of key words during the holidays. Since stock market was closed on July 2nd and July 3rd, we calculate the key words heat on July 4th according to the Eq.1: H7/4=0.2*H7/2+0.2*H7/3+0.6*H 7/4 (1) H7/4 reflects the heat of key words on July 4th. 2.2. Data of Stock Market We collected the closing prices of Shanghai Composite Index from Google Finance during the period from July 1st, 2011 to December 30th, 2011. We used +1 or -1 to label the up or down of Shanghai Composite Index com- pared with the previous day. Dealt with statistics, 52 days of closing price were up and 73 days of closing price were down. The overall trend of Shanghai Composite Index was declining. 3. Methodology and Experiment 3.1. Overview Figure 1 illustrates the idea of our methods. Specifically, there are three main phases: 1) correlation analysis; 2) Granger causality analysis to find the keywords which have predictive ability; 3) up or down judgments based on support vector machine (SVM) classification model. 3.2. Correlation Analysis In order to find the correlation between the six keywords heat and the closing price of Shanghai Composite Index, we used Eviews to do the correlation analysis. The result of the correlation analysis is showed in Table 1. Some of the six key words have a relatively significant correlation with the closing price of Shanghai Composite Index re- spectively. The public express their feelings and views toward events through micro-blogging. As a result, when some significant event occurs, the amount of the micro-blog- ging containing related topics or keywords will change. The Figure 2 shows the heat of the six keywords during July 1st, 2011 to December 30th, 2011. In order to analyze the six hot words in a same level, we standardized them by using Z-score, as (2): Figure 1. Phases of methodology. Table 1. Results of Correlation analysis. Figure 2. July 1st – Dece mber 30th Z-score lines of six key- words heat. ()/ZX (2) In this Equation, μ represents mean and stands for standard deviation. From Figure 2, it can be found: in July 7th, the Peo- ple’s Bank of China declared to raise the bank reserve ratio by 0.25 percentage point. The six keywords heat tended to obviously turning that day; In August 5th, Standard & Poor’s reduced the credit ratings of Ameri- can government. Some keywords heat had negative reac- tion; In November 5th, the People’s Bank of China de- clared to reduce the bank reserve ratio by 0.5 percentage point. According to this message, the heat of these words shot up in the next three days especially the heat of 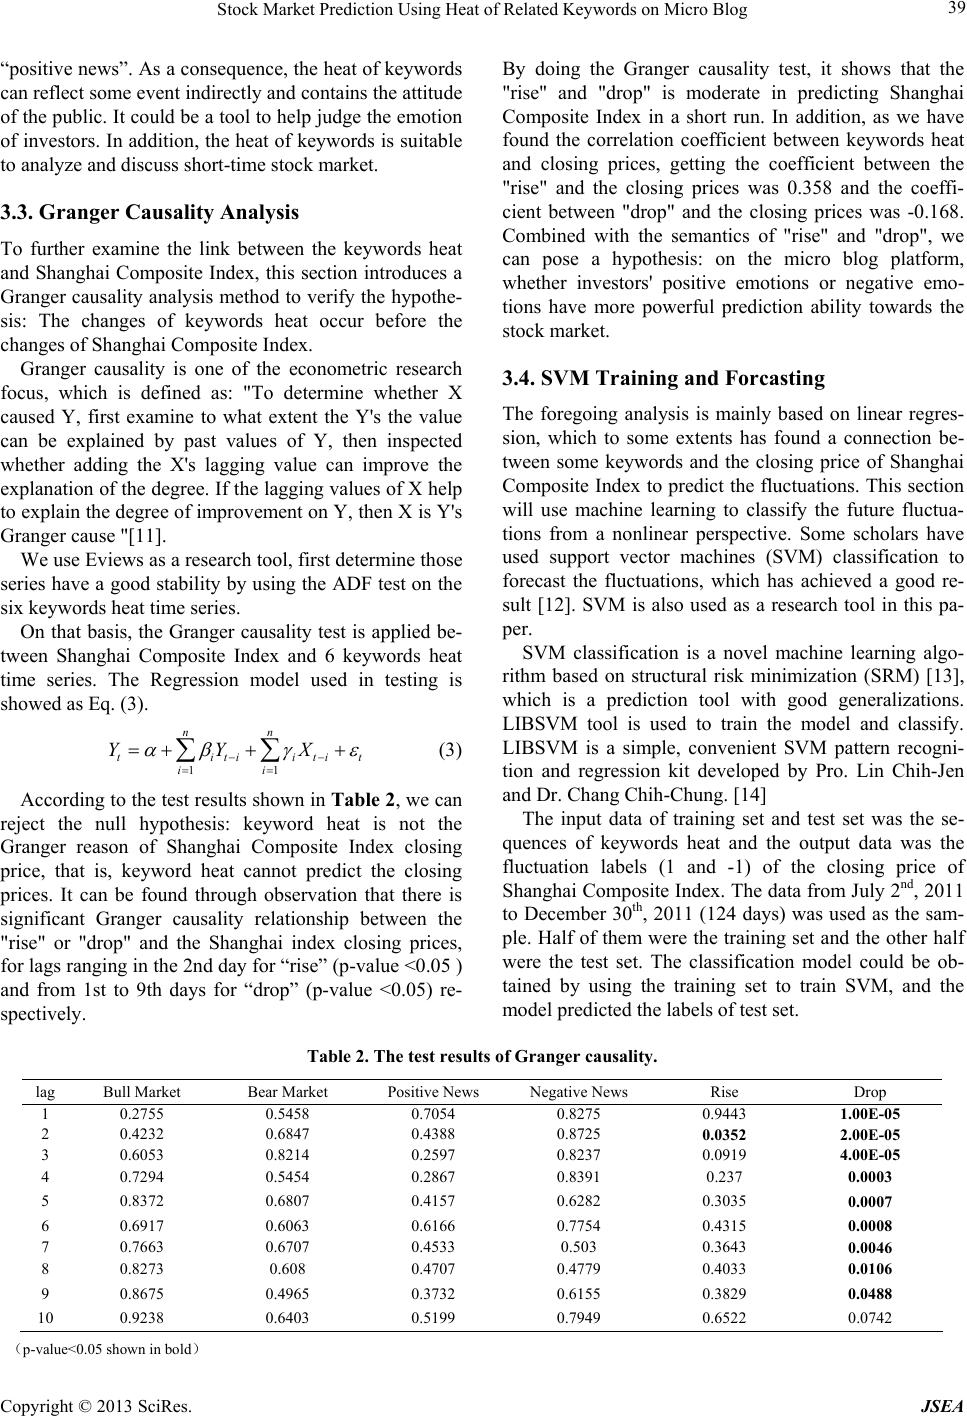 Stock Market Prediction Using Heat of Related Keywords on Micro Blog Copyright © 2013 SciRes. JSEA 39 “positive news”. As a consequence, the heat of keywords can reflect some event indirectly and contains the attitude of the public. It could be a tool to help judge the emotion of investors. In addition, the heat of keywords is suitable to analyze and discuss short-time stock market. 3.3. Granger Causality Analysis To further examine the link between the keywords heat and Shanghai Composite Index, this section introduces a Granger causality analysis method to verify the hypothe- sis: The changes of keywords heat occur before the changes of Shanghai Composite Index. Granger causality is one of the econometric research focus, which is defined as: "To determine whether X caused Y, first examine to what extent the Y's the value can be explained by past values of Y, then inspected whether adding the X's lagging value can improve the explanation of the degree. If the lagging values of X help to explain the degree of improvement on Y, then X is Y's Granger cause "[11]. We use Eviews as a research tool, first determine those series have a good stability by using the ADF test on the six keywords heat time series. On that basis, the Granger causality test is applied be- tween Shanghai Composite Index and 6 keywords heat time series. The Regression model used in testing is showed as Eq. (3). 11 nn titiitit ii YYX (3) According to the test results shown in Table 2, we can reject the null hypothesis: keyword heat is not the Granger reason of Shanghai Composite Index closing price, that is, keyword heat cannot predict the closing prices. It can be found through observation that there is significant Granger causality relationship between the "rise" or "drop" and the Shanghai index closing prices, for lags ranging in the 2nd day for “rise” (p-value <0.05 ) and from 1st to 9th days for “drop” (p-value <0.05) re- spectively. By doing the Granger causality test, it shows that the "rise" and "drop" is moderate in predicting Shanghai Composite Index in a short run. In addition, as we have found the correlation coefficient between keywords heat and closing prices, getting the coefficient between the "rise" and the closing prices was 0.358 and the coeffi- cient between "drop" and the closing prices was -0.168. Combined with the semantics of "rise" and "drop", we can pose a hypothesis: on the micro blog platform, whether investors' positive emotions or negative emo- tions have more powerful prediction ability towards the stock market. 3.4. SVM Training and Forcasting The foregoing analysis is mainly based on linear regres- sion, which to some extents has found a connection be- tween some keywords and the closing price of Shanghai Composite Index to predict the fluctuations. This section will use machine learning to classify the future fluctua- tions from a nonlinear perspective. Some scholars have used support vector machines (SVM) classification to forecast the fluctuations, which has achieved a good re- sult [12]. SVM is also used as a research tool in this pa- per. SVM classification is a novel machine learning algo- rithm based on structural risk minimization (SRM) [13], which is a prediction tool with good generalizations. LIBSVM tool is used to train the model and classify. LIBSVM is a simple, convenient SVM pattern recogni- tion and regression kit developed by Pro. Lin Chih-Jen and Dr. Chang Chih-Chung. [14] The input data of training set and test set was the se- quences of keywords heat and the output data was the fluctuation labels (1 and -1) of the closing price of Shanghai Composite Index. The data from July 2nd, 2011 to December 30th, 2011 (124 days) was used as the sam- ple. Half of them were the training set and the other half were the test set. The classification model could be ob- tained by using the training set to train SVM, and the model predicted the labels of test set. Table 2. The test results of Granger causality. lag Bull Market Bear Market Positive News Negative News Rise Drop 1 0.2755 0.5458 0.7054 0.8275 0.9443 1.00E-05 2 0.4232 0.6847 0.4388 0.8725 0.0352 2.00E-05 3 0.6053 0.8214 0.2597 0.8237 0.0919 4.00E-05 4 0.7294 0.5454 0.2867 0.8391 0.237 0.0003 5 0.8372 0.6807 0.4157 0.6282 0.3035 0.0007 6 0.6917 0.6063 0.6166 0.7754 0.4315 0.0008 7 0.7663 0.6707 0.4533 0.503 0.3643 0.0046 8 0.8273 0.608 0.4707 0.4779 0.4033 0.0106 9 0.8675 0.4965 0.3732 0.6155 0.3829 0.0488 10 0.9238 0.6403 0.5199 0.7949 0.6522 0.0742 (p-value<0.05 shown in bold) 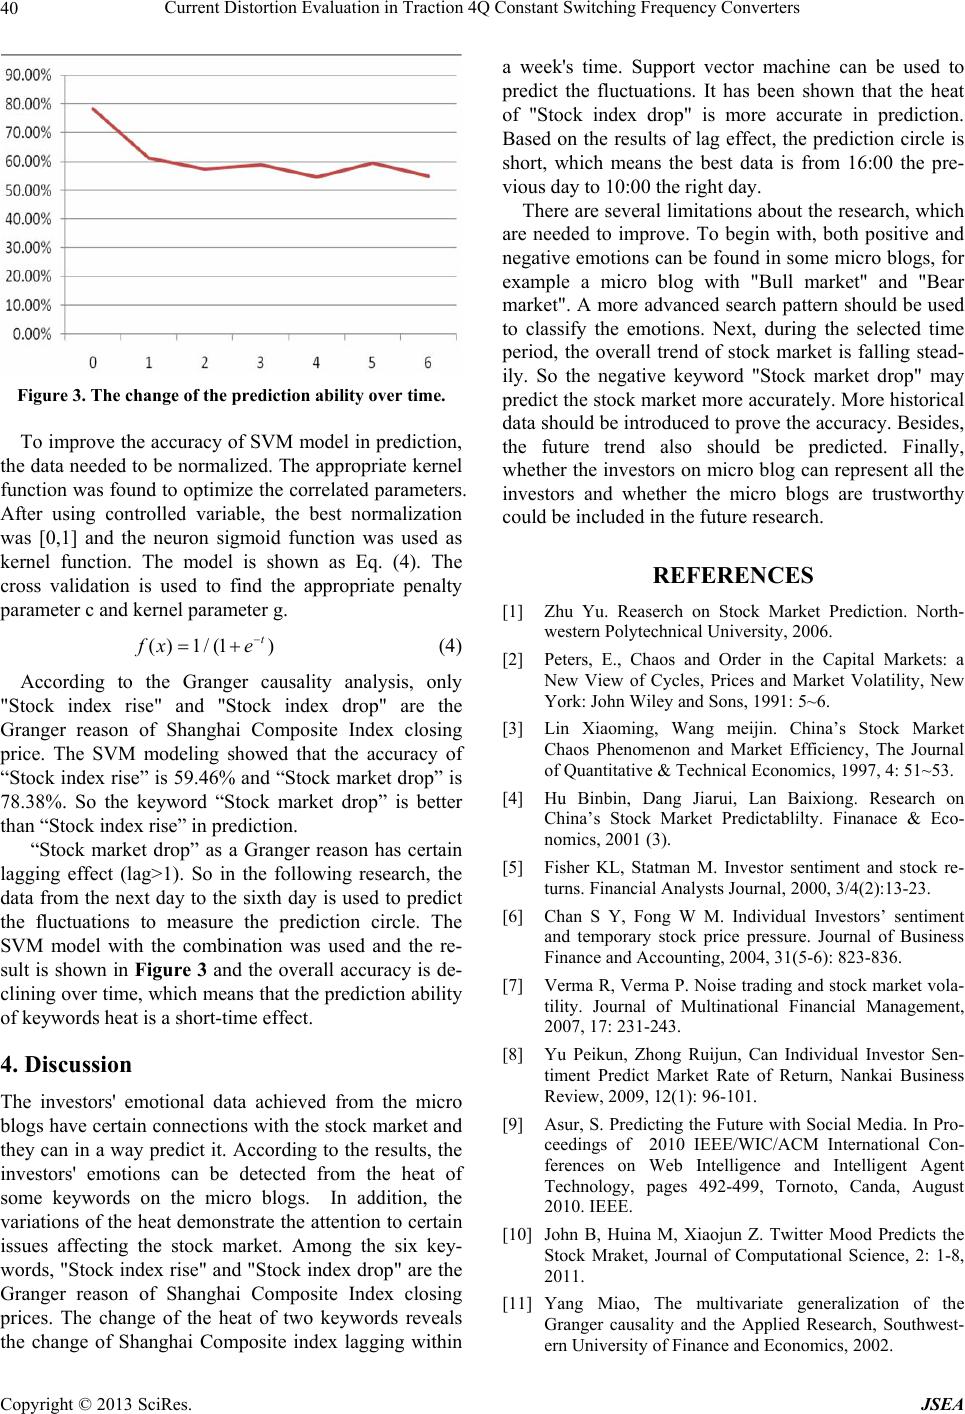 Current Distortion Evaluation in Traction 4Q Constant Switching Frequency Converters Copyright © 2013 SciRes. JSEA 40 Figure 3. The change of the prediction ability over time. To improve the accuracy of SVM model in prediction, the data needed to be normalized. The appropriate kernel function was found to optimize the correlated parameters. After using controlled variable, the best normalization was [0,1] and the neuron sigmoid function was used as kernel function. The model is shown as Eq. (4). The cross validation is used to find the appropriate penalty parameter c and kernel parameter g. () 1/(1) t f xe (4) According to the Granger causality analysis, only "Stock index rise" and "Stock index drop" are the Granger reason of Shanghai Composite Index closing price. The SVM modeling showed that the accuracy of “Stock index rise” is 59.46% and “Stock market drop” is 78.38%. So the keyword “Stock market drop” is better than “Stock index rise” in prediction. “Stock market drop” as a Granger reason has certain lagging effect (lag>1). So in the following research, the data from the next day to the sixth day is used to predict the fluctuations to measure the prediction circle. The SVM model with the combination was used and the re- sult is shown in Figure 3 and the overall accuracy is de- clining over time, which means that the prediction ability of keywords heat is a short-time effect. 4. Discussion The investors' emotional data achieved from the micro blogs have certain connections with the stock market and they can in a way predict it. According to the results, the investors' emotions can be detected from the heat of some keywords on the micro blogs. In addition, the variations of the heat demonstrate the attention to certain issues affecting the stock market. Among the six key- words, "Stock index rise" and "Stock index drop" are the Granger reason of Shanghai Composite Index closing prices. The change of the heat of two keywords reveals the change of Shanghai Composite index lagging within a week's time. Support vector machine can be used to predict the fluctuations. It has been shown that the heat of "Stock index drop" is more accurate in prediction. Based on the results of lag effect, the prediction circle is short, which means the best data is from 16:00 the pre- vious day to 10:00 the right day. There are several limitations about the research, which are needed to improve. To begin with, both positive and negative emotions can be found in some micro blogs, for example a micro blog with "Bull market" and "Bear market". A more advanced search pattern should be used to classify the emotions. Next, during the selected time period, the overall trend of stock market is falling stead- ily. So the negative keyword "Stock market drop" may predict the stock market more accurately. More historical data should be introduced to prove the accuracy. Besides, the future trend also should be predicted. Finally, whether the investors on micro blog can represent all the investors and whether the micro blogs are trustworthy could be included in the future research. REFERENCES [1] Zhu Yu. Reaserch on Stock Market Prediction. North- western Polytechnical University, 2006. [2] Peters, E., Chaos and Order in the Capital Markets: a New View of Cycles, Prices and Market Volatility, New York: John Wiley and Sons, 1991: 5~6. [3] Lin Xiaoming, Wang meijin. China’s Stock Market Chaos Phenomenon and Market Efficiency, The Journal of Quantitative & Technical Economics, 1997, 4: 51~53. [4] Hu Binbin, Dang Jiarui, Lan Baixiong. Research on China’s Stock Market Predictablilty. Finanace & Eco- nomics, 2001 (3). [5] Fisher KL, Statman M. Investor sentiment and stock re- turns. Financial Analysts Journal, 2000, 3/4(2):13-23. [6] Chan S Y, Fong W M. Individual Investors’ sentiment and temporary stock price pressure. Journal of Business Finance and Accounting, 2004, 31(5-6): 823-836. [7] Verma R, Verma P. Noise trading and stock market vola- tility. Journal of Multinational Financial Management, 2007, 17: 231-243. [8] Yu Peikun, Zhong Ruijun, Can Individual Investor Sen- timent Predict Market Rate of Return, Nankai Business Review, 2009, 12(1): 96-101. [9] Asur, S. Predicting the Future with Social Media. In Pro- ceedings of 2010 IEEE/WIC/ACM International Con- ferences on Web Intelligence and Intelligent Agent Technology, pages 492-499, Tornoto, Canda, August 2010. IEEE. [10] John B, Huina M, Xiaojun Z. Twitter Mood Predicts the Stock Mraket, Journal of Computational Science, 2: 1-8, 2011. [11] Yang Miao, The multivariate generalization of the Granger causality and the Applied Research, Southwest- ern University of Finance and Economics, 2002.  Stock Market Prediction Using Heat of Related Keywords on Micro Blog Copyright © 2013 SciRes. JSEA 41 [12] Zhang Zuoquan. Application of SVM in Security Invest- ment Analysis, Beijing Jiaotong University, 2007. [13] Vapnik V N. The nature of statistical learning theory. New York:Springer,1995. [14] Chih-Chung Chang and Chih-Jen Lin, LIBSVM : a li- brary for support vector machines. ACM Transactions on Intelligent Systems and Technology, 2:27:1--27:27, 2011. Software available at http://www.csie.ntu.edu.tw/~cjlin/libsvm |