Paper Menu >>
Journal Menu >>
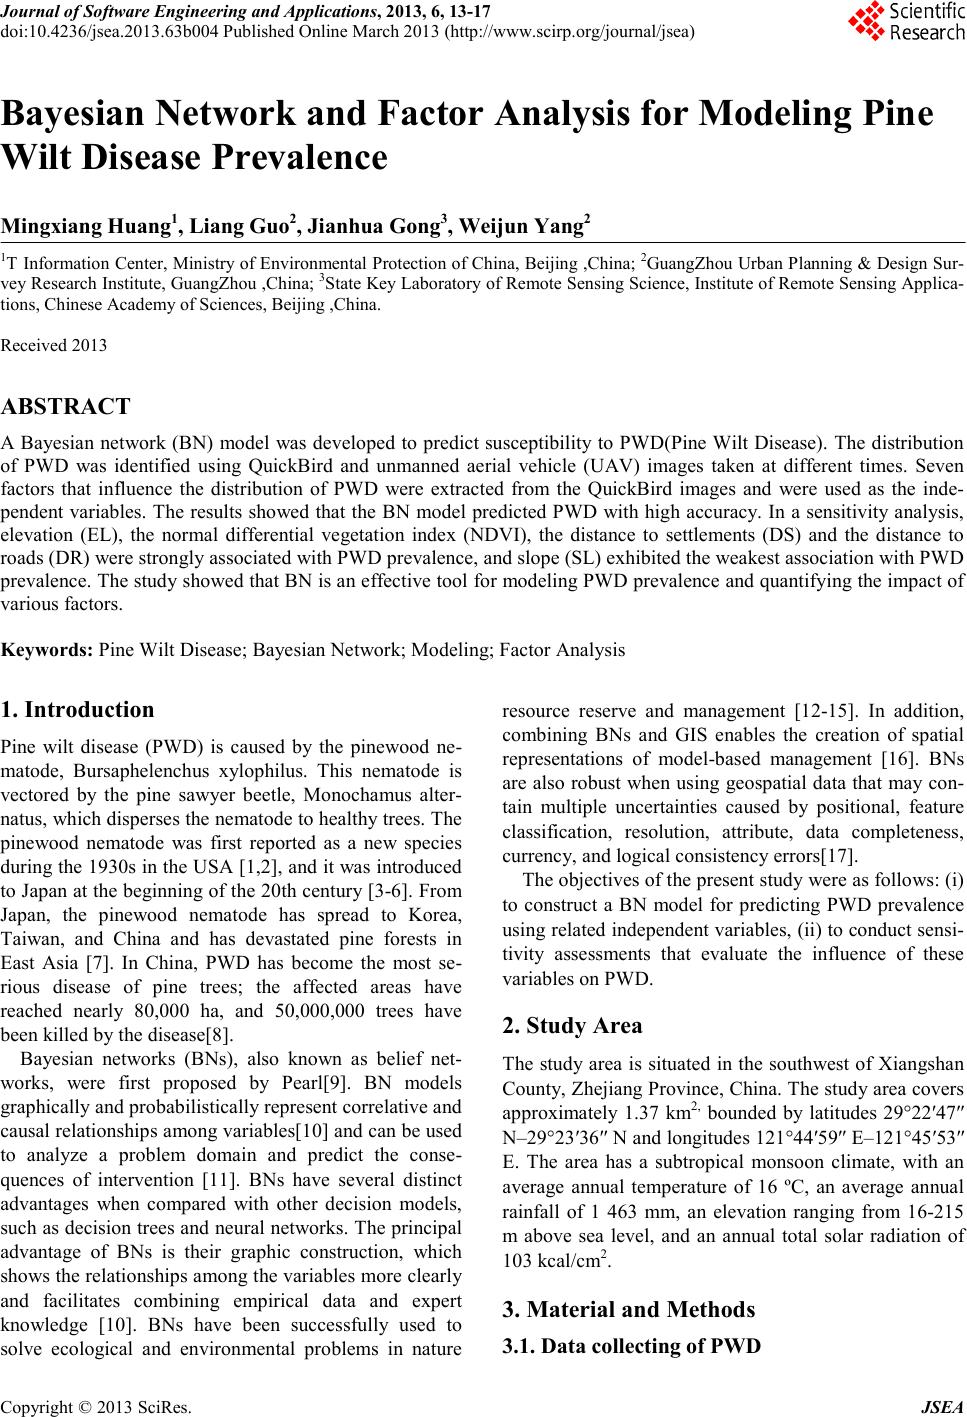 Journal of Software Engineering and Applications, 2013, 6, 13-17 doi:10.4236/jsea.2013.63b004 Published Online March 2013 (http://www.scirp.org/journal/jsea) Copyright © 2013 SciRes. JSEA 13 Bayesian Network and Factor Analysis for Modeling Pine Wilt Disease Prevalence Mingxiang Huang1, Liang Guo2, Jianhua Gong3, Weijun Yang2 1T Information Center, Ministry of Environmental Protection of China, Beijing ,China; 2GuangZhou Urban Planning & Design Sur- vey Research Institute, GuangZhou ,China; 3State Key Laboratory of Remote Sensing Science, Institute of Remote Sensing Applica- tions, Chinese Academy of Sciences, Beijing ,China. Received 2013 ABSTRACT A Bayesian network (BN) model was developed to predict susceptibility to PWD(Pine Wilt Disease). The distribution of PWD was identified using QuickBird and unmanned aerial vehicle (UAV) images taken at different times. Seven factors that influence the distribution of PWD were extracted from the QuickBird images and were used as the inde- pendent variables. The results showed that the BN model predicted PWD with high accuracy. In a sensitivity analysis, elevation (EL), the normal differential vegetation index (NDVI), the distance to settlements (DS) and the distance to roads (DR) were strongly associated with PWD prevalence, and slope (SL) exhibited the weakest association with PWD prevalence. The study showed that BN is an effective tool for modeling PWD prevalence and quantifying the impact of various factors. Keywords: Pine Wilt Disease; Bayesian Network; Modeling; Factor Analysis 1. Introduction Pine wilt disease (PWD) is caused by the pinewood ne- matode, Bursaphelenchus xylophilus. This nematode is vectored by the pine sawyer beetle, Monochamus alter- natus, which disperses the nematode to healthy trees. The pinewood nematode was first reported as a new species during the 1930s in the USA [1,2], and it was introduced to Japan at the beginning of the 20th century [3-6]. From Japan, the pinewood nematode has spread to Korea, Taiwan, and China and has devastated pine forests in East Asia [7]. In China, PWD has become the most se- rious disease of pine trees; the affected areas have reached nearly 80,000 ha, and 50,000,000 trees have been killed by the disease[8]. Bayesian networks (BNs), also known as belief net- works, were first proposed by Pearl[9]. BN models graphically and probabilistically represent correlative and causal relationships among variables[10] and can be used to analyze a problem domain and predict the conse- quences of intervention [11]. BNs have several distinct advantages when compared with other decision models, such as decision trees and neural networks. The principal advantage of BNs is their graphic construction, which shows the relationships among the variables more clearly and facilitates combining empirical data and expert knowle d ge [10]. BNs have been successfully used to solve ecological and environmental problems in nature resource reserve and management [12-15]. In addition, combining BNs and GIS enables the creation of spatial representations of model-based management [16]. BNs are also robust when using geospatial data that may con- tain multiple uncertainties caused by positional, feature classification, resolution, attribute, data completeness, currency, and logical consistency errors[17]. The objectives of the present study were as follows: (i) to construct a BN model for predicting PWD prevalence using related independent variables, (ii) to conduct sensi- tivity assessments that evaluate the influence of these variables on PWD. 2. Study Area The study area is situated in the southwest of Xiangshan County, Zhejiang Province, China. The study area covers approximately 1.37 km2, bounded by latitudes 29°22′47″ N–29°23′36″ N and longitudes 121°44′59″ E–121°45′53″ E. The area has a subtropical monsoon climate, with an average annual temperature of 16 ºC, an average annual rainfall of 1 463 mm, an elevation ranging from 16-215 m above sea level, and an annual total solar radiation of 103 kcal/cm2. 3. Material and Methods 3.1. Data collecting of PWD 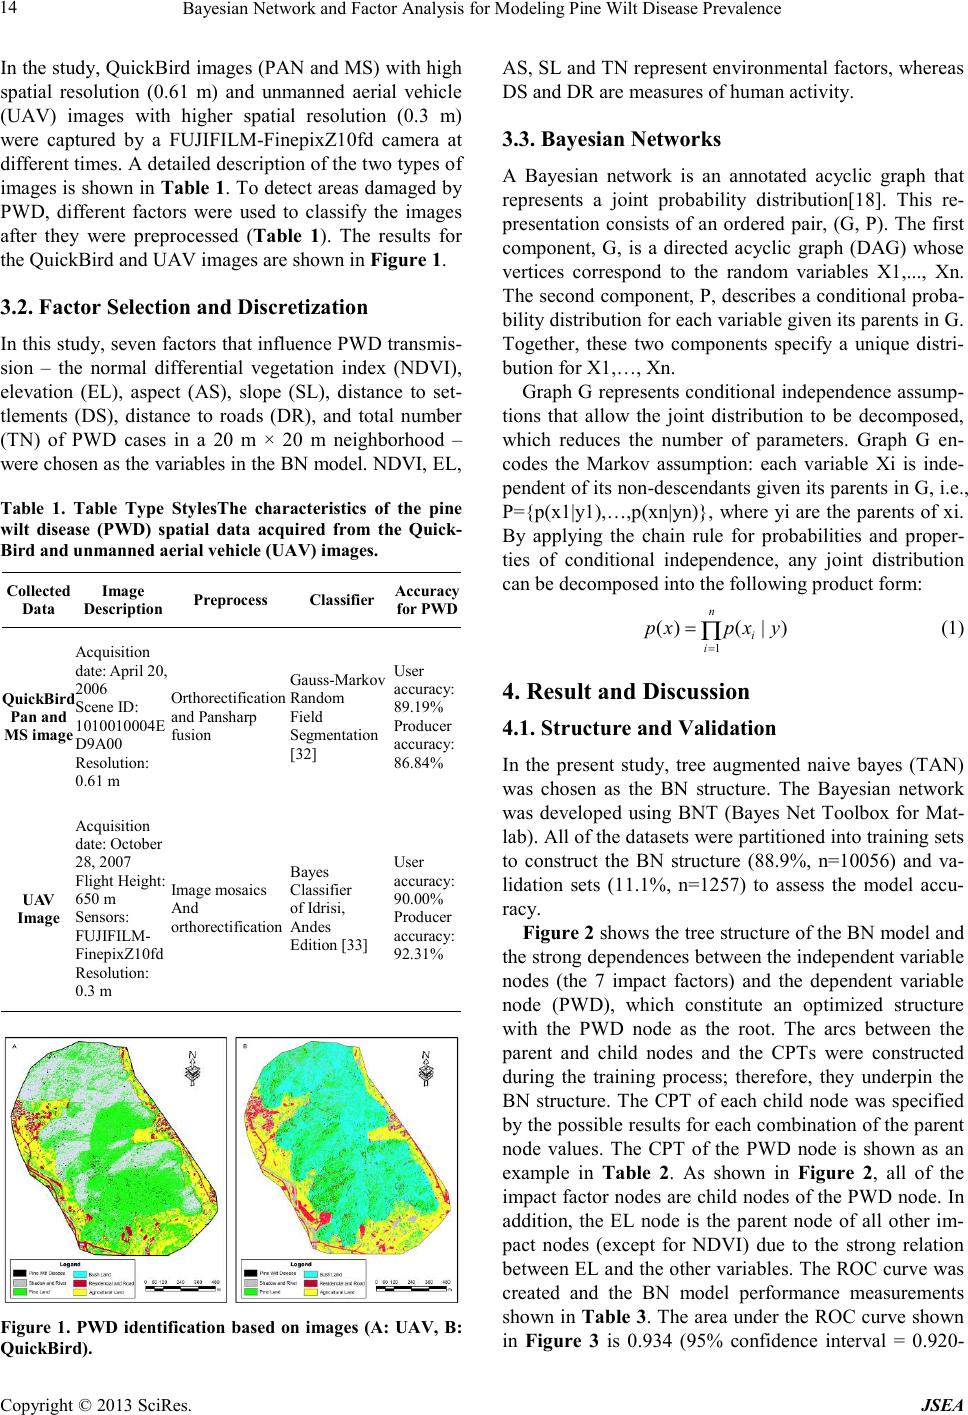 Bayesian Network and Factor Analysis for Modeling Pine Wilt Disease Prevalence Copyright © 2013 SciRes. JSEA 14 In the study, QuickBird images (PAN and MS) with high spatial resolution (0.61 m) and unmanned aerial vehicle (UAV) images with higher spatial resolution (0.3 m) were captured by a FUJIFILM-FinepixZ10fd camera at different times. A detailed description of the two types of images is shown in Table 1. To detect areas damaged by PWD, different factors were used to classify the images after they were preprocessed (Table 1). The results for the QuickBird and UAV images are shown in Figure 1. 3.2. Factor Selection and Discretization In this study, seven factors that influence PWD transmis- sion – the normal differential vegetation index (NDVI), elevation (EL), aspect (AS), slope (SL), distance to set- tlements (DS), distance to roads (DR), and total number (TN) of PWD cases in a 20 m × 20 m neighborhood – were chosen as the variables in the BN model. NDVI, EL, Table 1. Table Type StylesThe characteristics of the pine wilt disease (PWD) spatial data acquired from the Quick- Bird and unmanned aerial vehicle (UAV) images. Collected Data Image Description Preprocess Classifi er Acc ura cy for PWD QuickBird Pan and MS image Acquisition date: April 20, 2006 Scene ID: 1010010 004E D9A00 Resolution: 0.61 m Orthorect ification and Pansharp fusion Gaus s-Markov Random Field Segmen t ation [32] User accuracy: 89.19 % Producer accuracy: 86.84 % U AV Image Acquisition date: October 28, 2007 Flight Height: 650 m Sensors: FUJIFIL M- FinepixZ10fd Resolution: 0.3 m Image mosaics And orthorecti fication Baye s Classifi er of Idrisi, Andes Edition [33] User accuracy: 90.00 % Producer accuracy: 92.31 % Figure 1. PWD identification based on images (A: UAV, B: QuickBird). AS, SL and TN represent environmental factors, whereas DS and DR are measures of human activity. 3.3. Bayesian Networks A Bayesian network is an annotated acyclic graph that represents a joint probability distribution[18]. This re- presentation consists of an ordered pair, (G, P). The first component, G, is a directed acyclic graph (DAG) whose vertices correspond to the random variables X1,..., Xn. The second component, P, describes a conditional proba- bility distribution for each variable given its parents in G. Together, these two components specify a unique distri- bution for X1,…, Xn. Graph G represents conditional independence assump- tions that allow the joint distribution to be decomposed, which reduces the number of parameters. Graph G en- codes the Markov assumption: each variable Xi is inde- pendent of its non-descendants given its parents in G, i.e., P={p(x1|y1),…,p(xn|yn)}, where yi are the parents of xi. By applying the chain rule for probabilities and proper- ties of conditional independence, any joint distribution can be decomposed into the following product form: 1 ()(| ) n i i pxpx y = = Π (1) 4. Result and Discussion 4.1. Structure and Validation In the present study, tree augmented naive bayes (TAN) was chosen as the BN structure. The Bayesian network was developed using BNT (Bayes Net Toolbox for Mat- lab). All of the datasets were partitioned into training sets to construct the BN structure (88.9%, n=10056) and va- lidation sets (11.1%, n=1257) to assess the model accu- racy. Figure 2 shows the tree structure of the BN model and the strong dependences between the independent variable nodes (the 7 impact factors) and the dependent variable node (PWD), which constitute an optimized structure with the PWD node as the root. The arcs between the parent and child nodes and the CPTs were constructed during the training process; therefore, they underpin the BN structure. The CPT of each child node was specified by the possible results for each combination of the parent node values. The CPT of the PWD node is shown as an example in Table 2. As shown in Figure 2, all of the impact factor nodes are child nodes of the PWD node. In addition, the EL node is the parent node of all other im- pact nodes (except for NDVI) due to the strong relation between EL and the other variables. The ROC curve was created and the BN model performance measurements shown in Table 3. The area under the ROC curve shown in Figure 3 is 0.934 (95% confidence interval = 0.920- 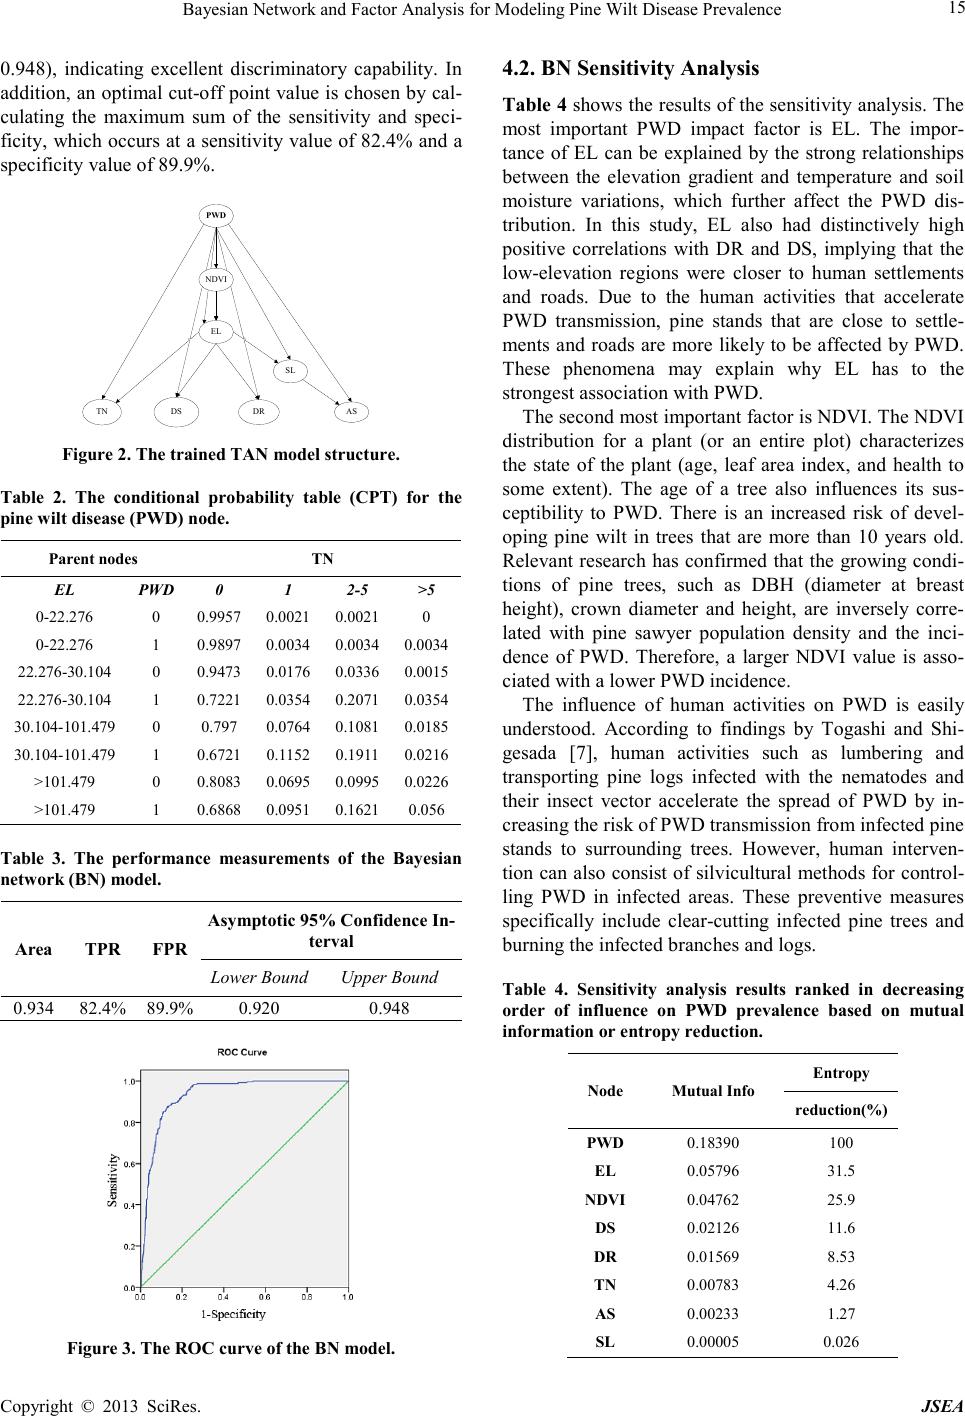 Bayesian Network and Factor Analysis for Modeling Pine Wilt Disease Prevalence Copyright © 2013 SciRes. JSEA 15 0.948), indicating excellent discriminatory capability. In addition, an optimal cut-off point value is chosen by cal- culating the maximum sum of the sensitivity and speci- ficity, which occurs at a sensitivity value of 82.4% and a specificity value of 89.9%. AS TN DS DR PWD SL NDVI EL Figure 2. The trained TAN model structure. Table 2. The conditional probability table (CPT) for the pine wilt disease (PWD) node. Parent nodes TN EL PWD 0 1 2-5 >5 0-22.276 0 0.9957 0 .0021 0 .0021 0 0-22.276 1 0.9897 0 .0034 0 .0034 0.0 034 22.276 -30.104 0 0 .9473 0.0 176 0.0 336 0.0 015 22.276 -30.104 1 0 .7221 0.0 354 0.2 071 0.0 354 30.104-10 1.479 0 0.797 0.0764 0.1081 0 .0185 30.104 -101.479 1 0.6721 0.1152 0.1911 0.0216 >101. 479 0 0.8083 0 .0695 0 .0995 0.0 226 >101. 479 1 0.6868 0 .0951 0 .1621 0.056 Table 3. The performance measurements of the Bayesian network (BN) model. Are a TPR FPR Asymptotic 95% Confidence In- terval Lower Bound Upper Bound 0.934 82.4% 89.9% 0.920 0.948 Figure 3. The ROC curve of the BN model. 4.2. BN Sensitivity Analysis Table 4 shows the results of the sensitivity analysis. The most important PWD impact factor is EL. The impor- tance of EL can be explained by the strong relationships between the elevation gradient and temperature and soil moisture variations, which further affect the PWD dis- tribution. In this study, EL also had distinctively high positive correlations with DR and DS, implying that the low-elevation regions were closer to human settlements and roads. Due to the human activities that accelerate PWD transmission, pine stands that are close to settle- ments and roads are more likely to be affected by PWD. These phenomena may explain why EL has to the strongest association with PWD. The second most important factor is NDVI. The NDVI distribution for a plant (or an entire plot) characterizes the state of the plant (age, leaf area index, and health to some extent). The age of a tree also influences its sus- ceptibility to PWD. There is an increased risk of devel- oping pine wilt in trees that are more than 10 years old. Relevant research has confirmed that the growing condi- tions of pine trees, such as DBH (diameter at breast height), crown diameter and height, are inversely corre- lated with pine sawyer population density and the inci- dence of PWD. Therefore, a larger NDVI value is asso- ciated with a lower PWD incidence. The influence of human activities on PWD is easily understood. According to findings by Togashi and Shi- gesada [7], human activities such as lumbering and transporting pine logs infected with the nematodes and their insect vector accelerate the spread of PWD by in- creasing the risk of PWD transmission from infected pine stands to surrounding trees. However, human interven- tion can also consist of silvicultural methods for control- ling PWD in infected areas. These preventive measures specifically include clear-cutting infected pine trees and burning the infected branches and logs. Table 4. Sensitivity analysis results ranked in decreasing order of influence on PWD prevalence based on mutual information or entropy reduction. Node Mutual Info En t ro py reduction(%) PWD 0.18390 100 EL 0.05796 31.5 NDVI 0.04762 25.9 DS 0.02126 11.6 DR 0.01569 8.53 TN 0.00783 4.26 AS 0.00233 1.27 SL 0.00005 0.026 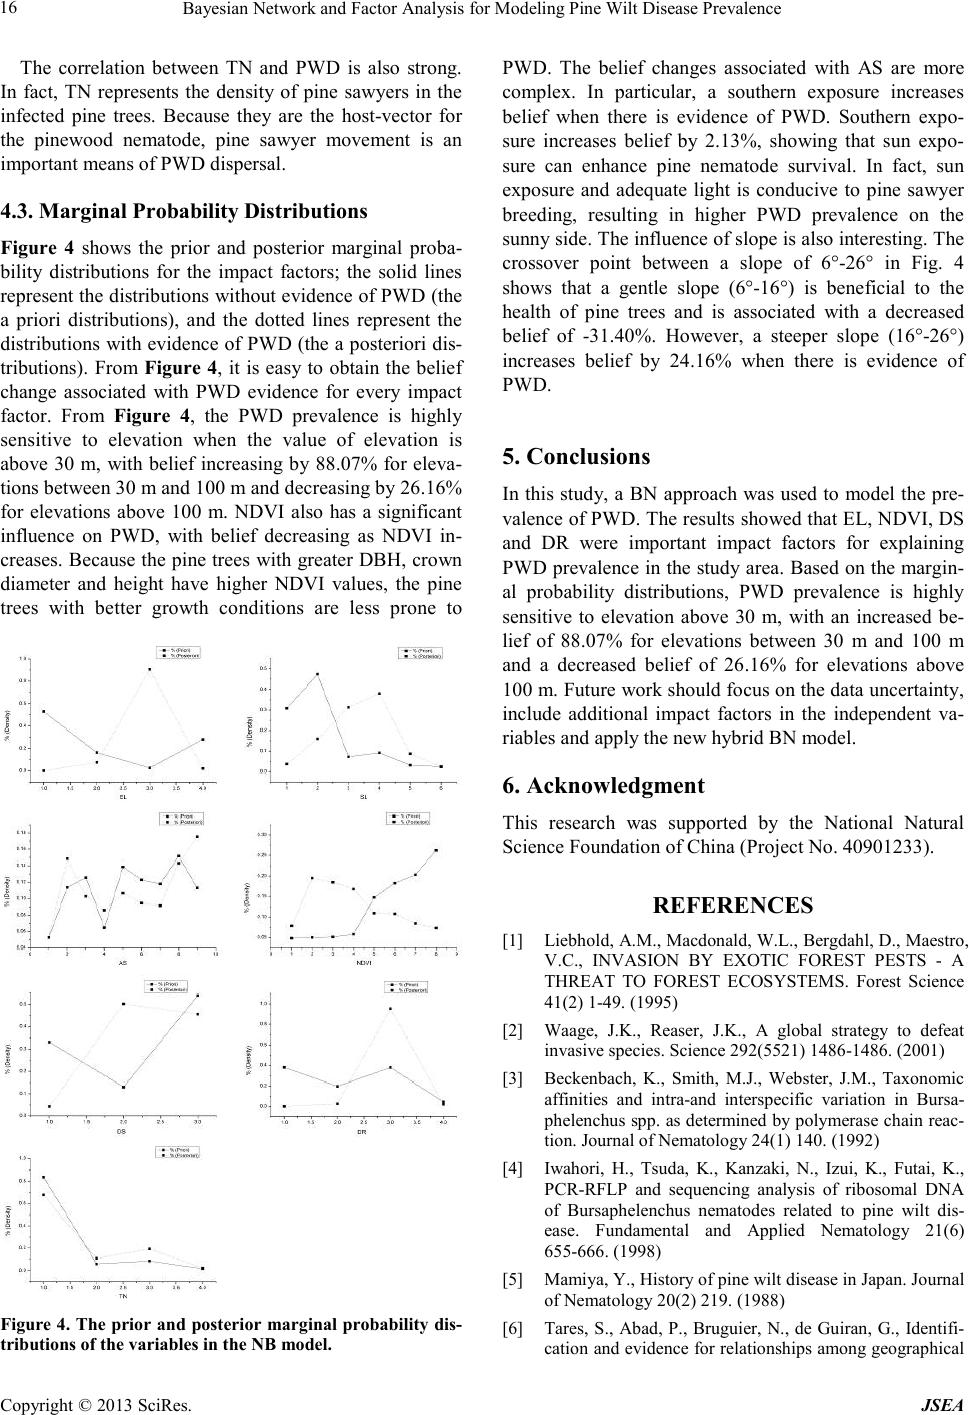 Bayesian Network and Factor Analysis for Modeling Pine Wilt Disease Prevalence Copyright © 2013 SciRes. JSEA 16 The correlation between TN and PWD is also strong. In fact, TN represents the density of pine sawyers in the infected pine trees. Because they are the host-vector for the pinewood nematode, pine sawyer movement is an important means of PWD dispersal. 4.3. Marginal Probability Distributions Figure 4 shows the prior and posterior marginal proba- bility distributions for the impact factors; the solid lines represent the distributions without evidence of PWD (the a priori distributions), and the dotted lines represent the distributions with evidence of PWD (the a posteriori dis- tributions). From Figure 4, it is easy to obtain the belief change associated with PWD evidence for every impact factor. From Figure 4, the PWD prevalence is highly sensitive to elevation when the value of elevation is above 30 m, with belief increasing by 88.07% for eleva- tions between 30 m and 100 m and decreasing by 26.16% for elevations above 100 m. NDVI also has a significant influence on PWD, with belief decreasing as NDVI in- creases. Because the pine trees with greater DBH, crown diameter and height have higher NDVI values, the pine trees with better growth conditions are less prone to Figure 4. The prior and posterior marginal probability dis- tributions of the variables in the NB model. PWD. The belief changes associated with AS are more complex. In particular, a southern exposure increases belief when there is evidence of PWD. Southern e xpo- sure increases belief by 2.13%, showing that sun expo- sure can enhance pine nematode survival. In fact, sun exposure and adequate light is conducive to pine sawyer breeding, resulting in higher PWD prevalence on the sunny side. The influence of slope is also interesting. The crossover point between a slope of 6°-26° in Fig. 4 shows that a gentle slope (6°-16°) is beneficial to the health of pine trees and is associated with a decreased belief of -31.40%. However, a steeper slope (16°-26°) increases belief by 24.16% when there is evidence of PWD. 5. Conclusions In this study, a BN approach was used to model the pre- valence of PWD. The results showed that EL, NDVI, DS and DR were important impact factors for explaining PWD prevalence in the study area. Based on the margi n- al probability distributions, PWD prevalence is highly sensitive to elevation above 30 m, with an increased be- lief of 88.07% for elevations between 30 m and 100 m and a decreased belief of 26.16% for elevations above 100 m. Future work should focus on the data uncertainty, include additional impact factors in the independent va- riables and apply the new hybrid BN model. 6. Acknowledgment This research was supported by the National Natural Science Foundation of China (Project No. 40901233). REFERENCES [1] Liebhold, A.M., Macdonald, W.L., Bergdahl, D., Maestro, V.C., INVASION BY EXOTIC FOREST PESTS - A THREAT TO FOREST ECOSYSTEMS. Forest Science 41(2) 1-49. (1995) [2] Waage, J.K., Reaser, J.K., A global strategy to defeat invasive species. Science 292(5521) 1486-1486. (2001) [3] Beckenbach, K., Smith, M.J., Webster, J.M., Taxonomic affinities and intra-and interspecific variation in Bursa- phelenchus spp. as determined by polymerase chain reac- tion. Journal of Nematology 24(1) 140. (1992) [4] Iwahori, H., Tsuda, K., Kanzaki, N., Izui, K., Futai, K., PCR-RFLP and sequencing analysis of ribosomal DNA of Bursaphelenchus nematodes related to pine wilt dis- ease. Fundamental and Applied Nematology 21(6) 655-666. (1998) [5] Mamiya, Y., History of pine wilt disease in Japan. Journal of Nematology 20(2) 219. (1988) [6] Tares, S., Abad, P., Bruguier, N., de Guiran, G., Identifi- cation and evidence for relationships among geographical  Bayesian Network and Factor Analysis for Modeling Pine Wilt Disease Prevalence Copyright © 2013 SciRes. JSEA 17 isolates of Bursaphelenchus spp.(pinewood nematode) using homologous DNA probes. Heredity 68(2) 157-164. (1992) [7] Togashi, K., Shigesada, N., Spread of the pinewood ne- matode vectored by the Japanese pine sawyer: modeling and analytical approaches. Population Ecology 48(4) 271-283. (2006) [8] Zhao, B.G., 2008. Pine Wilt Disease in China, Pine Wilt Disease. . Springer Japan, pp. Part I,18-25. [9] Pearl, J., 1988. Probabilistic reasoning in intelligent sys- tems: networks of plausible inference. Morgan Kauf- mann. [10] McCann, R.K., Marcot, B.G., Ellis, R., Bayesian belief networks: applications in ecology and natural resource management. Canadian Journal of Forest Research 36(12) 3053-3062. (2006) [11] Heckerman, D., A tutorial on learning with Bayesian networks. Innovations in Bayesian Networks 33-82. (2008) [12] Bromley, J., Guidelines for the use of Bayesian networks as a participatory tool for Water Resource Management. (2005) [13] Castelletti, A., Soncini-Sessa, R., Bayesian Networks and participatory modelling in water resource management. Environmental Modelling & Software 22(8) 1075-1088. (2007) [14] Marcot, B.G., Holthausen, R.S., Raphael, M.G., Rowland, M.M., Wisdom, M.J., Using Bayesian belief networks to evaluate fish and wildlife population viability under land management alternatives from an environmental impact statement. Forest Ecology and Management 153(1-3) 29-42. (2001) [15] Nyberg, J.B., Marcot, B.G., Sulyma, R., Using Bayesian belief networks in adaptive management. Canadian Jour- nal of Forest Research 36(12) 3104-3116. (2006) [16] Stelzenm, uuml, ller, V., Lee, J., Garnacho, E., Rogers, S.I., 2010. Assessment of a Bayesian Belief Net- work–GIS framework as a practical tool to support ma- rine planning. [17] Dlamini, W.M., A Bayesian belief network analysis of factors influencing wildfire occurrence in Swaziland. En- vironmental Modelling & Software 25(2) 199-208. (2010) [18] Friedman, N., Linial, M., Nachman, I., Pe'er, D., Using Bayesian networks to analyze expression data. Journal of Computational Biology 7(3-4) 601-620. (2000). |