Paper Menu >>
Journal Menu >>
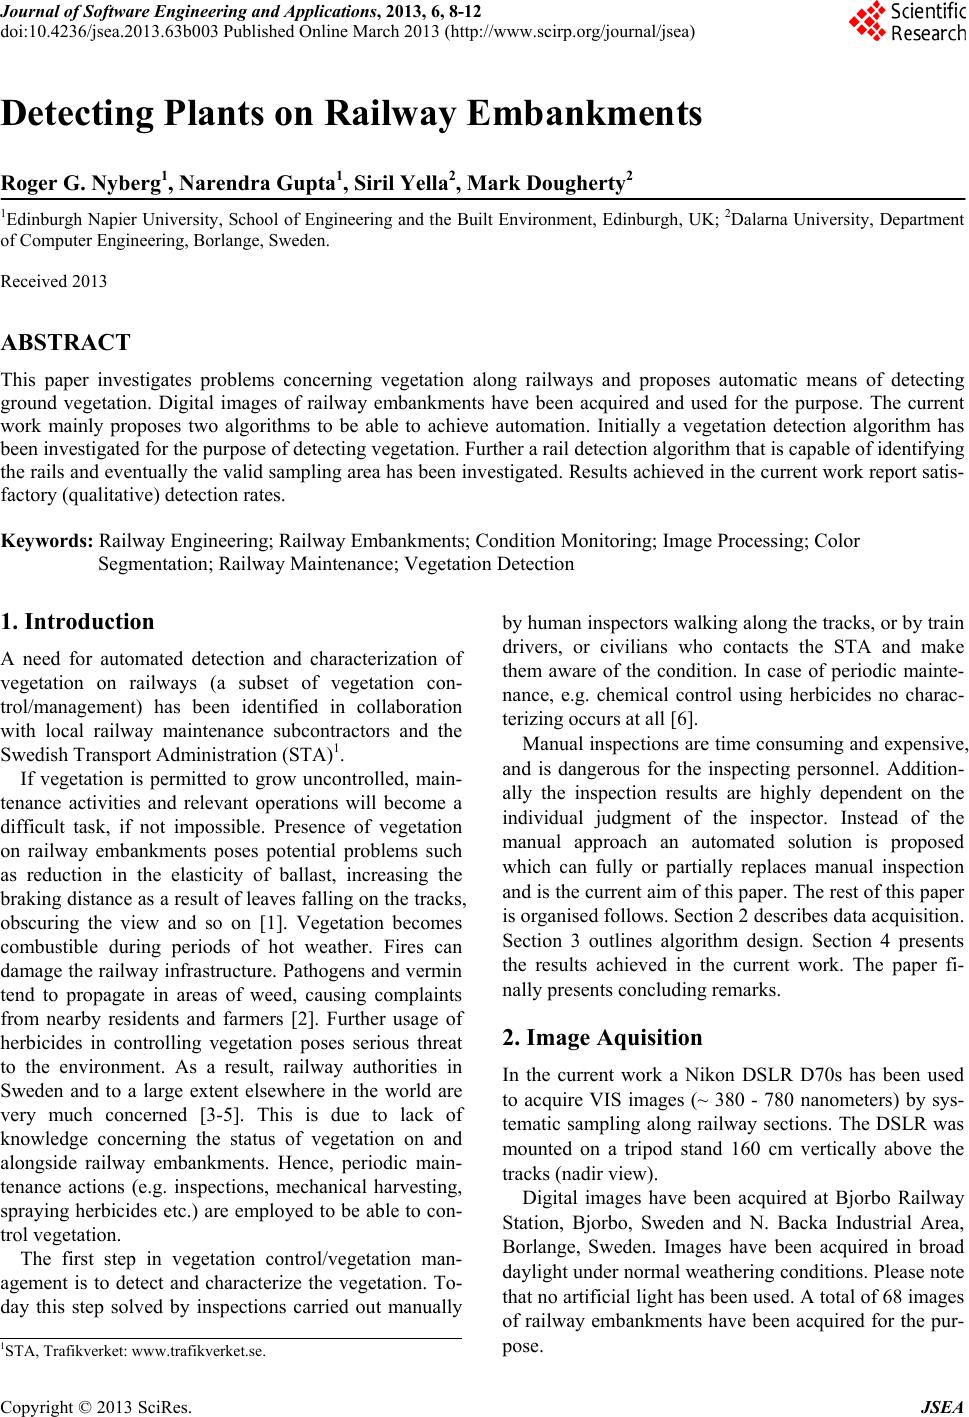 Journal of Software Engineering and Applications, 2013, 6, 8-12 doi:10.4236/jsea.2013.63b003 Published Online March 2013 (http://www.scirp.org/journal/jsea) Copyright © 2013 SciRes. JSEA Detecting Plants on Railway Embankments Roger G. Nyberg1, Narendra Gupta1, S i ril Yella2, Mark Do u g h erty2 1Edinburgh Napier University, School of Engineering and the Built Environment, Edinburgh, UK; 2Dalarna University, Department of Computer Engineering, Borlange, Sweden. Received 2013 ABSTRACT This paper investigates problems concerning vegetation along railways and proposes automatic means of detecting ground vegetation. Digital images of railway embankments have been acquired and used for the purpose. The current work mainly proposes two algorithms to be able to achieve automation. Initially a vegetation detection algorithm has been investigated for the purpose of detecting vegetation. Further a rail detection algorithm that is capable of identifying the rails and eventually the valid sampling area has been investigated. Results achieved in the current work report satis- factory (qualitative) detection rates. Keywords: Railway Engineering; Railway Embankments; Condition Monitoring; Image Processing; Color Segmentation; Railway Maintenance; Vegetation Detection 1. Introduction A need for automated detection and characterization of vegetation on railways (a subset of vegetation con- trol/management) has been identified in collaboration with local railway maintenance subcontractors and the Swedish Transport Administration (STA)1. If vegetation is permitted to grow uncontrolled, main- tenance activities and relevant operations will become a difficult task, if not impossible. Presence of vegetation on railway embankments poses potential problems such as reduction in the elasticity of ballast, increasing the braking distance as a result of leaves falling on the tracks, obscuring the view and so on [1]. Vegetation becomes combustible during periods of hot weather. Fires can damage the railway infrastructure. Pathogens and vermin tend to propagate in areas of weed, causing complaints from nearby residents and farmers [2]. Further usage of herbicides in controlling vegetation poses serious threat to the environment. As a result, railway authorities in Sweden and to a large extent elsewhere in the world are very much concerned [3-5]. This is due to lack of knowledge concerning the status of vegetation on and alongside railway embankments. Hence, periodic main- tenance actions (e.g. inspections, mechanical harvesting, spraying herbicides etc.) are employed to be able to con- trol vegetation. The first step in vegetation control/vegetation man- agement is to detect and characterize the vegetation. To- day this step solved by inspections carried out manually by human inspectors walking along the tracks, or by train drivers, or civilians who contacts the STA and make them aware of the condition. In case of periodic mainte- nance, e.g. chemical control using herbicides no charac- terizing occurs at all [6]. Manual inspections are time consuming and expensive, and is dangerous for the inspecting personnel. Addition- ally the inspection results are highly dependent on the individual judgment of the inspector. Instead of the manual approach an automated solution is proposed which can fully or partially replaces manual inspection and is the current aim of this paper. The rest of this paper is organised follows. Section 2 describes data acquisition. Section 3 outlines algorithm design. Section 4 presents the results achieved in the current work. The paper fi- nally presents concluding remarks. 2. Image Aquisition In the current work a Nikon DSLR D70s has been used to acquire VIS images (~ 380 - 780 nanometers) by sys- tematic sampling along railway sections. The DSLR was mounted on a tripod stand 160 cm vertically above the tracks (nadir view). Digital images have been acquired at Bjorbo Railway Station, Bjorbo, Sweden and N. Backa Industrial Area, Borlange, Sweden. Images have been acquired in broad daylight under normal weathering conditions. Please note that no artificial light has been used. A total of 68 images of railway embankments have been acquired for the pur- pose. 1STA, Trafikverket: www.trafikverket.se. 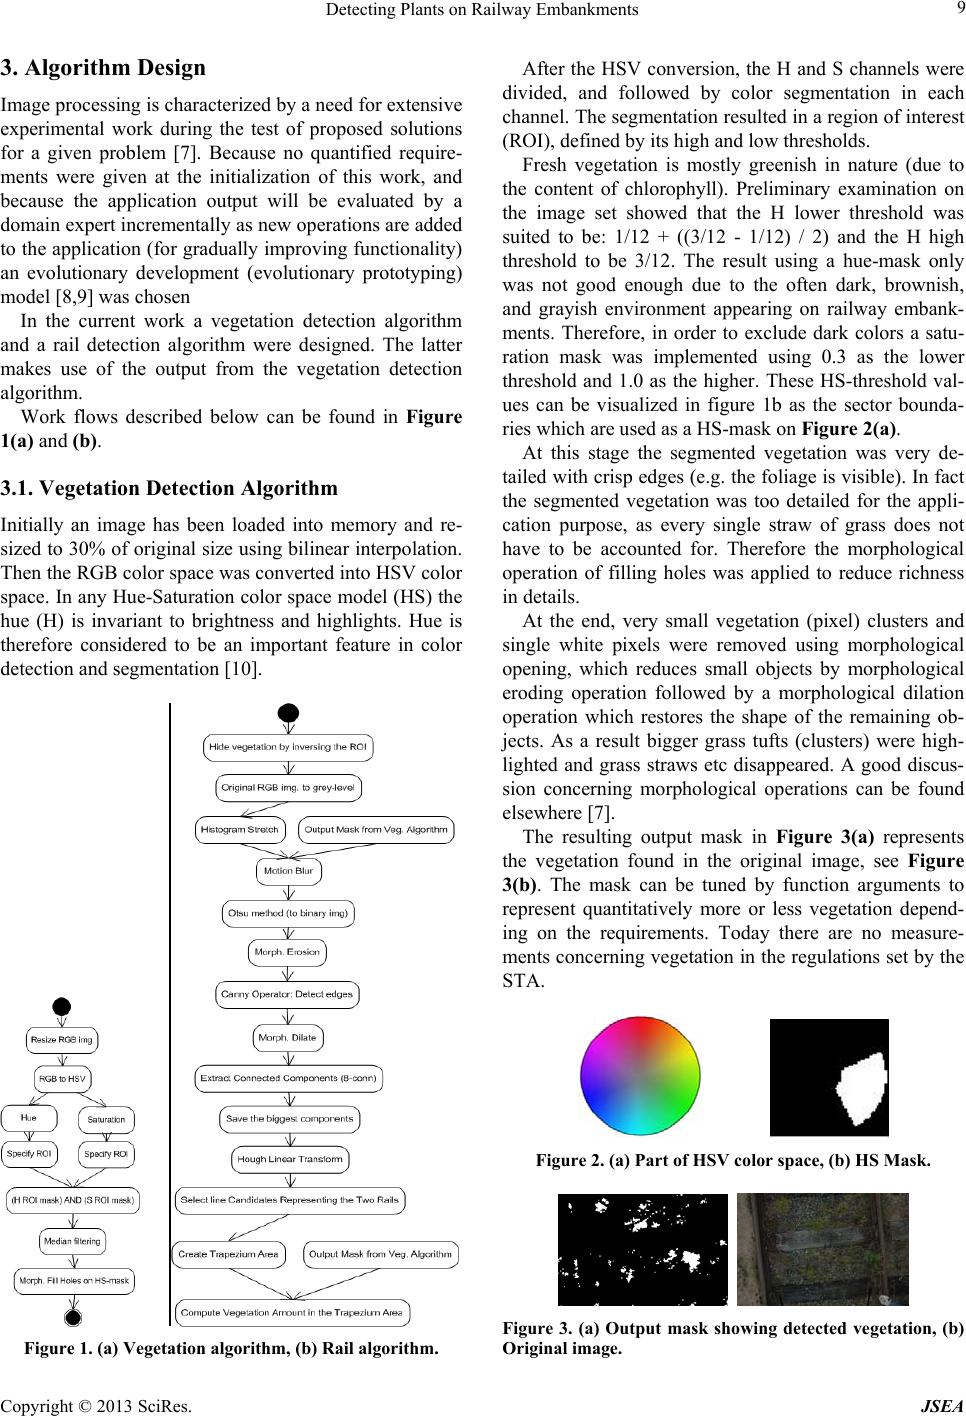 Detecting Plants on Railway Embankments Copyright © 2013 SciRes. JSEA 9 3. Algorithm Design Image processing is characterized by a need for extensive experimental work during the test of proposed solutions for a given problem [7]. Because no quantified require- ments were given at the initialization of this work, and because the application output will be evaluated by a domain expert incrementally as new operations are added to the application (for gradually improving functionality) an evolutionary development (evolutionary prototyping) model [8,9] was chosen In the current work a vegetation detection algorithm and a rail detection algorithm were designed. The latter makes use of the output from the vegetation detection algorithm. Work flows described below can be found in Figure 1(a) and (b). 3.1. Vegetation Detection Algorithm Initially an image has been loaded into memory and re- sized to 30% of original size using bilinear interpolation. Then the RGB color space was converted into HSV color space. In any Hue-Saturation color space model (HS) the hue (H) is invariant to brightness and highlights. Hue is therefore considered to be an important feature in color detection and segmentation [10]. Figure 1. (a) Vegetation algorithm, (b) Rail algorithm. After the HSV conversion, the H and S channels were divided, and followed by color segmentation in each channel. The segmentation resulted in a region of interest (ROI), defined by its high and low thresholds. Fresh vegetation is mostly greenish in nature (due to the content of chlorophyll). Preliminary examination on the image set showed that the H lower threshold was suited to be: 1/12 + ((3/12 - 1/12) / 2) and the H high threshold to be 3/12. The result using a hue-mask only was not good enough due to the often dark, brownish, and grayish environment appearing on railway embank- ments. Therefore, in order to exclude dark colors a satu- ration mask was implemented using 0.3 as the lower threshold and 1.0 as the higher. These HS-threshold val- ues can be visualized in figure 1b as the sector bounda- ries which are used as a HS-mask on Figure 2(a). At this stage the segmented vegetation was very de- tailed with crisp edges (e.g. the foliage is visible). In fact the segmented vegetation was too detailed for the appli- cation purpose, as every single straw of grass does not have to be accounted for. Therefore the morphological operation of filling holes was applied to reduce richness in details. At the end, very small vegetation (pixel) clusters and single white pixels were removed using morphological opening, which reduces small objects by morphological eroding operation followed by a morphological dilation operation which restores the shape of the remaining ob- jects. As a result bigger grass tufts (clusters) were high- lighted and grass straws etc disappeared. A good discus- sion concerning morphological operations can be found elsewhere [7]. The resulting output mask in Figure 3(a) represents the vegetation found in the original image, see Figure 3(b). The mask can be tuned by function arguments to represent quantitatively more or less vegetation depend- ing on the requirements. Today there are no measure- ments concerning vegetation in the regulations set by the STA. Figure 2. (a) Part of HSV color space, (b) HS Mask. Figure 3. (a) Output mask showing detected vegetation, (b) Original image. 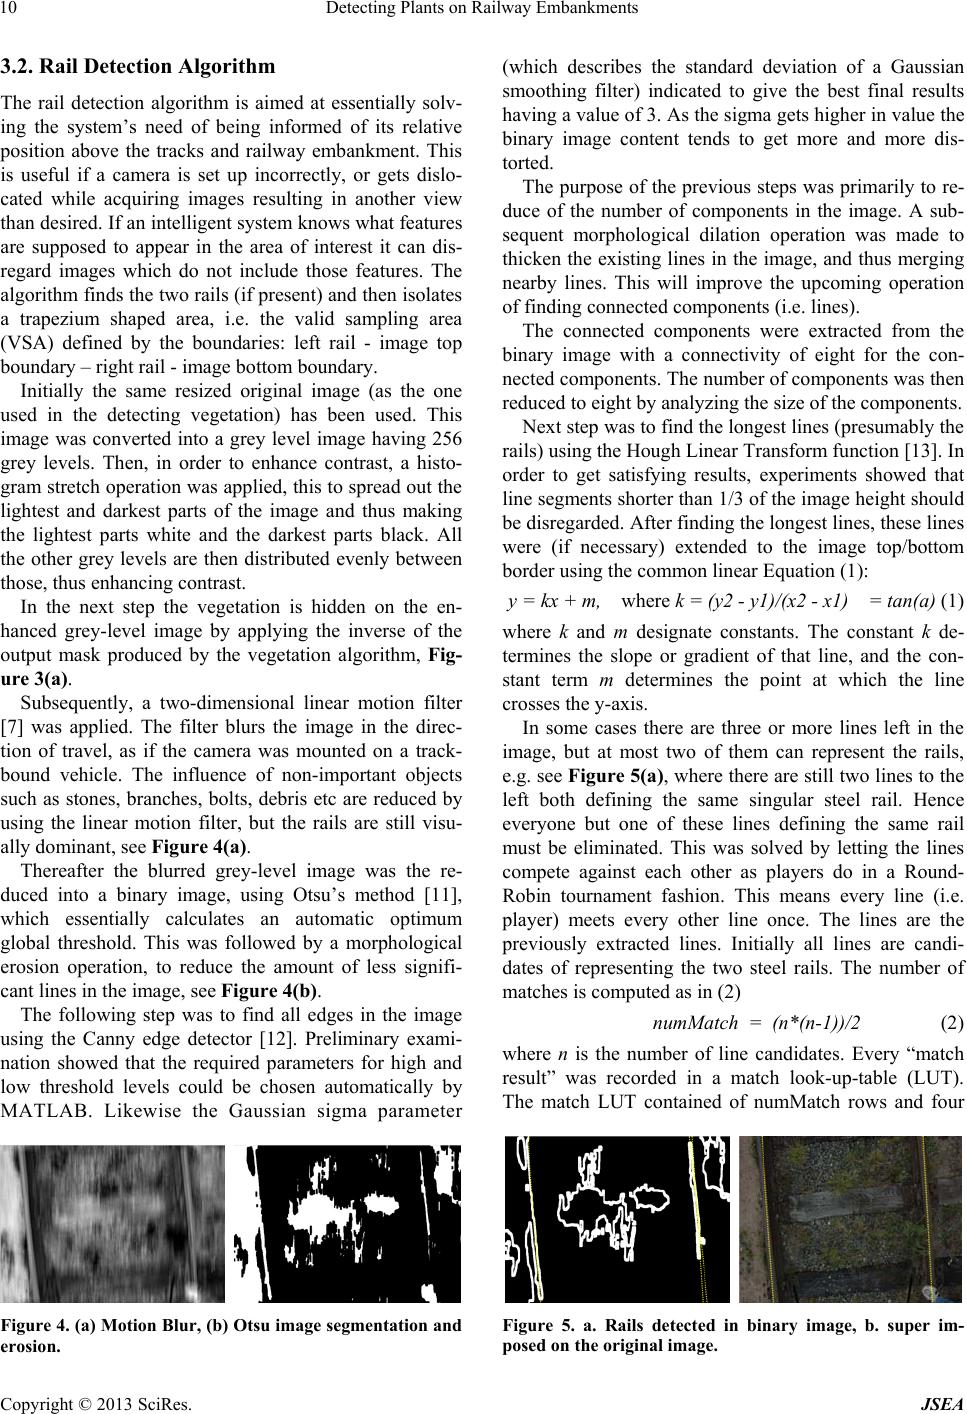 Detecting Plants on Railway Embankments Copyright © 2013 SciRes. JSEA 10 3.2. Rail Detection Algorithm The rail detection algorithm is aimed at essentially solv- ing the system’s need of being informed of its relative position above the tracks and railway embankment. This is useful if a camera is set up incorrectly, or gets dislo- cated while acquiring images resulting in another view than desired. If an intelligent system knows what features are supposed to appear in the area of interest it can dis- regard images which do not include those features. The algorithm finds the two rails (if present) and then isolates a trapezium shaped area, i.e. the valid sampling area (VSA) defined by the boundaries: left rail - image top boundary – right rail - image bottom boundary. Initially the same resized original image (as the one used in the detecting vegetation) has been used. This image was converted into a grey level image having 256 grey levels. Then, in order to enhance contrast, a histo- gram stretch operation was applied, this to spread out the lightest and darkest parts of the image and thus making the lightest parts white and the darkest parts black. All the other grey levels are then distributed evenly between those, thus enhancing contrast. In the next step the vegetation is hidden on the en- hanced grey-level image by applying the inverse of the output mask produced by the vegetation algorithm, Fig- ure 3(a). Subsequently, a two-dimensional linear motion filter [7] was applied. The filter blurs the image in the direc- tion of travel, as if the camera was mounted on a track- bound vehicle. The influence of non-important objects such as stones, branches, bolts, debris etc are reduced by using the linear motion filter, but the rails are still visu- ally dominant, see Figure 4(a). Thereafter the blurred grey-level image was the re- duced into a binary image, using Otsu’s method [11], which essentially calculates an automatic optimum global threshold. This was followed by a morphological erosion operation, to reduce the amount of less signifi- cant lines in the image, see Figure 4(b). The following step was to find all edges in the image using the Canny edge detector [12]. Preliminary exami- nation showed that the required parameters for high and low threshold levels could be chosen automatically by MATLAB. Likewise the Gaussian sigma parameter Figure 4. (a) Motion Blur, (b) Otsu image segmentation and erosion. (which describes the standard deviation of a Gaussian smoothing filter) indicated to give the best final results having a value of 3. As the sigma gets higher in value the binary image content tends to get more and more dis- torted. The purpose of the previous steps was primarily to re- duce of the number of components in the image. A sub- sequent morphological dilation operation was made to thicken the existing lines in the image, and thus merging nearby lines. This will improve the upcoming operation of finding connected components (i.e. lines). The connected components were extracted from the binary image with a connectivity of eight for the con- nected components. The number of components was then reduced to eight by analyzing the size of the components. Next step was to find the longest lines (presumably the rails) using the Hough Linear Transform function [13]. In order to get satisfying results, experiments showed that line segments shorter than 1/3 of the image height should be disregarded. After finding the longest lines, these lines were (if necessary) extended to the image top/bottom border using the common linear Equation (1): y = kx + m, where k = (y2 - y1)/(x2 - x1) = tan(a) (1) where k and m designate constants. The constant k de- termines the slope or gradient of that line, and the con- stant term m determines the point at which the line crosses the y-axis. In some cases there are three or more lines left in the image, but at most two of them can represent the rails, e.g. see Figure 5(a), where there are still two lines to the left both defining the same singular steel rail. Hence everyone but one of these lines defining the same rail must be eliminated. This was solved by letting the lines compete against each other as players do in a Round- Robin tournament fashion. This means every line (i.e. player) meets every other line once. The lines are the previously extracted lines. Initially all lines are candi- dates of representing the two steel rails. The number of matches is computed as in (2) numMatch = (n*(n-1))/2 (2) where n is the number of line candidates. Every “match result” was recorded in a match look-up-table (LUT). The match LUT contained of numMatch rows and four Figure 5. a. Rails detected in binary image, b. super im- posed on the original image.  Detecting Plants on Railway Embankments Copyright © 2013 SciRes. JSEA 11 columns. The 1st and 2nd column contains the line ids. The 3rd and 4th column represents the distance (differ- ence in pixels) between the two lines first and second endpoints (only x-values), in the current match. The match LUT was then evaluated using these criteria: First criterion: If the distance between the two lines (in the current ”match”) is close to the rail gauge distance, then add these pair of lines to the candidate set, then con- tinue evaluate towards the second criteria. Else if, the pair of lines not rail candidates, so disre- gard their match. Note that one of the rails in a pair might be a candidate on its own together with some other line within correct distance, but that would be apparent in another match against some other line. Second criterion: If the first criterion was met, then: If there is only two pair of lines in the set, i.e. one match left in the match LUT, then these lines are selected to represent the two rails in the image. Else if, there are more than two pair of lines in the candidate set, and then select the pair of lines which has the smallest angle θ given by (3): u ∙ v = |u| |v| cos θ (3) where u and v denotes the two vectors (i.e. the line pair representing rails. C denotes the (for each image) the image height in pixels. |u| and |v| denotes the length (magnitude) of |u| and |v| respectively, as in (4) |u| = √((x3-x1)2+C2) and |v| = √((x4 – x2)2 + C2) (4) If two lines in a match have an angle θ = 0 then these lines are deemed to be parallel. Note that only two lines should be left, each representing one of the two steel rails. The selected lines define a trapezium limited by the rails and the image upper and lower boundary. This area was selected to be the VSA in which to compute the plant cover [14,15]. The vegetation algorithm has already produced a mask of all vegetation in the full image area, so the area was reduced to the VSA (see section 3A). The plant cover in the trapezium was calculated as in (5) (Number of vegetation pixels)/(Number of trapezium pix- els) (5) 4. Results and Discussion The rail detection algorithm finds every rail in the image set, equaling a hit rate of 100%. It finds the rail even when the rail appearance is different, i.e. different de- grees of rustiness and shininess, and rail orientation, and despite the outdoor weather conditions, i.e. uncontrolled lighting conditions. Additionally, with help of the vege- tation algorithm it computes the vegetation cover in the valid sample area, a trapezium area, i.e. between the two rails and the upper and lower image boundary. There are no measurements concerning vegetation set by STA in their regulations or handbooks. This problem is inherited when inspecting vegetation, because there is nothing to validate against. The output of the vegetation detection algorithm is a mask representing the cover at- tribute (See [14,15]). Although there are no measure- ments to evaluate against, the results are comparable with each other, relatively, and can serve as a first step to- wards a standardization of how to quantify vegetation on railway embankments. Today when railway vegetation control contracts are signed (between the STA and a subcontractor) none of the involved actors are aware the status of vegetation. The status of vegetation often becomes apparent when maintenance actions are to be carried out on-site and are hence not economically viable. 5. Conclusion The main objective of this work was twofold as follows: Firstly to investigate problems of vegetation inspections on railway embankments as well as to investigate current day vegetation control/management activities, and sec- ondly to propose algorithms showing how to automate future inspections of a restricted area on a railway em- bankment. In this work a vegetation detection algorithm and a rail detection algorithm was designed and imple- mented in order to reveal the vegetation status along railways. Future work includes near-infrared imagery to better detect the light reflected by green chlorophyll plants. Further on, because the allowed herbicide Gly- phosate has problems of killing woody plants, an auto- mation of identifying problematic plants would be bene- ficial. An identification of woody plants, including their spatial location, can then result in targeted mechanical harvesting, i.e. a condition-based maintenance can be enforced, often leading to reduced costs. A similar ap- proach as in this experiment can be later carried out by mounting a digital camera on a vehicle that is capable of running on tracks. 6. Acknowledgment Special thanks to the Swedish Transport Administration (Trafikverket), and Scandinavian Track Group (STG), RailDoc AB, and Infra Tech Consulting AB (ITC) during the identification process of common problems for maintenance subcontractors and national railway admin- istrators. REFERENCES [1] B. Hulin and S. Schussler. Measuring vegetation along railway tracks. pages 561- 565, Sept. 2005. [2] T. Hayakawa. Vegetation control through selective elimi- nation of large-size weeds on embankments using growth 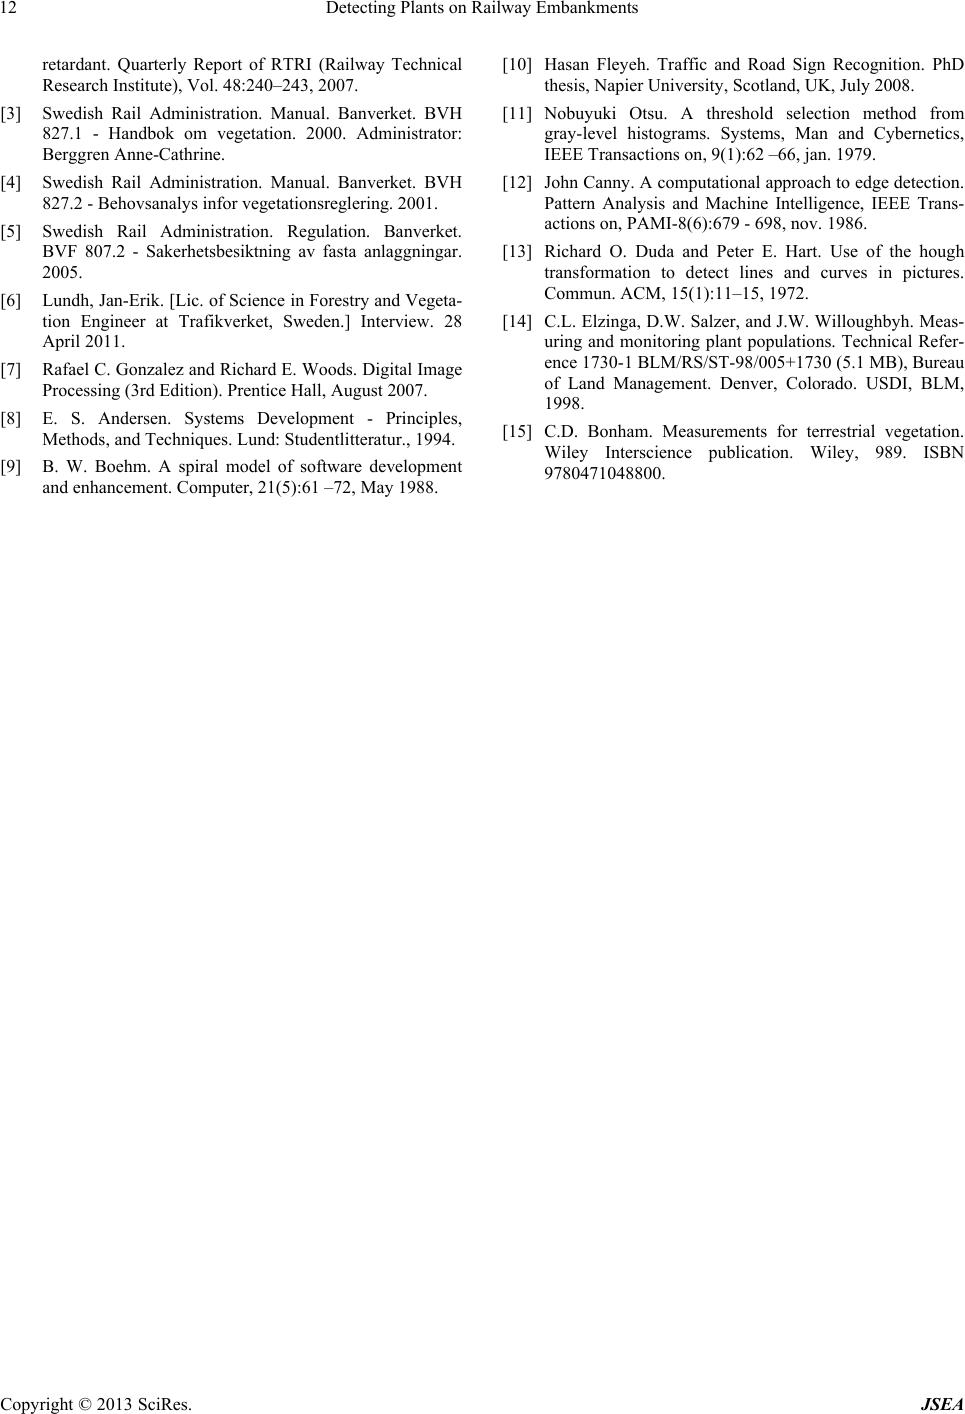 Detecting Plants on Railway Embankments Copyright © 2013 SciRes. JSEA 12 retardant. Quarterly Report of RTRI (Railway Technical Research Institute), Vol. 48:240–243, 2007. [3] Swedish Rail Administration. Manual. Banverket. BVH 827.1 - Handbok om vegetation. 2000. Administrator: Berggren Anne-Cathrine. [4] Swedish Rail Administration. Manual. Banverket. BVH 827.2 - Behovsanalys infor vegetationsreglering. 2001. [5] Swedish Rail Administration. Regulation. Banverket. BVF 807.2 - Sakerhetsbesiktning av fasta anlaggningar. 2005. [6] Lundh, Jan-Erik. [Lic. of Science in Forestry and Vegeta- tion Engineer at Trafikverket, Sweden.] Interview. 28 April 2011. [7] Rafael C. Gonzalez and Richard E. Woods. Digital Image Processing (3rd Edition). Prentice Hall, August 2007. [8] E. S. Andersen. Systems Development - Principles, Methods, and Techniques. Lund: Studentlitteratur., 1994. [9] B. W. Boehm. A spiral model of software development and enhancement. Computer, 21(5):61 –72, May 1988. [10] Hasan Fleyeh. Traffic and Road Sign Recognition. PhD thesis, Napier University, Scotland, UK, July 2008. [11] Nobuyuki Otsu. A threshold selection method from gray-level histograms. Systems, Man and Cybernetics, IEEE Transactions on, 9(1):62 –66, jan. 1979. [12] John Canny. A computational approach to edge detection. Pattern Analysis and Machine Intelligence, IEEE Trans- actions on, PAMI-8(6):679 - 698, nov. 1986. [13] Richard O. Duda and Peter E. Hart. Use of the hough transformation to detect lines and curves in pictures. Commun. ACM, 15(1):11–15, 1972. [14] C.L. Elzinga, D.W. Salzer, and J.W. Willoughbyh. Meas- uring and monitoring plant populations. Technical Refer- ence 1730-1 BLM/RS/ST-98/005+1730 (5.1 MB), Bureau of Land Management. Denver, Colorado. USDI, BLM, 1998. [15] C.D. Bonham. Measurements for terrestrial vegetation. Wiley Interscience publication. Wiley, 989. ISBN 9780471048800. |