Electrical Metrology Applications of LabVIEW Software
116
measurements report.
3.2. Functions Specification
Functions specification illustrates how each requirement
is to be met. Adding together, it should emphasize any
inconsistency if complete agreement is not realistic. The
functional specification covers [6,7]:
Software and hardware environment.
Description of the software’s functions.
Input and the output data.
Operator’s interface to the system.
Special restrictions that will be applied to the system.
Software management.
Finally, the function specifications will cover all the
details of how the end-user of the automatic system is to
interact with this system. Eventually, each function de-
scribed will require a test to prove compliance with the
specification. Therefore, this document will be used as
the input to the functional test.
3.3. Software Design
The software design is a record of how the requirements
will be implemented. The design document may use state
diagrams, flowcharts or formal methods to describe the
software design. In this case, LabVIEW is used as the
development language. It is a rapid development system
and provides useful documentation tools that can be used
in the development of the design document. The design
document includes the program structure on the base of
LabVIEW Virtual Instruments (VI) hierarchy, module
(VI) design, LabVIEW coding conventions and Lab-
VIEW tools [8]. Each module defined in this design will
require a test to verify compliance with the requirements.
3.4. Implementation and Testing
When the software design is finished the software can be
fully implemented. The code is created concerning de-
cided design of the software. LabVIEW is a graphical
programming language and states transition diagram to
follow the coding conversion declared in the design. The
module test is executed to prove that each module (VI)
requirement in the design document is fulfilled. The ex-
cellent test will illustrate that the module achieves the
designed function. The functional test is performed as
well. This test level is higher than the level of the module
test. It tests how the modules work together concerning
functions defined in the functional specification. More-
over, it tests the operator interfaces and output results for
stability and accuracy. After module and functional suc-
cessfully testing, the operational testing is performed by
implementing the LabVIEW software in the calibration
system. It is preferred to perform the functional tests
once more in the final version of the LabVIEW software.
3.5. LabVIEW Front Panel and Block Diagram
NIS LabVIEW software for calibrating zener diode ref-
erence standards as well as electrical sourcing and meas-
uring instruments have been built following the applica-
tion of the previous procedures. LabVIEW consists of
two main components: the front panel and the block dia-
gram; besides, it also contains a comprehensive library
for data collection, analysis, presentation and storage.
Program execution is determined by the structure of a
graphical block diagram on which the programmer con-
nects different function nodes by drawing wires. These
wires propagate variables and any node can execute as
soon as all its input data become available. The front
panel is used to interact with the user when the program
is running. User can control the program, change inputs,
and see data updated in real time [9,10]. The front panel
and the block diagram of the automatic calibration sys-
tems have been carried out. Uncertainty of measurement
is the doubt that exists about the result of any measure-
ment. For every measurement—even the most care-
ful—there is always a margin of doubt. International me-
trology organizations recommend that uncertainties
should have two types, “Type A” and “Type B”, based
on the method by which they are evaluated [11]. Where,
“Type A” is the uncertainty using statistics (usually from
repeated readings). While, “Type B” evaluation is the
uncertainty estimate from any other information. The
combined uncertainty equals to the root sum square of all
the uncertainty contributions. The expanded uncertainty
is obtained by multiplying the combined uncertainty by
coverage factor “k”. The value of coverage factor gives
the confidence level for the expanded uncertainty. Most
commonly, the overall uncertainty is scaled by using the
coverage factor k = 2, to give a level of confidence of
approximately 95% [11,12]. The new automatic calibra-
tion systems have the facility to automatically calculate
the measurements repeatability, store the data, record,
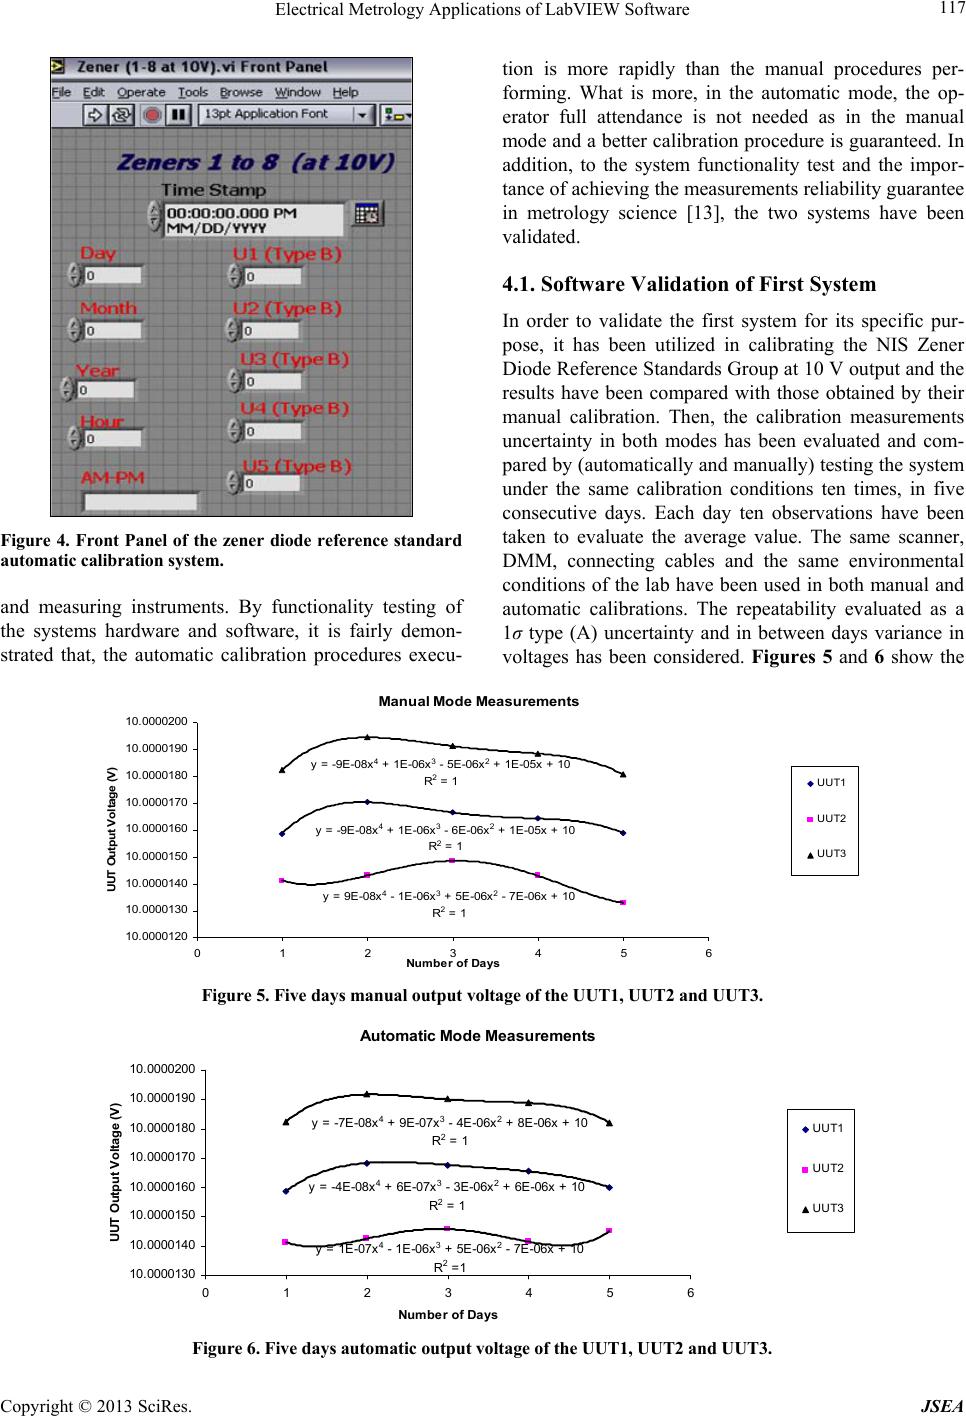
and report the calibration results. Thirty readings have
been automatically taken and transferred to the excel
sheets by the software. For example, Figure 4 illustrates
the automatic zener diode reference standards calibration
system front panel. It includes the exact time and date of
performing the calibration adding to the different (Type
B) uncertainty components which contribute in the un-
certainty budget. The uncertainty of the calibration mea-
surements has been estimated based on the ISO/IEC
17025 [12] and the expanded uncertainty has been re-
ported by the software.
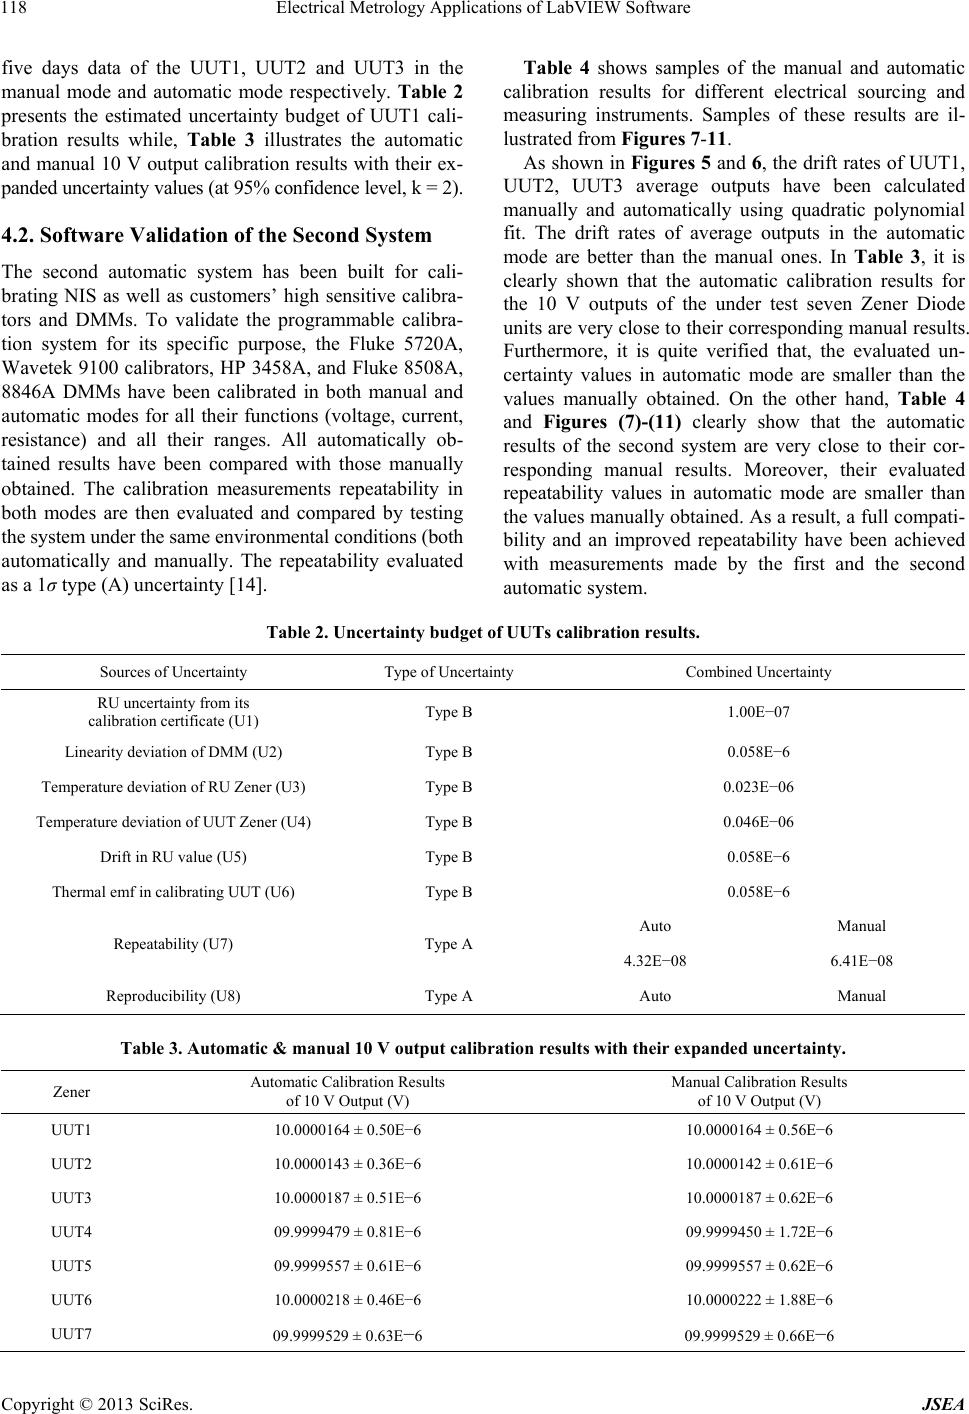
4. Results and Software Validation
The two automatic systems have been constructed for
calibrating the Zener Diode Reference Standards (1.018
V and 10 V outputs), as well as the electrical sourcing
Copyright © 2013 SciRes. JSEA