 Crystal Structure Theory and Applications, 2013, 2, 16-27 http://dx.doi.org/10.4236/csta.2013.21003 Published Online March 2013 (http://www.scirp.org/journal/csta) Kinetics and Mechanism of Spontaneous Crystallization of Potassium Nitrate from Its Supersaturated Aqueous Solutions Oleg D. Linnikov*, Irina V. Rodina, Igor G. Grigorov, Evgeniy V. Polyakov Institute of Solid State Chemistry, Ural Branch of the Russian Academy of Sciences, Ekaterinburg, Russia Email: *linnikov@mail.ru Received October 19, 2012; revised December 3, 2012; accepted December 14, 2012 ABSTRACT Kinetics of spontaneous crystallization of potassium nitrate from its supersaturated aqueous solutions has been studied simultaneously by electrical conductance and optical transmittance methods. It was found that spontaneous crystalliza- tion of potassium nitrate was accompanied by aggregation of crystals. Growth of salt crystals was in the kinetic mode of the growth process, and was described by the equation of the first order regarding supersaturation of solution. The mechanism of aggregation and intergrowth of crystals during bulk crystallization via formation of nucleus-bridges be- tween crystals found earlier for several salts was confirmed. Specific surface energy of potassium nitrate was evaluated on the basis of the above mechanism of aggregation and intergrowth of crystals. The established value of the specific surface energy was reasonable and agreed satisfactorily with the available literature data. Examination of crystal deposit after completion of crystallization allowed detecting crystal agglomerates of freakish and irregular forms, which may be considered as the direct confirmation of the above mechanism of intergrowth of crystals. Kinetics of crystallization, aggregation and size distribution of salt crystals after completion of crystallization have been satisfactory described by the earlier proposed model of the crystallization process. An excellent agreement was established between the experi- mental data on potassium nitrate solubility in aqueous solutions found in the present work and those available in the literature. Keywords: Potassium Nitrate; Aggregation; Crystallization; Solubility; Activation Energy; Crystal Growth; Intergrowth; Agglomerates 1. Introduction Very scarce information about crystallization kinetics of potassium nitrate in aqueous solutions is available in the literature. There are only a few works where crystalliza- tion of potassium nitrate from aqueous solutions was studied [1-3]. So, Helt and Larson [1] investigated the crystallization of KNO3 using MSMPR crystallizer. The operation temperature was from 10˚C to 25˚C, and a de- gree of supersaturation was varied within 0.005 - 0.01. The order of the crystal growth process was found to be 1 and the activation energy of the growth process was 31 kJ·mol−1 [1]. The crystal growth rate ranged in the inter- val . Later, Graber et al. [2] stud- ied the growth of seed crystals of sodium and potassium nitrates from aqueous solutions in a perfectly stirred batch crystallizer. It was also found that the order of the crystal growth process was 1 for both salts. The maxi- mum crystal growth rate was directly proportional to the seed crystal size. The activation energy of the growth 8 3.5 - 10.710ms process for potassium nitrate was 24.512 kJ·mol−1, and the process was under diffusion control [2]. The growth rate of different faces of single potassium nitrate crystals from aqueous solution was studied by Lacmann et al. with the aid of optical microscopical method [3]. For some crystals, the surface morphology was determined by means of light microscopy, scanning electron microscopy, Michelson interferomtry or scan- ning force microscopy [3]. Crystals were grown under constant supersaturation at 15˚C - 20˚C. The relative su- persaturation was in the range from 0.3% to 1.8%. In- tense dispersion of the crystal growth rates was observed. For all crystal faces, the order of the crystal growth process was between 1.15 and 1.60 [3]. Examination of the surface morphology showed that crystal faces had a flat structure; no significant objects were found. 1 The present work deals with spontaneous crystalliza- tion of potassium nitrate from its supersaturated aqueous solutions. The objective of this work was to study (in situ) kinetics of spontaneous crystallization of potassium ni- trate from its supersaturated aqueous solutions using si- *Corresponding author. C opyright © 2013 SciRes. CSTA  O. D. LINNIKOV ET AL. 17 multaneously two methods of measurement: 1) electrical conductivity; and 2) optical transmittance of a super- saturated solution in salt crystallization. 2. Experimental 2.1. Experimental Setup The experiments were carried out on a laboratory setup with a glass crystallization vessel of 250 cm3 capacity. The volume of a supersaturated solution of KNO3 was 165 cm3. The laboratory setup was analogous to that used in [4], and it allowed to conduct simultaneously and automatically computer records of electrical conductivity W and optical transmittance I of the supersaturated solu- tion during salt crystallization. The concentration of the salt during crystallization was determined from electrical conductivity of the solution using calibration curves. The principal diagram of the laboratory setup is shown in Figure 1. 2.2. Experimental Procedure Supersaturation in investigated salt solution was created by thermic method. For this, supersaturated solution of KNO3 in the crystallization vessel was heated on 5˚C - 10˚C above the saturation temperature in order to dis- solve small salt crystals, and then it was stayed at this temperature about 0.5 h. After that the solution was cooled to the temperature below the saturation tempera- ture. When the required temperature was achieved, a magnet stirrer was turned on, and spontaneous crystalli- zation of KNO3 started after a certain time (induction period). Simultaneously, the electrical conductance and optical transmittance of the solution during salt crystalli- zation were recorded automatically. After the crystallization was completed, the stirrer was switched off and a variation in optical transmittance of the solution was registered during sedimentation of formed potassium nitrate crystals. Analogous curves of variation of optical transmittance of solutions during sedimentation are used in photo-sedimentation method for determination of particle-size distributions of pow- ders [5]. Therefore, the obtained curve also was used to calculate the particle-size distribution of the formed salt crystals, and for determination of the optical absorption constant Kc of the salt [5]. After sedimentation, the most part of the solution was decanted, and salt crystals were rapidly (during 3 - 5 s) filtered under vacuum-suction using a ceramic filter, and then on the filter immediately were washed with ethanol saturated by KNO3. Then salt crystals on the filter were air-dried under vacuum-suction. These operations made it possible to remove remainders of the solution from crystals and prevent their intergrowth during air-drying. The crystalline product formed in each run was imaged with optical and SE microscopy. Two liquid samples (5 ml) were collected from the solution. The first probe was taken from the supersatu- rated solution at the beginning of the crystallization proc- ess, and the second one-after the end of the crystalliza- tion. The samples were evaporated and dried at 80˚C, and then weighed. The salt concentrations in the solution were subsequently calculated from the mass of anhy- drous solid and the volume (5 ml) of samples. In the process of crystallization, the solution was kept (thermostated) in the crystallization vessel at constant temperature (0.1˚C) and vigorously agitated with a magnetic stirrer. The rotation frequency of the stirrer was 450 rpm. The error in optical transmittance measure- ments was 1.5%; the root-mean-square deviation of the measured electrical conductivity was 0.2%. The solutions were prepared using analytical grade salt and distilled water. For additional purification, the solu- tions were recrystallized by thermal evaporation. Ex- periments were carried out at temperature 16.3˚C - 39.6˚C in the range of 01. 0 11. 0 6CC . The experimental data were mathematically treated using the following equations [4]: 0 d d T S CKC C v (1) WabС (2) 0 0log c I DKS (3) 2 3 0 1 π6 T ci D N CCv (4) 13 6 π i T CCv dN (5) where d is the average diameter of salt crystals formed in the solution (m); τ is the time (s); ρT is the density of salt crystals 3 kg m ; S is the total surface area of growing salt crystals (m2); v is the volume of the solution 3 m; C0 is the concentration of the saturated salt solu- tion 3 kg m ; C is the concentration of the supersatu- rated salt solution at the moment of time ; Ci is the initial concentration (before crystallization, at = 0) of the supersaturated salt solution ; K is the average coefficient of the growth rate of salt crystals; z is the order of the salt crystal growth process (usually z = 1 - 2); W is the electrical conductivity of the salt solution in a relative scale of measurement (mV); a, b are the re- gression coefficients; D0 is the optical density of the salt solution in the course of crystallization; I0, I are the opti- cal transmittance of the salt solution at the initial moment of time and at moment of time , respectively (%); Kc is the optical absorption constant of the salt (m−2); N is the 3 kg m 3 kg m Copyright © 2013 SciRes. CSTA  O. D. LINNIKOV ET AL. 18 total number of growing salt crystals in the solution; Ψ is the spherical coefficient of salt crystals [6]. Formula (1) is the well-known empirical equation, which describes the rate of salt crystallization from su- persaturated solutions after the end of the induction pe- riod when nucleation of salt crystals in the solution is usually completed [2,4,7-9]. Equation (2) describes elec- trical conductivity of salt solutions in the examined con- centration range. Formula (3) represents the Wagner’s law [5], according to which the optical density of a sus- pension with a small content of the solid phase is directly proportional to the total surface area S of solid particles (here, the total surface area of growing salt crystals) con- tained in the solution. This law is valid when the size of solid particles exceeds 2 μm. In every run of this study, the Wagner’s law was valid. This was verified in special runs. The optical absorption constant Kc in Equation (3) was determined at sedimentation of formed salt crystals after the crystallization was completed. Equations (4) and (5) make it possible to calculate the total number and the average diameter of the crystals formed during crystallization [4]. So, if m is the mass of salt precipitated from solution and N is the total number of salt crystals in the solution, then the average mass mc of one salt crystal is kg c mmN and the aver- age volume of one salt crystal vc is ccT vm . There- fore, under assumption that the shape of the crystal is nearly spherical, its average diameter is determined by the equation 13 c 6πdv (6) From this, the average surface area of one salt crystal S is 23 2 ππ6π c Sd v (7) Expressing vc in terms of a change in the solution concentration during crystallization and the total number N of formed salt crystals, we obtain formula (5). Often in the description of processes occurring in solu- tions (crystallization, sedimentation, etc.) it is convenient to consider crystals as ball-shaped particles. However, the shape of most crystals differs sharply from a sphere. In this case a correction factor (a spherical coefficient) should be introduced [6]: c S S (8) where Sc is the surface area of a crystal (m2); Ss is the surface area of a sphere calculated under condition that the volume of the sphere equals to the volume of the crystal (m2). The spherical coefficient Ψ makes it possible to con- sider crystals of different shapes as ball-shaped particles. With account of the fact that SSN, Equation (3) may be transformed by using formulas (5)-(8) into 23 2 0 0 6 ππ log π i cc c T CCv INdN DKSKK IN (9) Then we derive Equation (4) from expression (9). Integration of Equation (1) for the simplest case of z = 1 and the subsequent joint solution with Equations (2) and (3) gives the average coefficient of the growth rate of salt crystals 0 00 0 ln c Ti vC KDCC C (10) where τ0 is the time, after which only crystal growth process occurs in the solution (nucleation of crystals is completed or negligible); iis the concentration of the supersaturated salt solution at the moment of time τ0 (kg·m−3). C As was mentioned above, the crystal-size distribution was found when the crystallization was completed using curves of variation of optical transmittance of solutions during sedimentation of formed salt crystals. The diame- ters of the formed crystals during their sedimentation were calculated using the equation [5,6]: 18 0.843log 0.065 i Ti H dg (11) where μ is the dynamic viscosity of the saturated salt solution (Pa·s); ρ is the density of the saturated salt solu- tion (kg·m−3); H is the sedimentation height (see Figure 1) of crystals (m); τi is the time required for sedimenta- tion of crystals having the diameter . The viscosity and density of the saturated salt solutions were measured in special runs using an efflux viscometer and a set of areometers. s i d Figure 1. Principal diagram of a laboratory setup: 1— crystallization vessel containing supersaturated salt solution; 2—electric heater; 3—thermometer probe; 4—thermo re- gulator; 5—magnetic stirrer; 6—platinum conductometric electrodes; 7—electrical conductance meter; 8—light; 9— light-sensitive device; 10—amplifier; 11—analog-digital con- verter; 12—computer; 13—thermometer; 14—cover; H-sedi- mentation height. Copyright © 2013 SciRes. CSTA  O. D. LINNIKOV ET AL. 19 3. Results and Discussion 3.1. Spherical Coefficient To determine the spherical coefficient, 514 images of potassium nitrate crystals formed in the present experi- ments were measured. We could not make microphoto- graphs of crystals in all dimensions and, therefore, we had no possibility to measure the size (height) of formed potassium nitrate crystals perpendicularly to a plane of photos. So for its evaluation we considered the parame- ters of the unit cell for a modification of KNO3 with or- thorhombic structure. There is a following basis for this. First, although in reality the crystallographic cell does not define the crystal shape of crystal, but relations be- tween dimensions of a crystal often are approximately like in the cell (consider, for example, such salts like NaCl or KCl). Second, at aggregation of crystals at bulk crystallization there is always a morphological selection of formed agglomerates of crystals. Most of aggregates have a correct form with low hydrodynamic resistance, and what is more, the most agglomerates look like mono- crystals although in actual fact they are pseudo-mono- crystals. Hence, for these agglomerates the relation be- tween their dimensions is the same like for individual crystal. At measurements the crystals were imagined as paral- lelepipeds, and a ratio between length and width of them was calculated. The ratio found was 1.73 and was close to its theoretical value 1.43 for the parameters of the unit cell for modification of KNO3 with orthorhombic struc- ture (а = 0.54119 nm, b = 0.91567 nm, с = 0.64213 nm [3], 1.43bc). As was mentioned above, it was not possible to measure the height of formed potassium ni- trate crystals, so for calculations of the spherical coeffi- cient, the ratio was used, it was close to the above structural parameters. The calculated spherical coefficient was 0.77. This value was used in all further calculations. It should be noted, however, that, taking into account accepted above assumption about relations between dimensions of salt crystal, this calcu- lated value of the spherical coefficient was approximate. ::0.8 :1.73 :1abc 3.2. Initial Period of Spontaneous Crystallization As was mentioned above, the initial supersaturation of KNO3 solutions was very small. Therefore, spontaneous crystallization of potassium nitrate was accompanied by a long induction period. Typical experimental curves describing the variation of the optical transmittance I and electrical conductivity W of the salt solution in the course of the crystallization are shown in Figure 2. As is seen from Figure 2, in the initial period of crys- tallization, the optical transmittance of the solution slightly changes, whereas the electrical conductivity re- mains unchanged during about 70 s. Then some dramatic change in the optical transmittance and electrical con- ductivity of the solution occurs after about 80 and 70 s, respectively. This corresponds to an induction period of the salt crystallization. Different duration of the induc- tion period for I (about 80 s) and W (about 70 s) reflects different sensitivities of the employed measurement techniques. 3.3. Variation of the Average Diameter and the Total Number of Salt Crystals during Crystallization Typical curves of the variation of the average diameter and the total number of salt crystals in solution during crystallization are shown in Figure 3. The curves were calculated from experimental data using Equations (4) and (5). It is seen from Figure 3 that the calculated depend- ences of the average diameter and the total number of salt crystals in the solution change non-monotonously with time during crystallization. According to these cal- culations in the initial period of the crystallization, the salt crystals are large, and their average diameter is about 140 μm. And there are only a few salt crystals in the so- lution. Then a drastic reduction in the average diameter of salt crystals takes place (in 100 s), and the total num- ber of salt crystals in the solution sharply increases. But after about 120 s the average diameter of salt crystals Figure 2. Electrical conductivity W (in a relative scale of measurement) and optical transmittance I of the salt so- lution during spontaneous crystallization (run 1) vs. time. Figure 3. Calculated dependences of the average diameter d and the total number of salt crystals N during crystal- lization (run 1) vs. time. Copyright © 2013 SciRes. CSTA 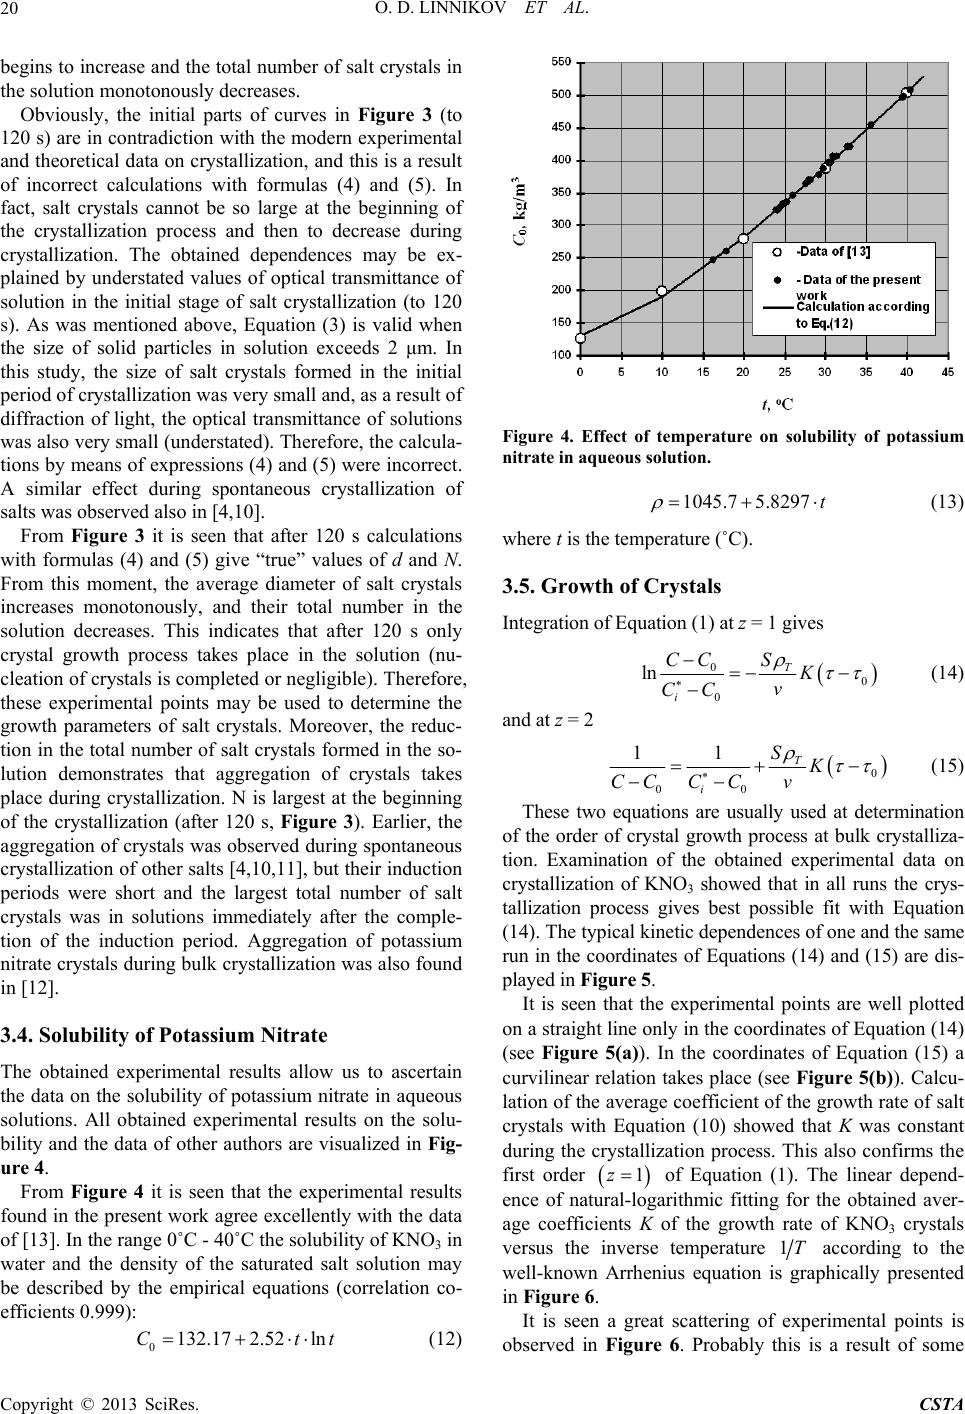 O. D. LINNIKOV ET AL. 20 begins to increase and the total number of salt crystals in es in Figure 3 (to 12 ter 120 s calculations w 3.4. Solubility of Potassium Nitrate us to ascertain 4 it is seen that the experimental results fo tt (12) the solution monotonously decreases. Obviously, the initial parts of curv 0 s) are in contradiction with the modern experimental and theoretical data on crystallization, and this is a result of incorrect calculations with formulas (4) and (5). In fact, salt crystals cannot be so large at the beginning of the crystallization process and then to decrease during crystallization. The obtained dependences may be ex- plained by understated values of optical transmittance of solution in the initial stage of salt crystallization (to 120 s). As was mentioned above, Equation (3) is valid when the size of solid particles in solution exceeds 2 μm. In this study, the size of salt crystals formed in the initial period of crystallization was very small and, as a result of diffraction of light, the optical transmittance of solutions was also very small (understated). Therefore, the calcula- tions by means of expressions (4) and (5) were incorrect. A similar effect during spontaneous crystallization of salts was observed also in [4,10]. From Figure 3 it is seen that af ith formulas (4) and (5) give “true” values of d and N. From this moment, the average diameter of salt crystals increases monotonously, and their total number in the solution decreases. This indicates that after 120 s only crystal growth process takes place in the solution (nu- cleation of crystals is completed or negligible). Therefore, these experimental points may be used to determine the growth parameters of salt crystals. Moreover, the reduc- tion in the total number of salt crystals formed in the so- lution demonstrates that aggregation of crystals takes place during crystallization. N is largest at the beginning of the crystallization (after 120 s, Figure 3). Earlier, the aggregation of crystals was observed during spontaneous crystallization of other salts [4,10,11], but their induction periods were short and the largest total number of salt crystals was in solutions immediately after the comple- tion of the induction period. Aggregation of potassium nitrate crystals during bulk crystallization was also found in [12]. The obtained experimental results allow the data on the solubility of potassium nitrate in aqueous solutions. All obtained experimental results on the solu- bility and the data of other authors are visualized in Fig- ure 4. From Figure und in the present work agree excellently with the data of [13]. In the range 0˚C - 40˚C the solubility of KNO3 in water and the density of the saturated salt solution may be described by the empirical equations (correlation co- efficients 0.999): C 0132.17 2.52ln Figure 4. Effect of temperature on solubility of potassium nitrate in aqueous solution. 1045.75.8297 t (13) where t is the temperature (˚C). z = 1 gives 3.5. Growth of Crystals Integration of Equation (1) at 0 ln T CC SK 0 0 iv CC (14) and at z = 2 0 00 11T i SK СС v CC (15) These two equations are usually used at dete of th rmination e order of crystal growth process at bulk crystalliza- tion. Examination of the obtained experimental data on crystallization of KNO3 showed that in all runs the crys- tallization process gives best possible fit with Equation (14). The typical kinetic dependences of one and the same run in the coordinates of Equations (14) and (15) are dis- played in Figure 5. It is seen that the experimental points are well plotted on a straight line only in the coordinates of Equation (14) (see Figure 5(a)). In the coordinates of Equation (15) a curvilinear relation takes place (see Figure 5(b)). Calcu- lation of the average coefficient of the growth rate of salt crystals with Equation (10) showed that K was constant during the crystallization process. This also confirms the first order 1z of Equation (1). The linear depend- ence of natural-logarithmic fitting for the obtained aver- age coefficients K of the growth rate of KNO3 crystals versus the inverse temperature 1T according to the well-known Arrhenius equation is graphically presented in Figure 6. It is seen a great scattering of experimental points is observed in Figure 6. Probably this is a result of some Copyright © 2013 SciRes. CSTA 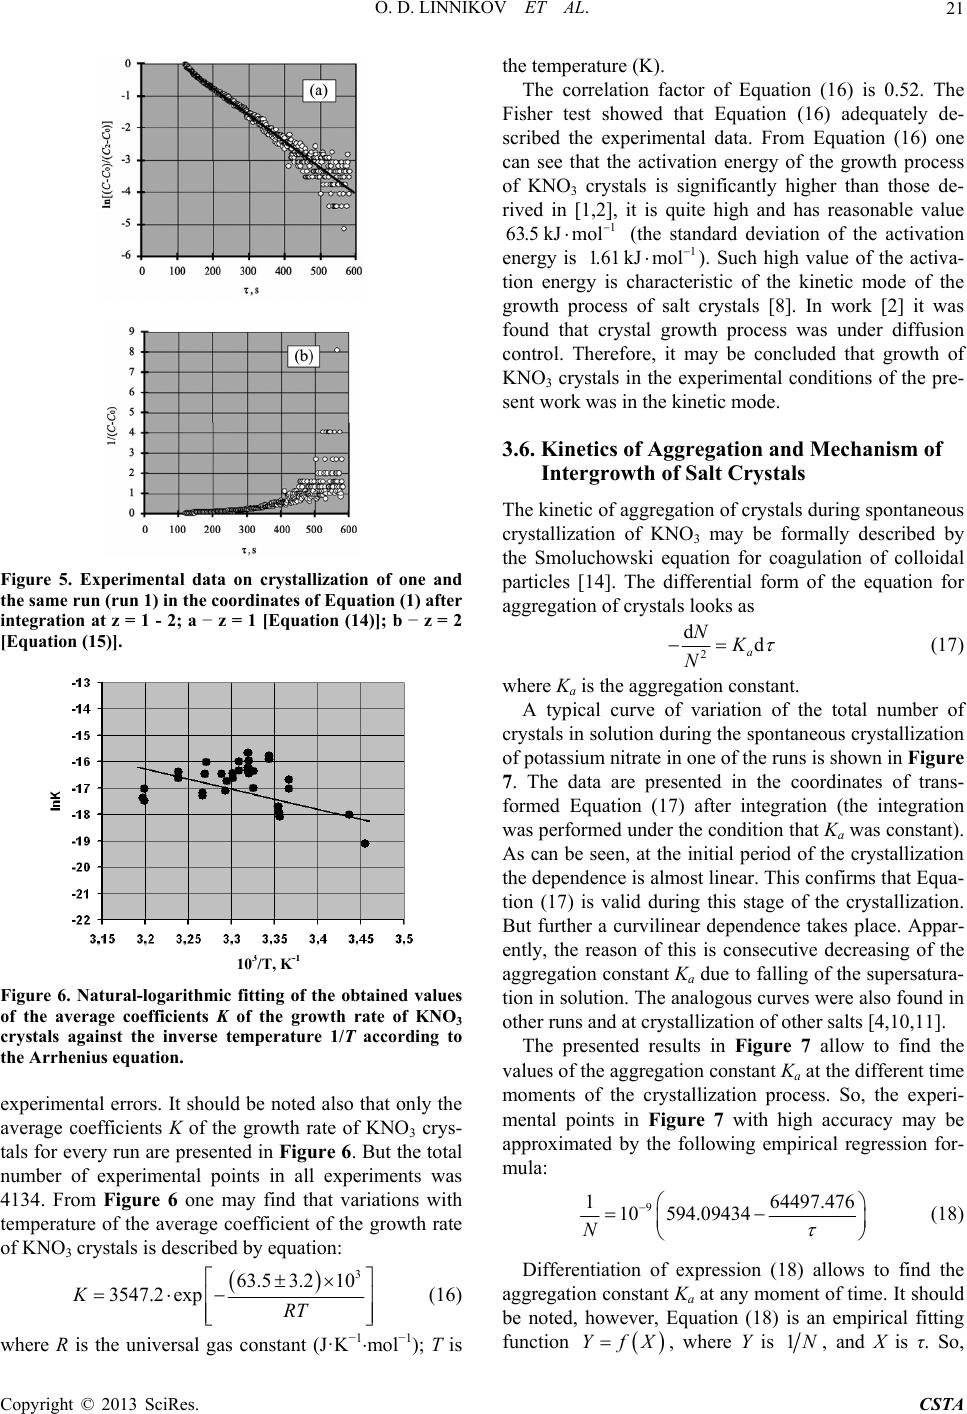 O. D. LINNIKOV ET AL. 21 Figure 5. Experimental data on crystallization of one and the same run (run 1) in the coordinates of Equation (1) after integration at z = 1 - 2; a − z = 1 [Equation (14)]; b − z = 2 [Equation (15)]. 10 /T, K- Figure 6. Natural-logarithmic fitting of the obtained values of the average coefficients K of the growth rate ofNO3 ld be noted also that only the verage coefficients K of the growth rate of KNO3 crys- K crystals against the inverse temperature 1/T according to the Arrhenius equation. experimental errors. It shou a tals for every run are presented in Figure 6. But the total number of experimental points in all experiments was 4134. From Figure 6 one may find that variations with temperature of the average coefficient of the growth rate of KNO3 crystals is described by equation: 3 63.5 3.210 3547.2 expKRT (16) where R is the universal gas constant (J·K−1mol−1); Т is the temperature (K). The correlation factor of Equation (16) is Fisher test showed that Equation (16) adequately de- tion energy of the growth process of 0.52. The scribed the experimental data. From Equation (16) one can see that the activa KNO3 crystals is significantly higher than those de- rived in [1,2], it is quite high and has reasonable value 1 63.5 kJmol (the standard deviation of the activation energy is 1 1.61 kJmol ). Such high value of the activa- tion energy is characteristic of the kinetic mode of the growth process of salt crystals [8]. In work [2] it was ystal growth process was under diffusion control. Thay be concluded that growth of KNO3 crystals in the experimental conditions of the pre- sent work was in the kinetic mode. 3.6. Kinetics of Aggregation and Mechanism of Intergrowth of Salt Crystals The kinetic of aggregation of crystals found that cr erefore, it m during spontaneous partif the equation for crystallization of KNO3 may be formally described by the Smoluchowski equation for coagulation of colloidal cles [14]. The differential form o aggregation of crystals looks as 2 dd a NK N (17) where Ka is the aggregation constant. A typical curve of variation of the total number of crystals in solution during the spo of potassium nitrate in one of the runs is shown in Figure rdinates of trans- fo ap ntaneous crystallization 7. The data are presented in the coo rmed Equation (17) after integration (the integration was performed under the condition that Ka was constant). As can be seen, at the initial period of the crystallization the dependence is almost linear. This confirms that Equa- tion (17) is valid during this stage of the crystallization. But further a curvilinear dependence takes place. Appar- ently, the reason of this is consecutive decreasing of the aggregation constant Ka due to falling of the supersatura- tion in solution. The analogous curves were also found in other runs and at crystallization of other salts [4,10,11]. The presented results in Figure 7 allow to find the values of the aggregation constant Ka at the different time moments of the crystallization process. So, the experi- mental points in Figure 7 with high accuracy may be proximated by the following empirical regression for- mula: 9 1 64497.476 10 594.09434 N (18) Differentiation of expression (18) allows to find the aggregation constant Ka at any moment of time. I be noted, however, Equation (18) is an emp function t should irical fitting YfX, where Y is 1N, and X is τ. So, Copyright © 2013 SciRes. CSTA 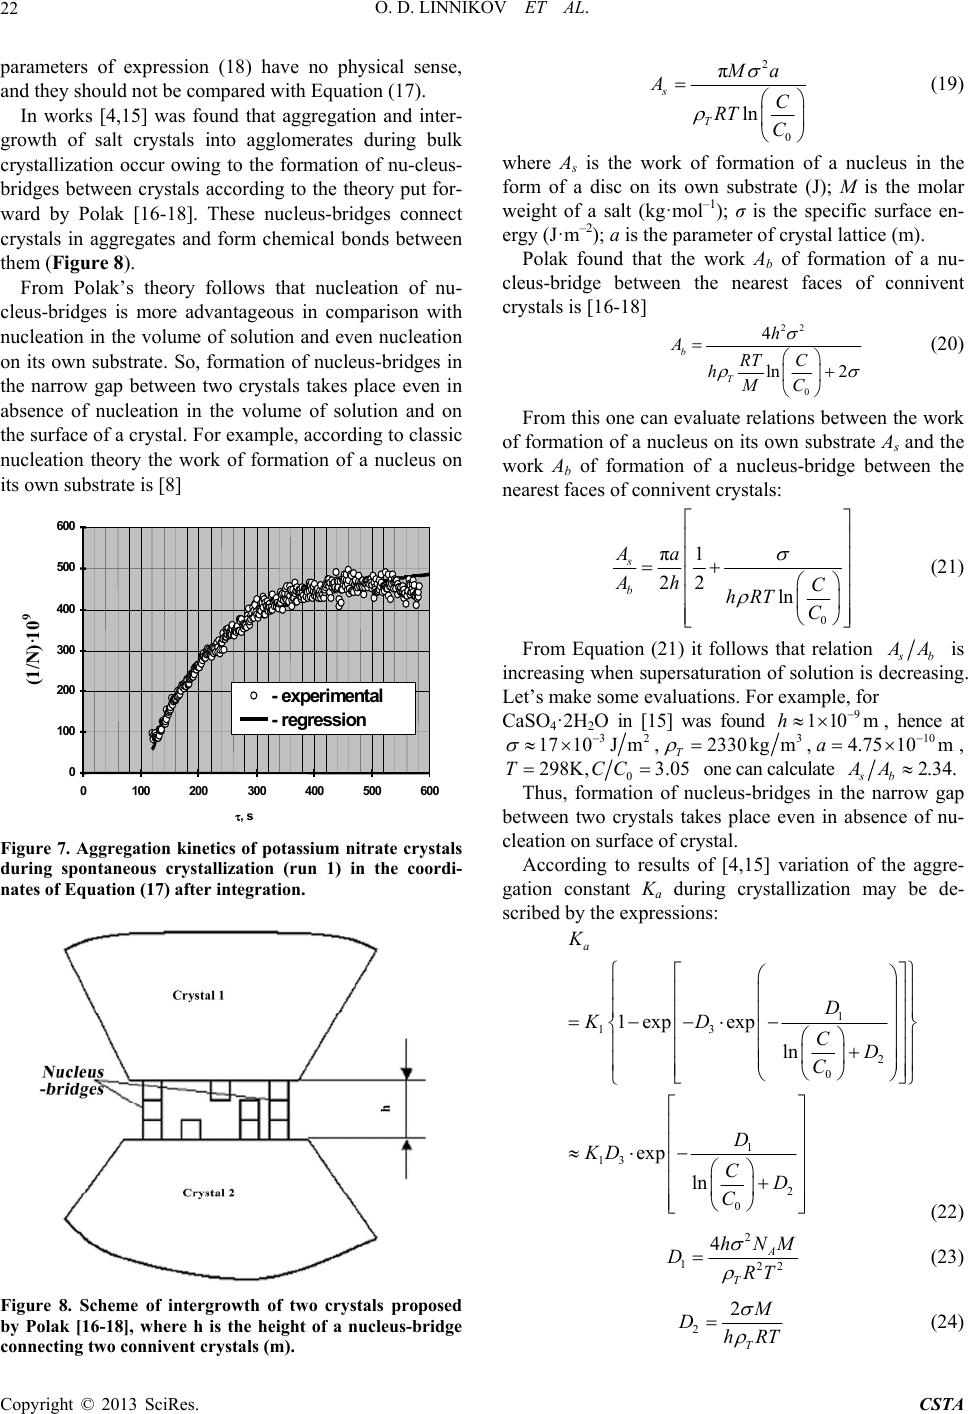 O. D. LINNIKOV ET AL. 22 pa me r- w e. So, formation of nucleus-bridges in th rameters of expression (18) have no physical sense, and they should not be compared with Equation (17). In works [4,15] was found that aggregation and inter- growth of salt crystals into agglorates during bulk crystallization occur owing to the formation of nu-cleus- bridges between crystals according to the theory put fo ard by Polak [16-18]. These nucleus-bridges connect crystals in aggregates and form chemical bonds between them (Figure 8). From Polak’s theory follows that nucleation of nu- cleus-bridges is more advantageous in comparison with nucleation in the volume of solution and even nucleation on its own substrat e narrow gap between two crystals takes place even in absence of nucleation in the volume of solution and on the surface of a crystal. For example, according to classic nucleation theory the work of formation of a nucleus on its own substrate is [8] 0 100 200 300 400 500 600 0 100 200 300 400 500 600 , s - experimen tal - regression (1/N)·10 Figure 7. Aggregation kinetics of potassium nitrate crystals during spontaneous crystallization (run 1) in the coordi- nates of Equation (17) after integration. 9 2 0 π ln s T Ma AC RT C (19) where As is the work of formation of a nucleus in the form of a disc on its own substrate (J); М is the molar weight of a salt (kg·mol ‒1); σ is the specific surface en- ergy (J·m‒2); a is the parameter of crystal lattice (m). Polak found that the work Ab of formation of a nu- cleus-bridge between the nearest faces of connivent crystals is [16-18] 22 0 4 ln 2 b T h ART C hMC (20) From this one can evaluate relations between the work of formation of a nucleus on its own substrate As and the work Ab of formation of a nucleus-bridge between the nearest faces of connivent crystals: Figure 8. Scheme of intergrowth of two crystals proposed by Polak [16-18], where h is the height of a nucleus-bridge connecting two connivent crystals (m). 0 22 ln b Ah C hR TC π1 s Aa From Equation (21) it follows that relation (21) b A is increasing when supersaturation of solution is decreasing. Let’s make some evaluations. For example, for CaSO4·2H2O in [15] was found 9 110mh , hence at 32 1710Jm, 3 10 2330 kgm,4.7510ma , T 0 298K, 3.05TCC one can calculate 2.34. sb AA narrow gap Thus, formation of nucleus-bridges in the between two crystals takes place even in absence of nu- cleation on surface of crystal. According to results of [4,15] variation of the aggre- gation constant Ka during crystallization may be de- scribed by the expressions: 1 13 2 0 C 1 13 2 0 exp ln D KD D C K 1exp exp ln a D KD CD C (22) 2 122 4A T hNM DR (23) T 2 2 T DhRT (24) Copyright © 2013 SciRes. CSTA 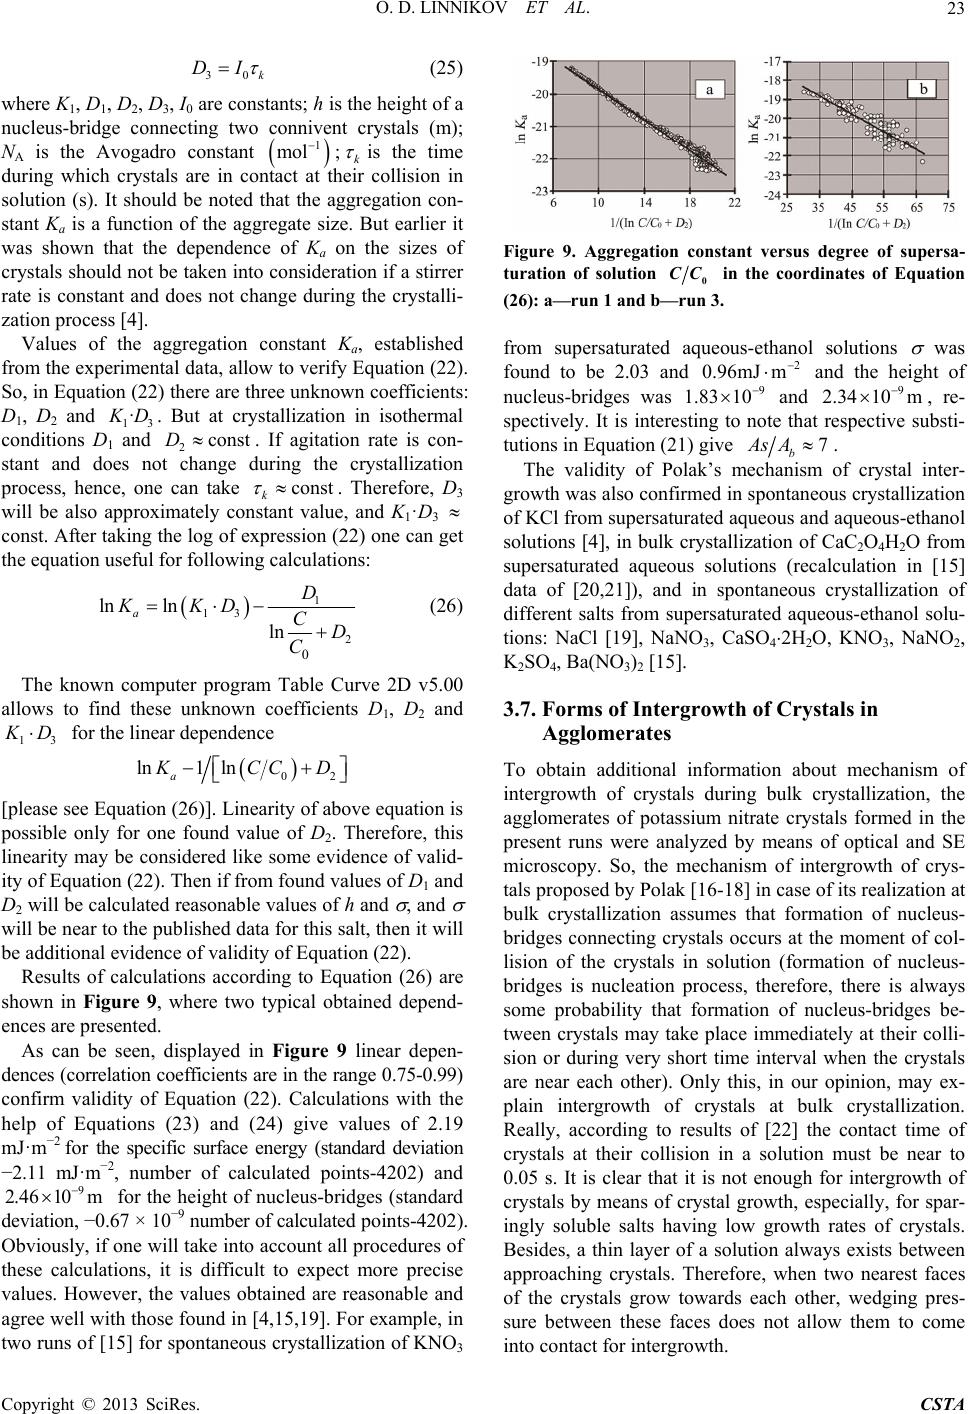 O. D. LINNIKOV ET AL. 23 30k DI (25) where K1, D1, D2, D3, I0 are constants; h is the height of a nucleus-bridge connecting two connivent crystals (m); NA is the Avogadro constant 1 mol;k is the time during which crystals are in conllision in solution (s). It should be noted that the aggregation con- stant Ka is a function of the aggregate size. But earlier it was shown that the dependence of Ka on the sizes of crystals should not be taken into consideration if a stirrer rate is constant and does not change during the crystalli- zation process [4]. Values of the aggregation constant Ka, estab from the experimental data, allow to So, in Equation (22) there are three u D1, D2 and tact at their co lished verify Equation (22). nknown coefficients: 13 · D D1 and es no nce, on . But at crystallization in isothermal conditions If stant and douri process, he 2con s tD. t change d e can take agitation rate is con- ng the crystallization const k . Therefore, D3 tant value, and K1·D3 will be also approximately cons const. After taking the log of expression (22) one can get the equation useful for following calculations: 1 13 2 0 ln ln ln a D KKDCD C (26) The known computer program Table Curve 2D v5.00 allows to find these unknown coefficients D1, D2 and 13 D for the linear dependence 02 ln1 ln a CC D [please see Equation (26)]. Linearity of above equation is possible only for one found value of D2. Therefore, this linearity may be considered like some evidence of valid- ity of Equation (22). Then if from found values of D1 and D2 will be calculated reasonable values of h and , and will be near to the published data for this salt, then it will be additional evidence of validity of Equation (22). Results of calculations according to Equation (26) are shown in Figure 9, where two typical obtained depend- ences are presented. As can be seen, displayed in Figure 9 l dences (correlation coefficients are in the range 0.75-0.99) confirm validity of Equation (22). Calculations with the he −2.11 ints-4202) and for the height of nucleus-bris (standard 0.67 × 10⁻⁹ number of calculated points-4202). inear depen- lp of Equations (23) and (24) give values of 2.19 mJ·m−2 for the specific surface energy (standard deviation mJ·m−2, number of calculated po 9 2.46 10m deviation, − dge Obviously, if one will take into account all procedures of these calculations, it is difficult to expect more precise values. However, the values obtained are reasonable and agree well with those found in [4,15,19]. For example, in two runs of [15] for spontaneous crystallization of KNO3 Figure 9. Aggregation constant versus degree of supersa- turation of solution 0 CC in the coordinates of Equation (26): a—run 1 and b—run 3. from supersaturated aqueous-ethanol solutions was found to be 2.03 and 2 0.96mJ m and the height of nucleus-bridges was 9 1.83 10 and 9 2.34 10m , re- spectively. It is interesting to note that respective substi- tutions in Equation (21) give 7 b As A. The validity of Polak’s mechanism of crystal inter- growth was also confirmed in spontaneous crystallization of KCl from supersaturated aqueous and aqueous-ethanol solutions [4], in bulk crystallization of CaC2O4ּH2O from supersaturated aqueous solutions (recalculation in [15] data of [20,21]), and in spontaneous crystallization of different salts from supersaturated aqueous-ethanol solu- tions: NaCl [19], NaNO3, CaSO42H2O, KNO3, NaNO2, K2SO4, Ba(NO3)2 [15]. m nitrat rystals at bulk crystallization. e of near to 0.05 is not enough for intergrowth of into contact for intergrowth. 3.7. Forms of Intergrowth of Crystals in Agglomerates To obtain additional information about mechanism of intergrowth of crystals during bulk crystallization, the agglomerates of potassiue crystals formed in the present runs were analyzed by means of optical and SE microscopy. So, the mechanism of intergrowth of crys- tals proposed by Polak [16-18 its realizatio ] in case ofn at bulk crystallization assumes that formation of nucleus- bridges connecting crystals occurs at the moment of col- lision of the crystals in solution (formation of nucleus- bridges is nucleation process, therefore, there is always some probability that formation of nucleus-bridges be- tween crystals may take place immediately at their colli- sion or during very short time interval when the crystals are near each other). Only this, in our opinion, may ex- plain intergrowth of c Really, according to results of [22] the contact tim crystals at their collision in a solution must be s. It is clear that it crystals by means of crystal growth, especially, for spar- ingly soluble salts having low growth rates of crystals. Besides, a thin layer of a solution always exists between approaching crystals. Therefore, when two nearest faces of the crystals grow towards each other, wedging pres- sure between these faces does not allow them to come Copyright © 2013 SciRes. CSTA 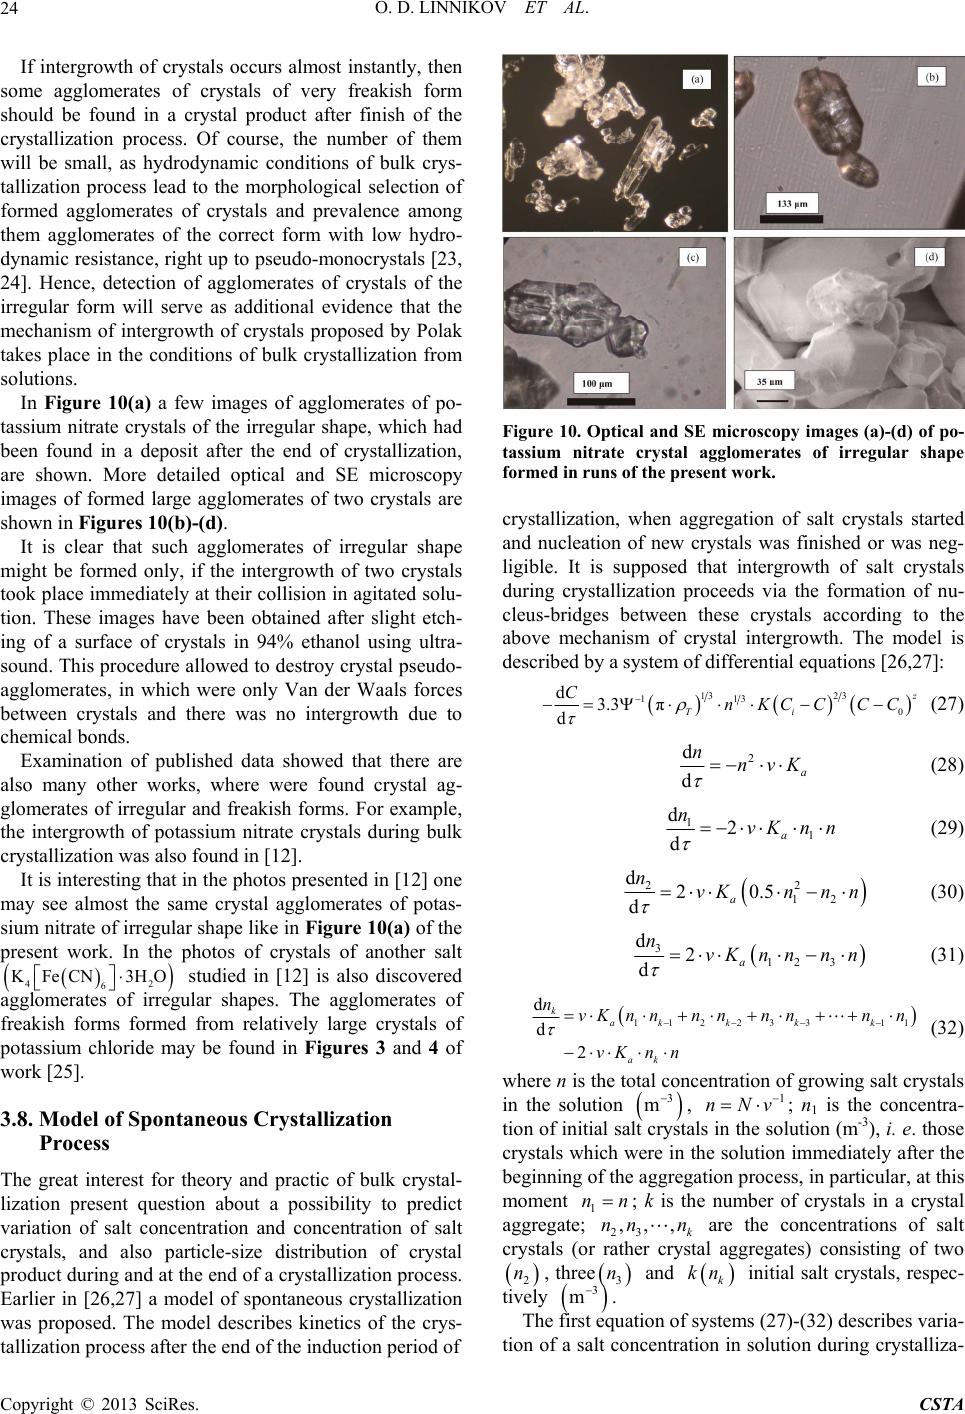 O. D. LINNIKOV ET AL. 24 If intergrowth of crystals occurs almost instantly, then some agglomerates of crystals of very freakish form should be found in a crystal product after finish of the crystallization process. Of course, the number of them will be small, as hydrodynamic conditions of bulk crys- tallization process lead to the morphological selection of formed agglomerates of crystals and prevalence among them agglomerates of the correct form with low hydro- dynamic resistance, right up to pseudo-monocrystals [23, 24]. Hence, detection of agglomerates of crystals of the irregular form will serve as additional evidence that the mechanism of intergrowth of crystals proposed by Polak takes place in the conditions of bulk crystallization from solutions. In Figure 10(a) a few images of agglomerates of po- tassium nitrate crystals of the irregular shape, which had been found in a deposit after the end of crystallization, are shown. More detailed optical and SE microscopy images of formed large agglomerates of two crystals are sh wth of potassium nitrate crystals during bulk cr own in Figures 10(b)-(d). It is clear that such agglomerates of irregular shape might be formed only, if the intergrowth of two crystals took place immediately at their collision in agitated solu- tion. These images have been obtained after slight etch- ing of a surface of crystals in 94% ethanol using ultra- sound. This procedure allowed to destroy crystal pseudo- agglomerates, in which were only Van der Waals forces between crystals and there was no intergrowth due to chemical bonds. Examination of published data showed that there are also many other works, where were found crystal ag- glomerates of irregular and freakish forms. For example, the intergro ystallization was also found in [12]. It is interesting that in the photos presented in [12] one may see almost the same crystal agglomerates of potas- sium nitrate of irregular shape like in Figure 10(a) of the present work. In the photos of crystals of another salt 42 6 KFeCN 3HO studied in [12] is also discovered netics of the crys- tallization process after the end of the induction period of agglomerates of irregular shapes. The agglomerates of freakish forms formed from relatively large crystals of potassium chloride may be found in Figures 3 and 4 of work [25]. 3.8. Model of Spontaneous Crystallization Process The great interest for theory and practic of bulk crystal- lization present question about a possibility to predict variation of salt concentration and concentration of salt crystals, and also particle-size distribution of crystal product during and at the end of a crystallization process. Earlier in [26,27] a model of spontaneous crystallization was proposed. The model describes ki Figure 10. Optical and SE microscopy images (a)-(d) of po- tassium nitrate crystal agglomerates of irregular shape formed in runs of the present work. crystallization, when aggregation of salt crystals started and nucleation of new crystals was finished or was neg- ligible. It is supposed that intergrowth of salt crystals during crystallization proceeds via the formation of nu- cleus-bridges between these crystals according to the above mechanism of crystal intergrowth. The model is described by a system of differential equations [26,27]: 13 23 113 0 d3.3 π d Ti CnKCC CC (27) 2 d da nnvK (28) 1 1 d2 da nvKn n (29) 2 2 12 d20.5 da nvKnn n (30) 3 1 d2 da nvKn nnn 23 (31) 112 23 311 d d 2 k ak kkk ak nvKnnnnnnnn vKn n (32) where n is the total concentration of growing salt crystals in the solution 3 m, 1 nNv ; n1 is the concentra- tion of initial salt crystals in the solution (m-3), i. e. those crystals which were in the solution immediately after the beginning of th, in particular, at moment e aggregation process this 1 nn ; k is th 23 ,,, k n her crystal agg e numb are the c regate er of crystals in a c aggreg oncentrations of salt crystals (os rystal ate; nn r rat) consisting of two , three and 3 n k kn in 2 nitial salt crystals, respec- tively 3 m. rst equatThe fiion of systems (27)-(32) tion of a salt concentration in solution during crystalliza- describes varia- Copyright © 2013 SciRes. CSTA 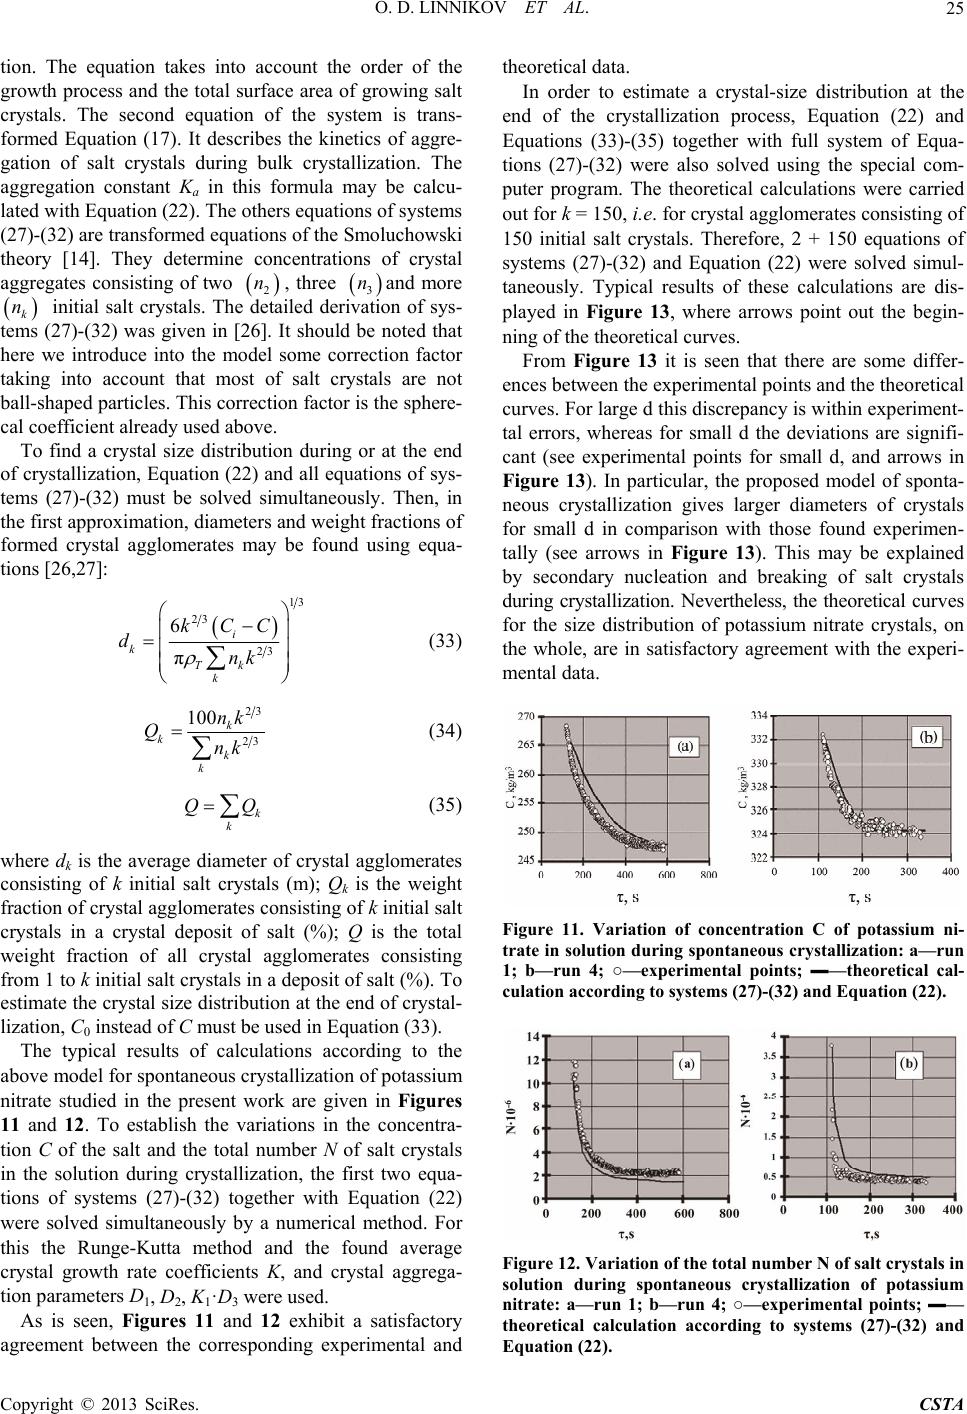 O. D. LINNIKOV ET AL. 25 tion. The equation takes into account the o growth process and the total surface area of crystals. The second equation of the system is trans- formed Equation (17). It describes the kineti gation of salt crystals during bulk crystallization. The aggregation constant Ka in this formula may be calcu- lated with Equation (22). The others equations of sy (27)-(32) are transformed equations of the Smoluchow g rder of the growing salt cs of aggre- stems ski theory [14]. They determine concentrations of crystal aggregates consistinof two , three 3 nand more k n initial salt crystals. The detailed derivation of sys- tems (27)-(32) was given in [26]. It should be noted that here we introduce into the model some correction factor taking into account that most of salt crystals are not ball-shapedis correction factor is the sphere- cal coefficient already used above. find a crystal size distribution during or at the end of crystllization, Equa22) and all equations of sys- tem 2 n particles. Th To ation ( s (27)-(32) must be solved simultaneously. Then, in the first approximation, diameters and weight fractions of formed crystal agglomerates may be found using equa- tions [26,27]: 13 23 23 6 π i k Tk k kCC dnk (33) 23 23 100 k k k k nk Qnk (34) k k QQ (35) where dk is the average diameter of crystal agglomerates consisting of k initial salt crystals (m); Qk is the weight fraction of crystal agglomerates consisting of k initial salt crystals in a crystal deposit of salt (%); Q is the total weight fraction of all crystal agglomerates consisting from 1 to k initial salt crystals in a deposit of salt (%). To estimate the crystal size distribution at the end of crystal- lization, C0 instead of C must be used in Equation (33). The typical results of calculations according to the above model fo r spontaneous crystallization of potassium nitrate studied in the present work are given in Figures 11 and 12. To establish the variation tion C of the salt and the total number in the solution during crystallization, the first two equa- tions of systems (27)-(32) together with Equation (22) were solved simultaneously by a this the Runge-Kutta method and the found average crystal growth rate coefficients K, and crystal aggrega- tion parameters D1, D2, K1·D3 we As is seen, Figures 11 and 12 exhibit a satisfactory agreement between the corresponding experimental and sy ers of crystals fo cleation and breaking of salt crystals du s in the concentra- N of salt crystals numerical method. For re used. theoretical data. In order to estimate a crystal-size distribution at the end of the crystallization process, Equation (22) and Equations (33)-(35) together with full system of Equa- tions (27)-(32) were also solved using the special com- puter program. The theoretical calculations were carried out for k = 150, i.e. for crystal agglomerates consisting of 150 initial salt crystals. Therefore, 2 + 150 equations of stems (27)-(32) and Equation (22) were solved simul- taneously. Typical results of these calculations are dis- played in Figure 13, where arrows point out the begin- ning of the theoretical curves. From Figure 13 it is seen that there are some differ- ences between the experimental points and the theoretical curves. For large d this discrepancy is within experiment- tal errors, whereas for small d the deviations are signifi- cant (see experimental points for small d, and arrows in Figure 13). In particular, the proposed model of sponta- neous crystallization gives larger diamet r small d in comparison with those found experimen- tally (see arrows in Figure 13). This may be explained by secondary nu ring crystallization. Nevertheless, the theoretical curves for the size distribution of potassium nitrate crystals, on the whole, are in satisfactory agreement with the experi- mental data. Figure 11. Variation of concentration C of potassium ni- trate in solution during spontaneous crystallization: a—run 1; b—run 4; ○—experimental points; ▬—theoretical cal- culation according to systems (27)-(32) and Equation (22). Figure 12. Variation of the total number N of salt crystals in solution during spontaneous crystallization of potassium nitrate: a—run 1; b—run 4; ○—experimental points; ▬— theoretical calculation according to systems (27)-(32) and Equation (22). Copyright © 2013 SciRes. CSTA 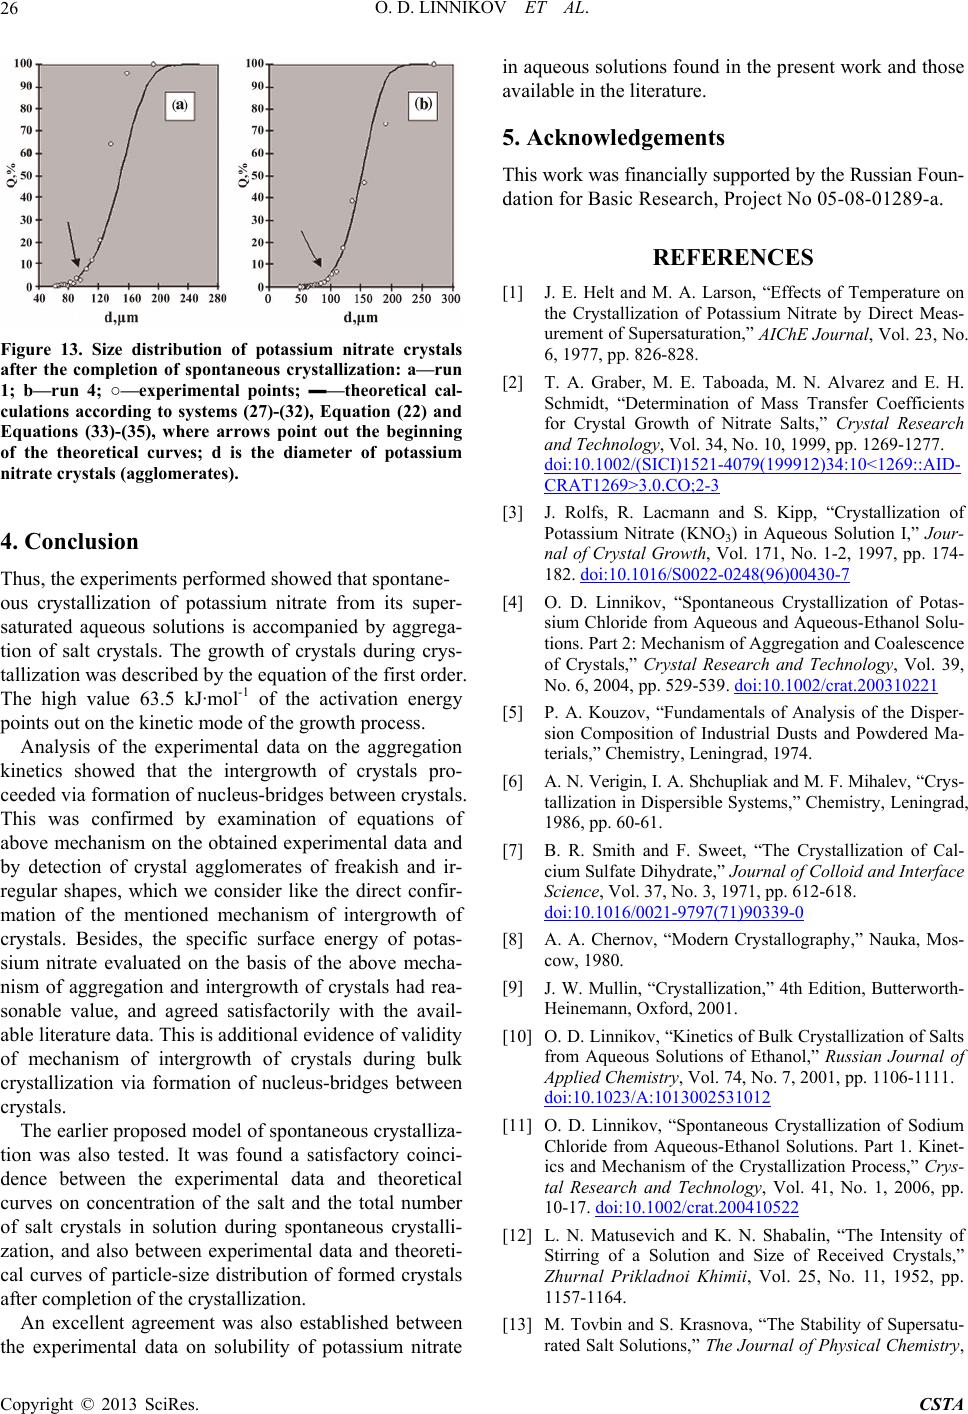 O. D. LINNIKOV ET AL. 26 Figure 13. Size distribution of potassium nitrate crystals after the completion of spontaneous crystallization: a—run 1; b—run 4; ○—experimental points; ▬—theoretical cal- culations according to systems (27)-(32), Equation (22) and Equations (33)-(35), where arrows point out the beginning of the theoretical curves; d is the diameter of potassium nitrate crystals (agglomerates). 4. Conclusion Thus, the experiments performed showed that spontane- e 63.5 kJ·mol-1 of the activation energy points out on the kinetic mode of the growth process. Analysis of the experimental data on the aggregation kinetics showed that the intergrowth of crystals pro- ceeded via formation of nucleus-bridges between crystals. This was confirmed by examination of equations of above mechanism on the obtained experimental data and by detection of crystal agglomerates of freakish and ir- regular shapes, which we consider like the direct confir- mation of the mentioned mechanism of intergrowth of crystals. Besides, the specific surface energy of potas- sium nitrate evaluated on the basis of the above mecha of spontaneous crystalliza- tion was also tested. It wasctory coinci- e experimental data and theoret of the salt and the total number the experimental data on solubility of potassium nitrate ous crystallization of potassium nitrate from its super- saturated aqueous solutions is accompanied by aggrega- tion of salt crystals. The growth of crystals during crys- tallization was described by the equation of the first order. The high valu - nism of aggregation and intergrowth of crystals had rea- sonable value, and agreed satisfactorily with the avail- able literature data. This is additional evidence of validity of mechanism of intergrowth of crystals during bulk crystallization via formation of nucleus-bridges between crystals. The earlier proposed model found a satisfa dence between th curves on concentration ical of salt crystals in solution during spontaneous crystalli- zation, and also between experimental data and theoreti- cal curves of particle-size distribution of formed crystals after completion of the crystallization. An excellent agreement was also established between in aqueous solutions found in the present work and those available in the literature. 5. Acknowledgements This work was financially supported by the Russian Foun- dation for Basic Research, Project No 05-08-01289-a. REFERENCES [1] J. E. Helt and M. A. Larson, “Effects of Temperature on the Crystallization of Potassium Nitrate by Direct Meas- urement of Supersaturation,” AIChE Journal, Vol. 23, No. 6, 1977, pp. 826-828. [2] T. A. Graber, M. E. Taboada, M. N. Alvarez and E. H. Schmidt, “Determination of Mass Transfer Coefficients for Crystal Growth of Nitrate Salts,” Crystal Research and Technology, Vol. 34, No. 10, 1999, pp. 1269-1277. doi:10.1002/(SICI)1521-4079(199912)34:10<1269::AID- CRAT1269>3.0.CO;2-3 [3] J. Rolfs, R. Lacmann and S. Kipp, “Crystallization of Potassium Nitrate (KNO3) in Aqueous Solution I,” Jour- nal of Crystal Growth, Vol. 171, No. 1-2, 1997, pp. 174- 182. doi:10.1016/S0022-0248(96)00430-7 [4] O. D. Linnikov, “Spontaneous Crystallization of Potas- sium Chloride from Aqueous and Aqueous-Ethanol Solu- tions. Part 2: Mechanism of Aggregation and Coalescence of Crystals,” Crystal Research and Technology, Vol. 39, No. 6, 2004, pp. 529-539. doi:10.1002/crat.200310221 [5] P. A. Kouzov, “Fundamentals of Analysis of the Disper- sion Composition of Industrial Dusts and Powdered Ma- terials,” Chemistry, Leningrad, 1974. [6] A. N. Verigin, I. A. Shchupliak and M. F. Mihalev, “Crys- ems,” Chemistry, Leningrad, e Science, Vol. 37, No. 3, 1971, pp. 612-618. doi:10.1016/002 tallization in Dispersible Syst 1986, pp. 60-61. [7] B. R. Smith and F. Sweet, “The Crystallization of Cal- cium Sulfate Dihydrate,” Journal of Colloid and Interfac 1-9797(71)90339-0 , “Modern Crystallogra[8] A. A. Chernovphy,” Nauka, Mos- cs of Bulk Crystallization of Salts cow, 1980. [9] J. W. Mullin, “Crystallization,” 4th Edition, Butterworth- Heinemann, Oxford, 2001. [10] O. D. Linnikov, “Kineti from Aqueous Solutions of Ethanol,” Russian Journal of Applied Chemistry, Vol. 74, No. 7, 2001, pp. 1106-1111. doi:10.1023/A:1013002531012 [11] O. D. Linnikov, “Spontaneous Crystallization of Sodium Chloride from Aqueous-Ethanol Solutions. Part 1. Kinet- ics and Mechanism of the Crystallization Process,” Crys- tal Research and Technology, Vol. 41, No. 1, 2006, pp. 10-17. doi:10.1002/crat.200410522 [12] L. N. Matusevich and K. N. Shabalin, “The Intensity of Stirring of a Solution and Size of Received Crystals,” Zhurnal Prikladnoi Khimii, Vol. 25, No. 11, 1952, pp. 1157-1164. [13] M. Tovbin and S. Krasnova, “The Stability of Supersatu- rated Salt Solutions,” The Journal of Physical Chemistry, Copyright © 2013 SciRes. CSTA 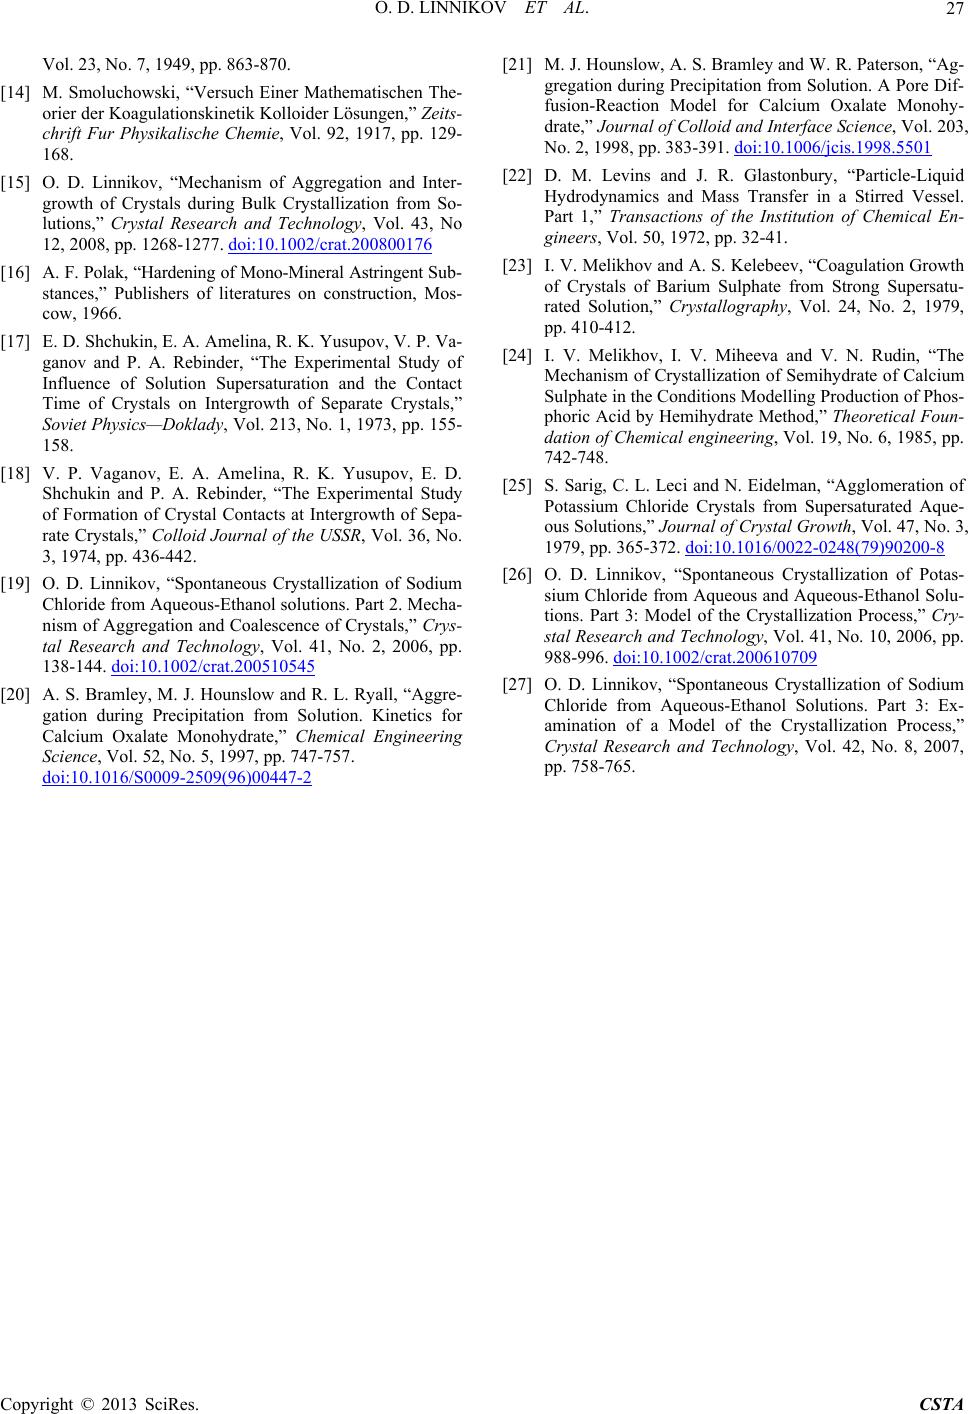 O. D. LINNIKOV ET AL. Copyright © 2013 SciRes. CSTA 27 2, 1917, pp. 129- during Bulk Crystallization from So- Vol. 23, No. 7, 1949, pp. 863-870. [14] M. Smoluchowski, “Versuch Einer Mathematischen The- orier der Koagulationskinetik Kolloider Lösungen,” Zeits- chrift Fur Physikalische Chemie, Vol. 9 168. [15] O. D. Linnikov, “Mechanism of Aggregation and Inter- growth of Crystals lutions,” Crystal Research and Technology, Vol. 43, No 12, 2008, pp. 1268-1277. doi:10.1002/crat.200800176 [16] A. F. Polak, “Hardening of Mono-Mineral Ast stances,” Publishers of literatures on ringent S construction, Mos- in, E. A. Amelina, R. K. Yusupov, V. P. Va- ub- cow, 1966. [17] E. D. Shchuk ganov and P. A. Rebinder, “The Experimental Study of Influence of Solution Supersaturation and the Contact Time of Crystals on Intergrowth of Separate Crystals,” Soviet Physics—Doklady, Vol. 213, No. 1, 1973, pp. 155- 158. [18] V. P. Vaganov, E. A. Amelina, R. K. Yusupov, E. D . Shchukin and P. A. Rebinder, “The Experimental Study of Formation of Crystal Contacts at Intergrowth of Sepa- rate Crystals,” Colloid Journal of the USSR, Vol. 36, No. 3, 1974, pp. 436-442. [19] O. D. Linnikov, “Spontaneous Crystallization of Sodium Chloride from Aqueous-Ethanol solutions. Part 2. Mecha- nism of Aggregation and Coalescence of Crystals,” Crys- tal Research and Technology, Vol. 41, No. 2, 2006, pp. 138-144. doi:10.1002/crat.200510545 [20] A. S. Bramley, M. J. Hounslow and R. L. Ryall, “Aggre- gation during Precipitation from Solution. Kinetics for Calcium Oxalate Monohydrate,” Chemical Engineering Science, Vol. 52, No. 5, 1997, pp. 747-757. doi:10.1016/S0009-2509(96)00447-2 [21] M. J. Hounslow, A. S. Bramley and W. R. Paterson, “Ag- gregation during Precipitation from Solution. A Pore Dif- fusion-Reaction Model for Calcium Oxalate Monohy- drate,” Journal of Colloid and Interface Science, Vol. 203, No. 2, 1998, pp. 383-391. doi:10.1006/jcis.1998.5501 gulation Growth udin, “The hydrate of Calcium of [22] D. M. Levins and J. R. Glastonbury, “Particle-Liquid Hydrodynamics and Mass Transfer in a Stirred Vessel. Part 1,” Transactions of the Institution of Chemical En- gineers, Vol. 50, 1972, pp. 32-41. [23] I. V. Melikhov and A. S. Kelebeev, “Coa of Crystals of Barium Sulphate from Strong Supersatu- rated Solution,” Crystallography, Vol. 24, No. 2, 1979, pp. 410-412. [24] I. V. Melikhov, I. V. Miheeva and V. N. R Mechanism of Crystallization of Semi Sulphate in the Conditions Modelling Production of Phos- phoric Acid by Hemihydrate Method,” Theoretical Foun- dation of Chemical engineering, Vol. 19, No. 6, 1985, pp. 742-748. [25] S. Sarig, C. L. Leci and N. Eidelman, “Agglomeration Potassium Chloride Crystals from Supersaturated Aque- ous Solutions,” Journal of Crystal Growth, Vol. 47, No. 3, 1979, pp. 365-372. doi:10.1016/0022-0248(79)90200-8 [26] O. D. Linnikov, “Spontaneous Crystallization of Potas- .1002/crat.200610709 sium Chloride from Aqueous and Aqueous-Ethanol Solu- tions. Part 3: Model of the Crystallization Process,” Cry- stal Research and Technology, Vol. 41, No. 10, 2006, pp. 988-996. doi:10 [27] O. D. Linnikov, “Spontaneous Crystallization of Sodium Chloride from Aqueous-Ethanol Solutions. Part 3: Ex- amination of a Model of the Crystallization Process,” Crystal Research and Technology, Vol. 42, No. 8, 2007, pp. 758-765.
|