 Vol.2, No.10, 1066-1072 (2010) Natural Science http://dx.doi.org/10.4236/ns.2010.210132 Copyright © 2010 SciRes. OPEN ACCESS Adsorption studies of cyanide onto activated carbon and γ-alumina impregnated with cooper ions Liliana Giraldo1, Juan Carlos Moreno-Piraján2 1Facultad de Ciencias, Departamento de Química, Universidad Nacional de Colombia, Bogotá, Colombia; lgiraldogu@bt.unal.edu.co; 2Facultad de Ciencias, Departamento de Química, Grupo de Investigación en Sólidos Porosos y Calorimetría, Universidad de los Andes, Bogotá, Colombia; jumoreno@uniandes.edu.co. Received 5 May 2010; revised 17 June 2010; accepted 20 June 2010. ABSTRACT In this research, adsorption of cyanide onto cata- lyst synthesized with activated carbon and γ- alumina used supported and cooper has been studied by means of batch technique. Percent- age adsorption was determined for this catalyst in function of pH, adsorbate concentration and temperature. Adsorption data has been interpret- ed in terms of Freundlich and Langmuir equa- tions. Thermodynamics parameters for the ad- sorption system have been determined at three different temperatures. Keywords: Activated carbon; Alumina; Cyanide; Isotherms; Thermodynamic 1. INTRODUCTION Waste water discharged by industrial activities is often contaminated by a variety of toxic or otherwise harmful substances which have negative effects on the water en- vironment. For example, of metal finishing industry and electroplating units is one of the major sources of heavy metals such as (Zn, Cu, Cr, Pb etc.) and cyanide pollu- tants which contribute greatly to the pollution load of the receiving water bodies and therefore increase the envi- ronmental risk [1-4]. Cyanide present in effluent water of several industries. Cyanidation has dominated the gold mining industry. In view of the toxicity of cyanide, and the fact that cyanide is fatal in small dosages, authorities have been forced to tighten up plant discharge regulations. It is therefore vital to recover as much cyanide as possi- ble, not only to meet standard requirements, but to strive towards obtaining lower levels of free cyanide (CN-) in tailing and plant effluent [4-8]. The solubility of gold in cyanide solution was recognized as early as 1783 by Scheel (Sweden) and was studied in the 1840s and 1850s by Elkington and Bagration (Russia), Elsner (German) and Faraday (England) [9]. Elkington also had a patent for the use of potassium cyanide solutions for electro- plating of gold and silver [9]. Cyanide is a singly-charged anion containing unimolar amounts of carbon and nitro- gen atoms triply-bounded together. It is a strong ligand, capable of complexing at low concentrations with virtu- ally any heavy metal. Because the health and survival of plants and animals are dependent on the transport of these heavy metals through their tissues, cyanide is very toxic. Several systems have been adopted for the reduc- tion of cyanide in mill discharges. There are SO2 assisted oxidation, natural degradation, acidification volatiliza- tion-reneutralization, oxidation and biological treatment. However, in the first three processes, cyanide reduction does not appear to meet the strict regulatory requirements, and as for the fourth process, it is limited to certain cli- mate conditions. The next best process used, is the oxi- dation with hydrogen peroxide where the cyanide con- centration is reduced to low enough levels, but this pro- cess requires an expensive reagent which cannot be re- used [10-16]. Activated carbon was used for the removal of free cyanide from solution, but observed that copper- impregnated carbon yielded far better cyanide removal [17]. However, did not test other metal impregnated car- bons or different metal loadings on the carbon. The use of a metal impregnated carbon system would therefore be more effective in reducing cyanide concentrations in solution. Due to the problem mentioned above, the study on using activated carbon in the removal of free cyanide is being done in our laboratory [18,19]. The adsorption onto activated carbon has found increasing application in the treatment of wastewater, as well as for the recovery of metals from cyanide leached pulps. Activated carbon has a great potential for cyanide waste treatment both in gold extraction plants and effluent from metal finishing plants and hence, it forms a subject studied in the present work. Characterization of activated carbon shows that surface area has an effect although the reactivity of the surface as a result of oxygenated functional groups, e.g.  L. Giraldo et al. / Natural Science 2 (2010) 1066-1072 Copyright © 2010 SciRes. OPEN ACCESS 106 1067 carboxylate and phenolate is thought to be significant in the sorption of metal cations. Pore size distribution has been used to describe the internal structures and adsorp- tion capacities of activated carbons [20]. The highly ac- tive surface properties of the activated carbon are attrib- uted to the chemical functional groups and the internal surface areas, which typically range from 500 to 3000 m2/g [21]. The effect of copper was studied in the ad- sorption of cyanide onto activated carbon. It was found that the removal capacity was highly improved by the presence of copper [18-21]. It is the aim of this research to use of activated carbon (obtained from cassava peel) [22,23] and alumina impregnated with cooper for obtain catalyst for the removal of cyanide for dilute solutions. The pertinent parameters that influence adsorption such as initial cyanide (CN-) concentration, agitation time, pH and temperature were investigated. Adsorption isotherms at three different temperatures (i.e. 283 K, 313 K, 323 K) have been studied. The adsorption data have been inter- preted using Freundlich and Langmuir isotherms. Vari- ous thermodynamic parameters including the mean en- ergy of adsorption have been calculated. 2. EXPERIMENTAL All reagents used in the experimental work were of analytical grade (E.MERCK)® Argentmetric (largely AgNO3) titrations were employed for CN- determination [8]. Stock solution of cyanide (1000 mg.L-1) was pre- pared by dissolving Sodium cyanide in distilled water. The concentration range of cyanide prepared from stock solution varied between 10 to 80 mg.L-1. 2.1. Preparation of Catalysts The activated carbon used in this study was prepared for by pyrolysis of cassava peel in presence of chloride zinc (chemical activities) by our research group. Cassava peel from Colombian Cassava cultives were impregnated with aqueous solutions of ZnCl2 following a variant of the incipient wetness method [22,23] with a specific sur- face area of 1567 m2.g-1. One of them was obtained commercial (Sasol™) sam- ple of γ-alúmina. 2.1.1. Impregnation Catalysts (activated carbon with cooper was labeled Cu-AC and γ-alúmina with cooper was labeled Cu-A) were formulated using a solution of Cu(NO3)2.3H2O (5 wt.(%) Cu) as a precursor of the active agent because of its water solubility, lower cost, and lack of poisonous elements. Activated carbons from cassava peel and γ-al- úmina were used as supports. There are two well known methods of loading the metal precursor on the support: incipient wetness impregnation and soaking method. In this case, the second one was used; the activated carbon and γ-alúmina were soaked in a copper nitrate solution for 8 days under agitation until the equilibrium was rea- ched. The ratio solid/solution (weight base) was equal to 6. The impregnated solids were filtered and scurried during 24 hours. Then, they were dried at 378 K for 24 hours 12. 2.1.2. Thermal Treatment The objective of this step is to transform the copper salt (cupric nitrate) in copper oxides, which are the ac- tive catalytic agents. The high temperature used descom- poses the nitrate releasing nitrogen oxides. The reactor must work in a nitrogen atmosphere to avoid the com- bustion of the support. The catalysts were treated in the activation reactor, at 830 K for 24 hours. After that, a nitrogen flow was maintained until the reactor reached room temperature 12. 2.2. Characterization Nitrogen adsorption-desorption isotherms were per- formed using an Autosorb-3B (Quantachrome) equip- ment. Samples of 0.100 g were oven-dried at 378 K during 24 hours and outgassed at 473 K under vacuum for 10 hours. The final pressure was less than 10–4 mbar. Textural parameters were derived from adsorption data. The specific BET surface area was estimated 15. The specific total pore volume (VT) was determined from the adsorption isotherm at the relative pressure of 0.99, converted to liquid volume assuming a nitrogen density of 0.808 g.cm–3. The specific micropore volume (VDR) was determined using the Dubinin-Radushkevich mode l16. The pore size distribution (PSD) was analyzed using the BJH method [17,21-24]. Acidity and basicity determinations of the support were made by titrating the acid sites with a strong basic solu- tion and the basic sites with a strong acid solution, fol- lowing the protocol detailed by Giraldo et al. [22,23]. The point of charge zero (PZC) of the catalyst were determined for a procedure very similar [24], which are described here. In a beaker were added 0.1 g of finely ground catalyst in an agate mortar and 20 mL of a 0.01 M KCl-0.004 M KOH. The solution was kept under con- stant stirring for 48 h. Then, titration was performed with a 0.1 M HCl solution using a burette and a stream of nitrogen to prevent carbon dioxide from the air is ab- sorbed into the solution and the formation of CO3-2 and HCO3-1. The titrant solution was added slowly 0.1 mL and was recorded by adding the aggregate volume and pH of the solution. Furthermore, the evaluation was car- ried 0.01 M solution of KCl-0004 KOH under the same conditions but without catalyst. The PCC of the catalyst was determined by plotting the pH of the solution aga- inst the volume of titrant solution to the solution without 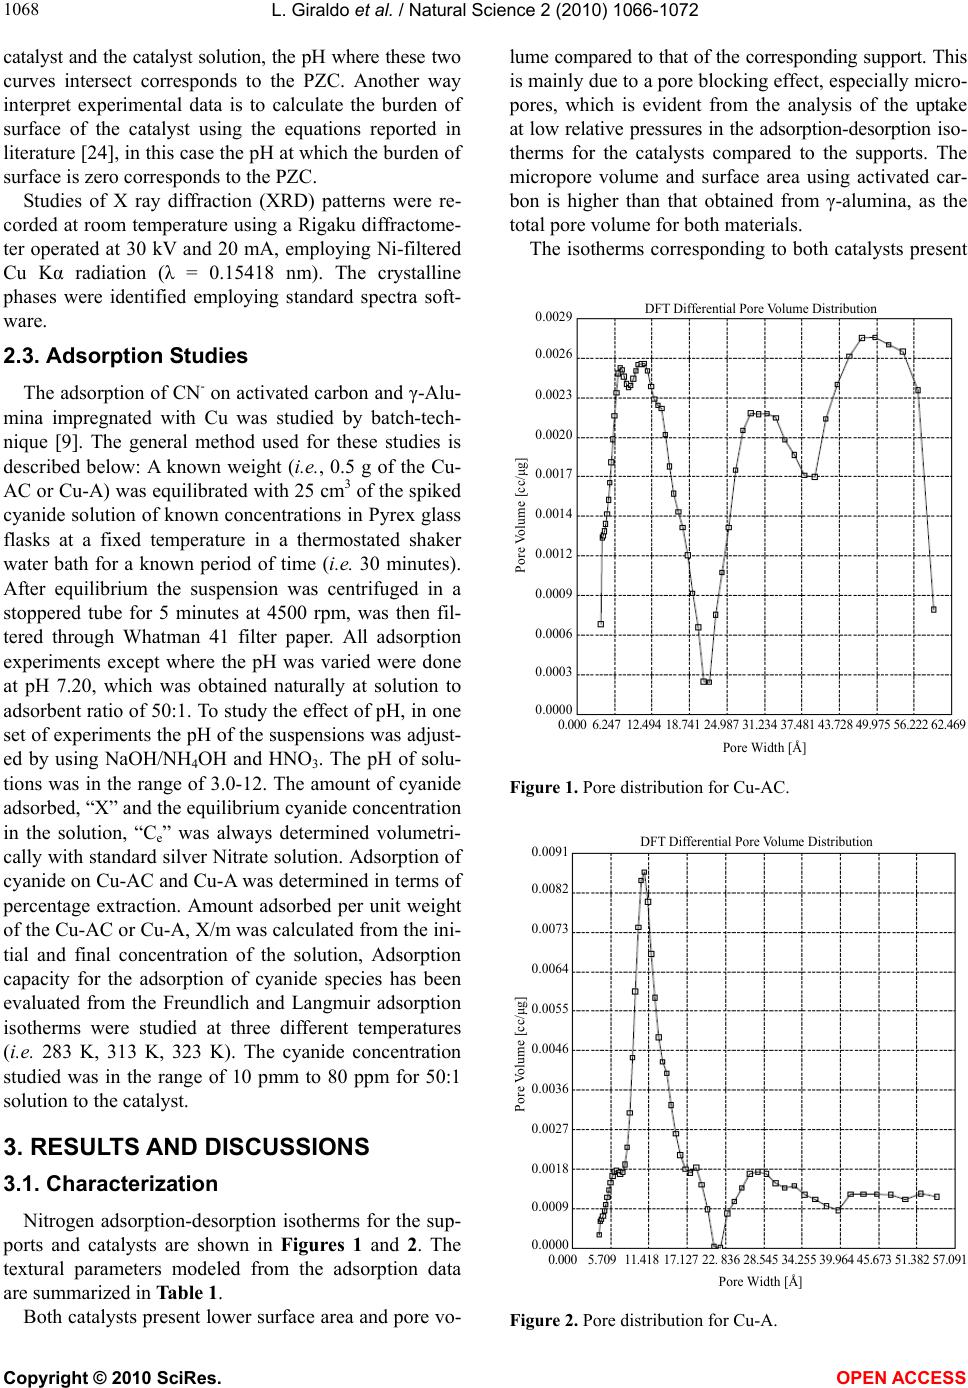 L. Giraldo et al. / Natural Science 2 (2010) 1066-1072 Copyright © 2010 SciRes. OPEN ACCESS 1068 catalyst and the catalyst solution, the pH where these two curves intersect corresponds to the PZC. Another way interpret experimental data is to calculate the burden of surface of the catalyst using the equations reported in literature [24], in this case the pH at which the burden of surface is zero corresponds to the PZC. Studies of X ray diffraction (XRD) patterns were re- corded at room temperature using a Rigaku diffractome- ter operated at 30 kV and 20 mA, employing Ni-filtered Cu Kα radiation (λ = 0.15418 nm). The crystalline phases were identified employing standard spectra soft- ware. 2.3. Adsorption Studies The adsorption of CN- on activated carbon and γ-Alu- mina impregnated with Cu was studied by batch-tech- nique [9]. The general method used for these studies is described below: A known weight (i.e., 0.5 g of the Cu- AC or Cu-A) was equilibrated with 25 cm3 of the spiked cyanide solution of known concentrations in Pyrex glass flasks at a fixed temperature in a thermostated shaker water bath for a known period of time (i.e. 30 minutes). After equilibrium the suspension was centrifuged in a stoppered tube for 5 minutes at 4500 rpm, was then fil- tered through Whatman 41 filter paper. All adsorption experiments except where the pH was varied were done at pH 7.20, which was obtained naturally at solution to adsorbent ratio of 50:1. To study the effect of pH, in one set of experiments the pH of the suspensions was adjust- ed by using NaOH/NH4OH and HNO3. The pH of solu- tions was in the range of 3.0-12. The amount of cyanide adsorbed, “X” and the equilibrium cyanide concentration in the solution, “Ce” was always determined volumetri- cally with standard silver Nitrate solution. Adsorption of cyanide on Cu-AC and Cu-A was determined in terms of percentage extraction. Amount adsorbed per unit weight of the Cu-AC or Cu-A, X/m was calculated from the ini- tial and final concentration of the solution, Adsorption capacity for the adsorption of cyanide species has been evaluated from the Freundlich and Langmuir adsorption isotherms were studied at three different temperatures (i.e. 283 K, 313 K, 323 K). The cyanide concentration studied was in the range of 10 pmm to 80 ppm for 50:1 solution to the catalyst. 3. RESULTS AND DISCUSSIONS 3.1. Characterization Nitrogen adsorption-desorption isotherms for the sup- ports and catalysts are shown in Figures 1 and 2. The textural parameters modeled from the adsorption data are summarized in Table 1. Both catalysts present lower surface area and pore vo- lume compared to that of the corresponding support. This is mainly due to a pore blocking effect, especially micro- pores, which is evident from the analysis of the uptake at low relative pressures in the adsorption-desorption iso- therms for the catalysts compared to the supports. The micropore volume and surface area using activated car- bon is higher than that obtained from γ-alumina, as the total pore volume for both materials. The isotherms corresponding to both catalysts present 0.000 6.24712.494 18.741 24.987 31.234 37.481 43.728 49.975 56.222 62.469 Pore Width [Å] DFT Differential Pore Volume Distribution 0.0029 0.0026 0.0023 0.0020 0.0017 0.0014 0.0012 0.0009 0.0006 0.0003 0.0000 Pore Volume [cc/μg] Figure 1. Pore distribution for Cu-AC. 0.000 5.709 11.418 17.127 22. 836 28.545 34.255 39.964 45.673 51.382 57.09 Pore Width [Å] DFT Differential Pore Volume Distribution 0.0091 0.0082 0.0073 0.0064 0.0055 0.0046 0.0036 0.0027 0.0018 0.0009 0.0000 Pore Volume [cc/μg] Figure 2. Pore distribution for Cu-A. 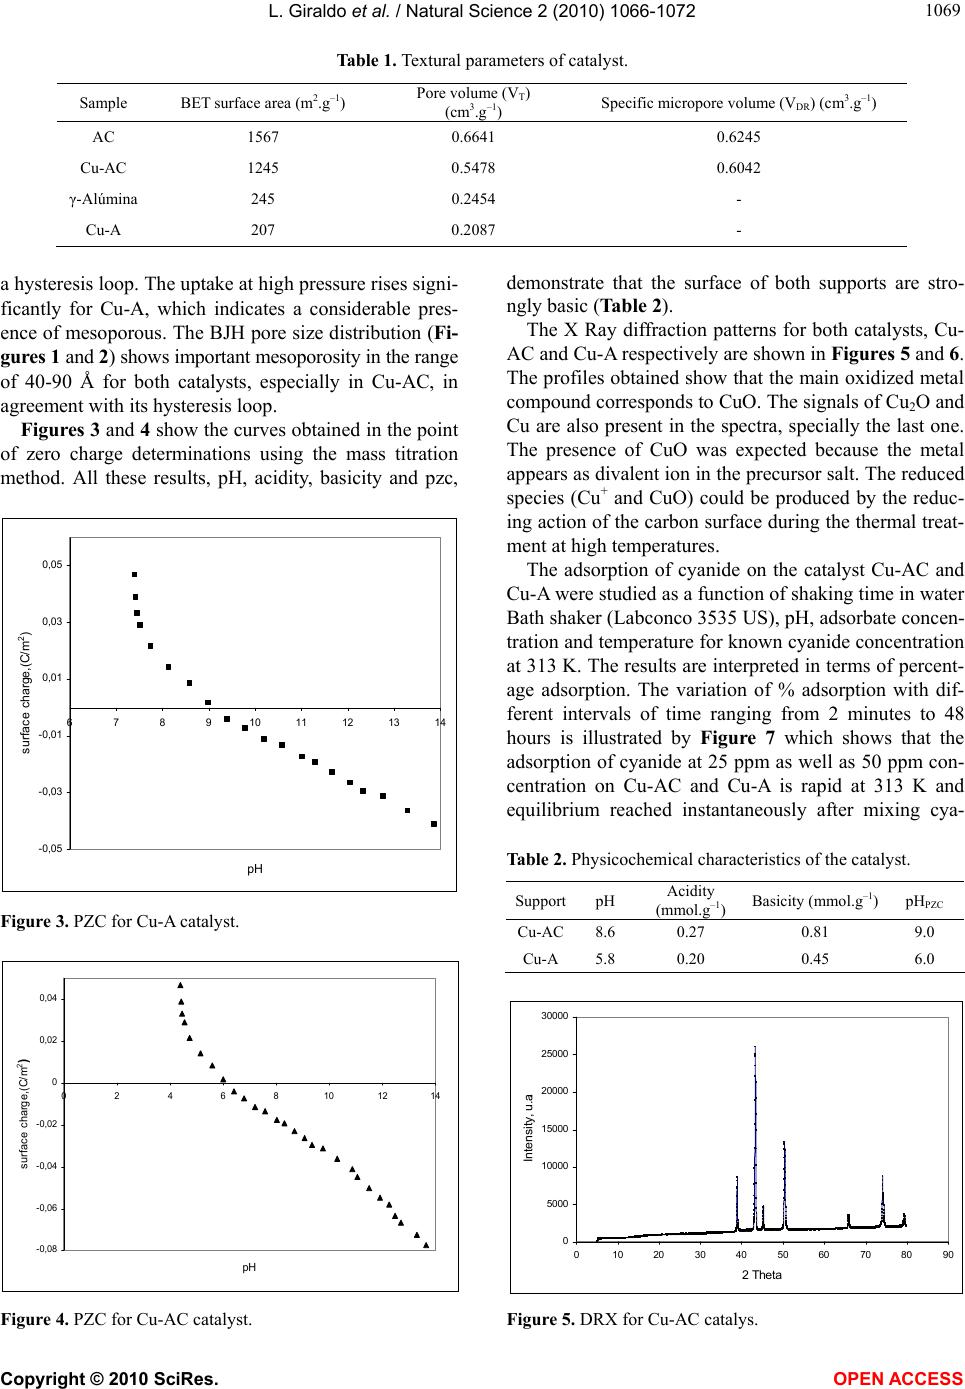 L. Giraldo et al. / Natural Science 2 (2010) 1066-1072 Copyright © 2010 SciRes. OPEN ACCESS 106 1069 Table 1. Textural parameters of catalyst. Sample BET surface area (m2.g–1) Pore volume (VT) (cm3.g–1) Specific micropore volume (VDR) (cm3.g–1) AC 1567 0.6641 0.6245 Cu-AC 1245 0.5478 0.6042 γ-Alúmina 245 0.2454 - Cu-A 207 0.2087 - a hysteresis loop. The uptake at high pressure rises signi- ficantly for Cu-A, which indicates a considerable pres- ence of mesoporous. The BJH pore size distribution (Fi- gures 1 and 2) shows important mesoporosity in the range of 40-90 Å for both catalysts, especially in Cu-AC, in agreement with its hysteresis loop. Figures 3 and 4 show the curves obtained in the point of zero charge determinations using the mass titration method. All these results, pH, acidity, basicity and pzc, -0,05 -0,03 -0,01 0,01 0,03 0,05 67891011121314 pH surface charge,(C/m 2 ) Figure 3. PZC for Cu-A catalyst. -0,08 -0,06 -0,04 -0,02 0 0,02 0,04 0 24 6 8101214 pH surface charge,(C/m 2 ) Figure 4. PZC for Cu-AC catalyst. demonstrate that the surface of both supports are stro- ngly basic (Table 2). The X Ray diffraction patterns for both catalysts, Cu- AC and Cu-A respectively are shown in Figures 5 and 6. The profiles obtained show that the main oxidized metal compound corresponds to CuO. The signals of Cu2O and Cu are also present in the spectra, specially the last one. The presence of CuO was expected because the metal appears as divalent ion in the precursor salt. The reduced species (Cu+ and CuO) could be produced by the reduc- ing action of the carbon surface during the thermal treat- ment at high temperatures. The adsorption of cyanide on the catalyst Cu-AC and Cu-A were studied as a function of shaking time in water Bath shaker (Labconco 3535 US), pH, adsorbate concen- tration and temperature for known cyanide concentration at 313 K. The results are interpreted in terms of percent- age adsorption. The variation of % adsorption with dif- ferent intervals of time ranging from 2 minutes to 48 hours is illustrated by Figure 7 which shows that the adsorption of cyanide at 25 ppm as well as 50 ppm con- centration on Cu-AC and Cu-A is rapid at 313 K and equilibrium reached instantaneously after mixing cya- Table 2. Physicochemical characteristics of the catalyst. SupportpH Acidity (mmol.g–1) Basicity (mmol.g–1)pH PZC Cu-AC8.6 0.27 0.81 9.0 Cu-A 5.8 0.20 0.45 6.0 0 5000 10000 15000 20000 25000 30000 0 102030405060708090 2 Theta Intensity, u.a. Figure 5. DRX for Cu-AC catalys. 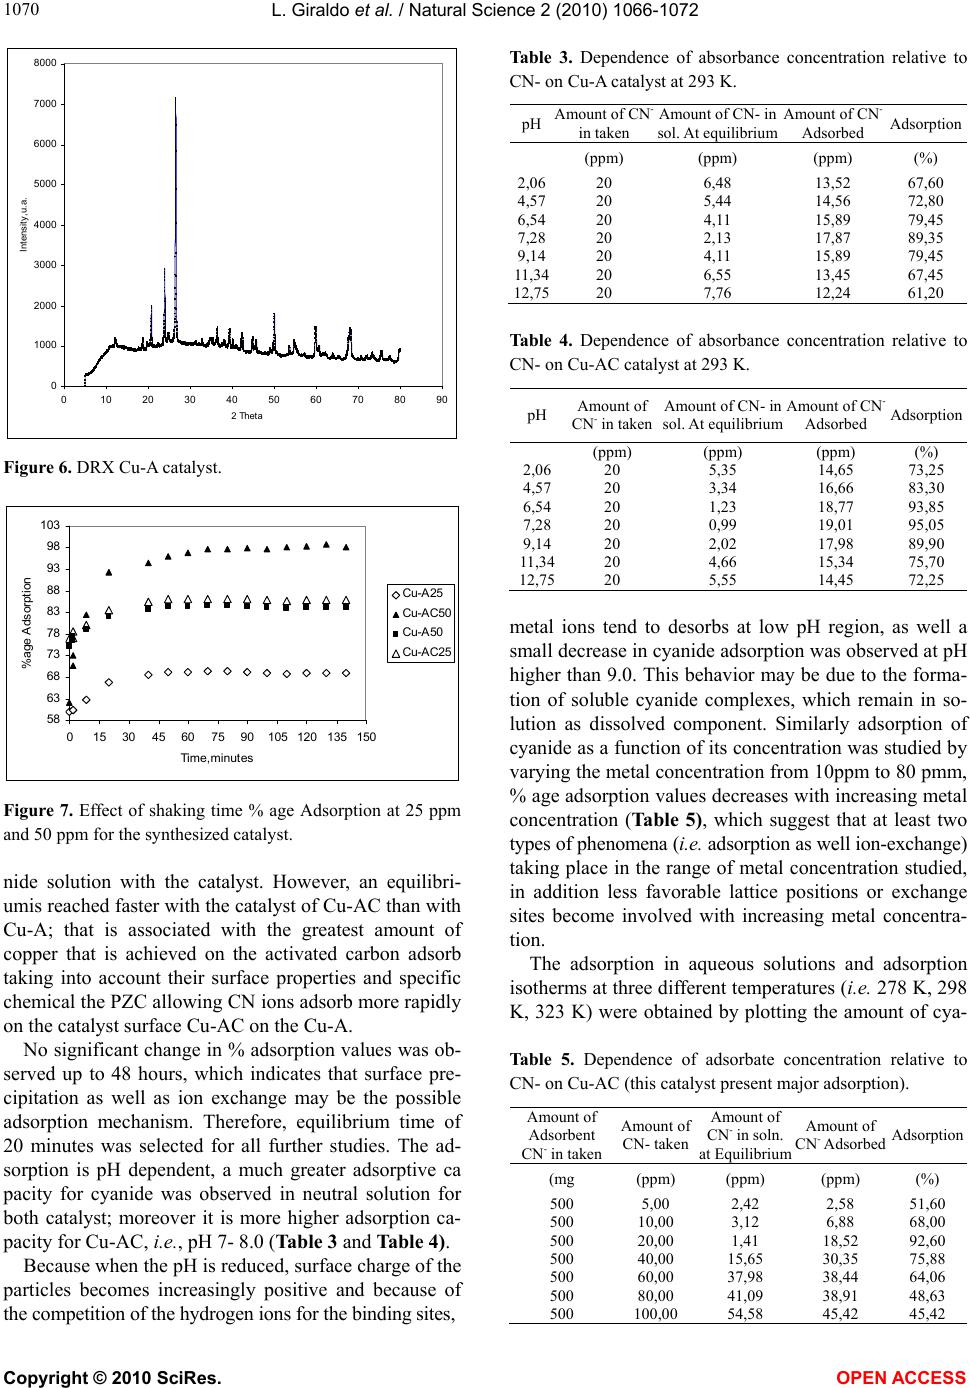 L. Giraldo et al. / Natural Science 2 (2010) 1066-1072 Copyright © 2010 SciRes. OPEN ACCESS 1070 0 1000 2000 3000 4000 5000 6000 7000 8000 0 102030405060708090 2 Theta Intensity,u.a. Figure 6. DRX Cu-A catalyst. 58 63 68 73 78 83 88 93 98 103 015 3045 6075 90105120135150 Tim e,mi nutes %age Adsorption Cu-A25 Cu-AC50 Cu-A50 Cu-AC25 Figure 7. Effect of shaking time % age Adsorption at 25 ppm and 50 ppm for the synthesized catalyst. nide solution with the catalyst. However, an equilibri- umis reached faster with the catalyst of Cu-AC than with Cu-A; that is associated with the greatest amount of copper that is achieved on the activated carbon adsorb taking into account their surface properties and specific chemical the PZC allowing CN ions adsorb more rapidly on the catalyst surface Cu-AC on the Cu-A. No significant change in % adsorption values was ob- served up to 48 hours, which indicates that surface pre- cipitation as well as ion exchange may be the possible adsorption mechanism. Therefore, equilibrium time of 20 minutes was selected for all further studies. The ad- sorption is pH dependent, a much greater adsorptive ca pacity for cyanide was observed in neutral solution for both catalyst; moreover it is more higher adsorption ca- pacity for Cu-AC, i.e., pH 7- 8.0 (Table 3 and Table 4). Because when the pH is reduced, surface charge of the particles becomes increasingly positive and because of the competition of the hydrogen ions for the binding sites, Table 3. Dependence of absorbance concentration relative to CN- on Cu-A catalyst at 293 K. pH Amount of CN- in taken Amount of CN- in sol. At equilibrium Amount of CN- Adsorbed Adsorption (ppm) (ppm) (ppm) (%) 2,06 4,57 6,54 7,28 9,14 11 , 3 4 12,75 20 20 20 20 20 20 20 6,48 5,44 4,11 2,13 4,11 6,55 7,76 13,52 14,56 15,89 17,87 15,89 13,45 12,24 67,60 72,80 79,45 89,35 79,45 67,45 61,20 Table 4. Dependence of absorbance concentration relative to CN- on Cu-AC catalyst at 293 K. pH Amount of CN- in taken Amount of CN- in sol. At equilibrium Amount of CN- Adsorbed Adsorption (ppm) (ppm) (ppm) (%) 2,06 4,57 6,54 7,28 9,14 11 , 3 4 12,75 20 20 20 20 20 20 20 5,35 3,34 1,23 0,99 2,02 4,66 5,55 14,65 16,66 18,77 19,01 17,98 15,34 14,45 73,25 83,30 93,85 95,05 89,90 75,70 72,25 metal ions tend to desorbs at low pH region, as well a small decrease in cyanide adsorption was observed at pH higher than 9.0. This behavior may be due to the forma- tion of soluble cyanide complexes, which remain in so- lution as dissolved component. Similarly adsorption of cyanide as a function of its concentration was studied by varying the metal concentration from 10ppm to 80 pmm, % age adsorption values decreases with increasing metal concentration (Table 5), which suggest that at least two types of phenomena (i.e. adsorption as well ion-exchange) taking place in the range of metal concentration studied, in addition less favorable lattice positions or exchange sites become involved with increasing metal concentra- tion. The adsorption in aqueous solutions and adsorption isotherms at three different temperatures (i.e. 278 K, 298 K, 323 K) were obtained by plotting the amount of cya- Table 5. Dependence of adsorbate concentration relative to CN- on Cu-AC (this catalyst present major adsorption). Amount of Adsorbent CN- in taken Amount of CN- taken Amount of CN- in soln. at Equilibrium Amount of CN- AdsorbedAdsorption (mg (ppm) (ppm) (ppm) (%) 500 500 500 500 500 500 500 5,00 10,00 20,00 40,00 60,00 80,00 100,00 2,42 3,12 1,41 15,65 37,98 41,09 54,58 2,58 6,88 18,52 30,35 38,44 38,91 45,42 51,60 68,00 92,60 75,88 64,06 48,63 45,42 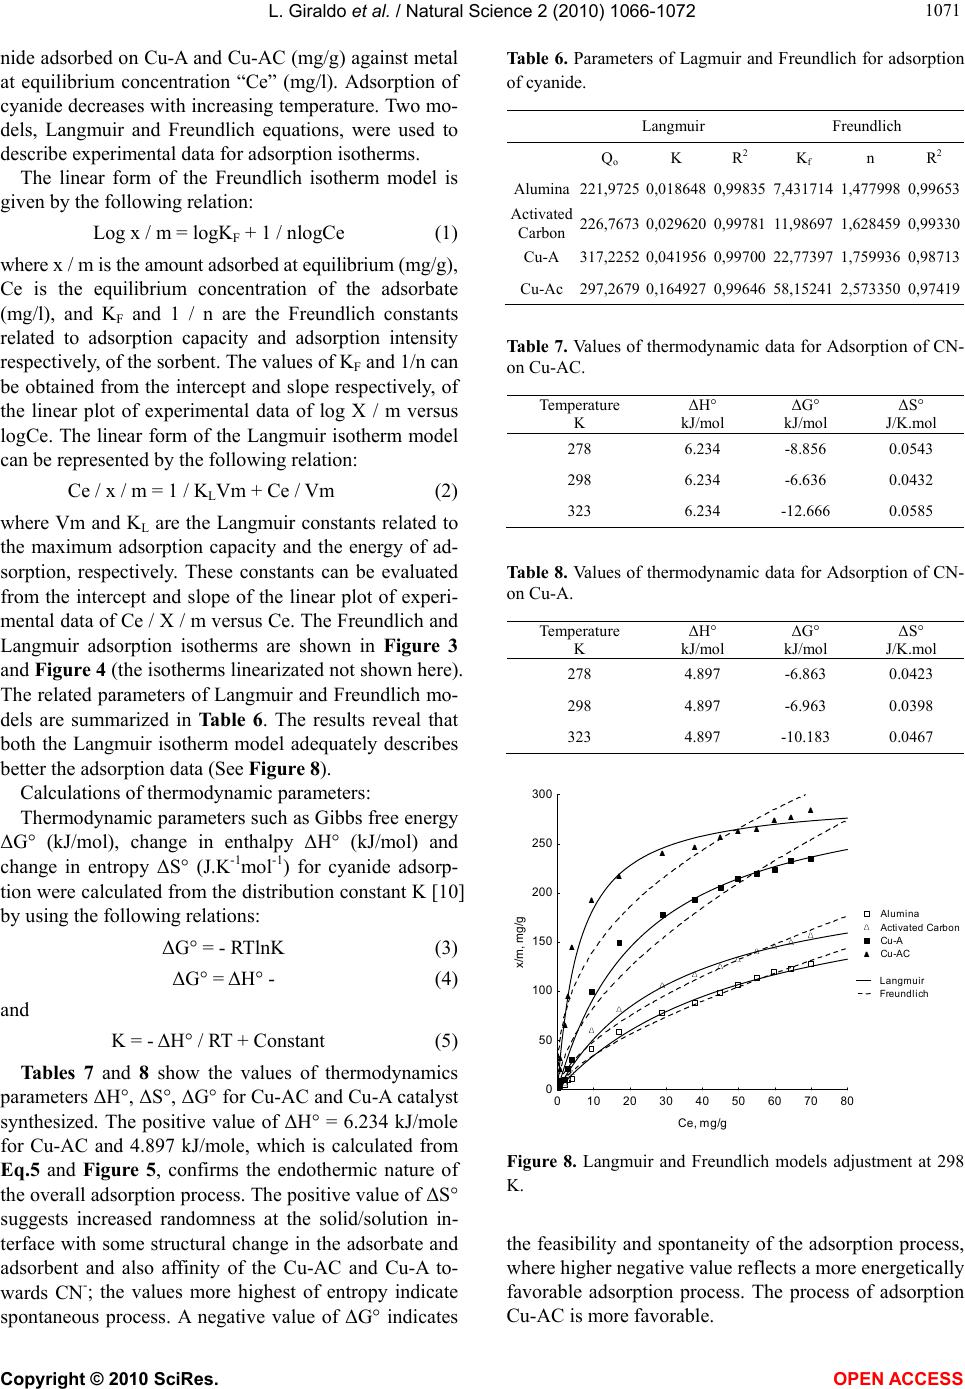 L. Giraldo et al. / Natural Science 2 (2010) 1066-1072 Copyright © 2010 SciRes. OPEN ACCESS 107 1071 nide adsorbed on Cu-A and Cu-AC (mg/g) against metal at equilibrium concentration “Ce” (mg/l). Adsorption of cyanide decreases with increasing temperature. Two mo- dels, Langmuir and Freundlich equations, were used to describe experimental data for adsorption isotherms. The linear form of the Freundlich isotherm model is given by the following relation: Log x / m = logKF + 1 / nlogCe (1) where x / m is the amount adsorbed at equilibrium (mg/g), Ce is the equilibrium concentration of the adsorbate (mg/l), and KF and 1 / n are the Freundlich constants related to adsorption capacity and adsorption intensity respectively, of the sorbent. The values of KF and 1/n can be obtained from the intercept and slope respectively, of the linear plot of experimental data of log X / m versus logCe. The linear form of the Langmuir isotherm model can be represented by the following relation: Ce / x / m = 1 / KLVm + Ce / Vm (2) where Vm and KL are the Langmuir constants related to the maximum adsorption capacity and the energy of ad- sorption, respectively. These constants can be evaluated from the intercept and slope of the linear plot of experi- mental data of Ce / X / m versus Ce. The Freundlich and Langmuir adsorption isotherms are shown in Figure 3 and Figure 4 (the isotherms linearizated not shown here). The related parameters of Langmuir and Freundlich mo- dels are summarized in Table 6. The results reveal that both the Langmuir isotherm model adequately describes better the adsorption data (See Figure 8). Calculations of thermodynamic parameters: Thermodynamic parameters such as Gibbs free energy ΔG° (kJ/mol), change in enthalpy ΔH° (kJ/mol) and change in entropy ΔS° (J.K-1mo l-1) for cyanide adsorp- tion were calculated from the distribution constant K [10] by using the following relations: ΔG° = - RTlnK (3) ΔG° = ΔH° - (4) and K = - ΔH° / RT + Constant (5) Tables 7 and 8 show the values of thermodynamics parameters ΔH°, ΔS°, ΔG° for Cu-AC and Cu-A catalyst synthesized. The positive value of ΔH° = 6.234 kJ/mole for Cu-AC and 4.897 kJ/mole, which is calculated from Eq.5 and Figure 5, confirms the endothermic nature of the overall adsorption process. The positive value of ΔS° suggests increased randomness at the solid/solution in- terface with some structural change in the adsorbate and adsorbent and also affinity of the Cu-AC and Cu-A to- wards CN-; the values more highest of entropy indicate spontaneous process. A negative value of ΔG° indicates Table 6. Parameters of Lagmuir and Freundlich for adsorption of cyanide. Langmuir Freundlich Qo K R2 Kf n R2 Alumina221,9725 0,018648 0,99835 7,431714 1,477998 0,99653 Activated Carbon 226,7673 0,0296200,99781 11,98697 1,6284590,99330 Cu-A 317,2252 0,0419560,99700 22,77397 1,759936 0,98713 Cu-Ac 297,2679 0,1649270,99646 58,15241 2,573350 0,97419 Table 7. Values of thermodynamic data for Adsorption of CN- on Cu-AC. Temperature K ΔH° kJ/mol ΔG° kJ/mol ΔS° J/K.mol 278 6.234 -8.856 0.0543 298 6.234 -6.636 0.0432 323 6.234 -12.666 0.0585 Table 8. Values of thermodynamic data for Adsorption of CN- on Cu-A. Temperature K ΔH° kJ/mol ΔG° kJ/mol ΔS° J/K.mol 278 4.897 -6.863 0.0423 298 4.897 -6.963 0.0398 323 4.897 -10.183 0.0467 Alumina Activated Carbon Cu-A Cu-AC Langmuir Freundlich 0 1020304050607080 Ce, mg/g 0 50 100 150 200 250 300 x/m, mg/g Figure 8. Langmuir and Freundlich models adjustment at 298 K. the feasibility and spontaneity of the adsorption process, where higher negative value reflects a more energetically favorable adsorption process. The process of adsorption Cu-AC is more favorable. 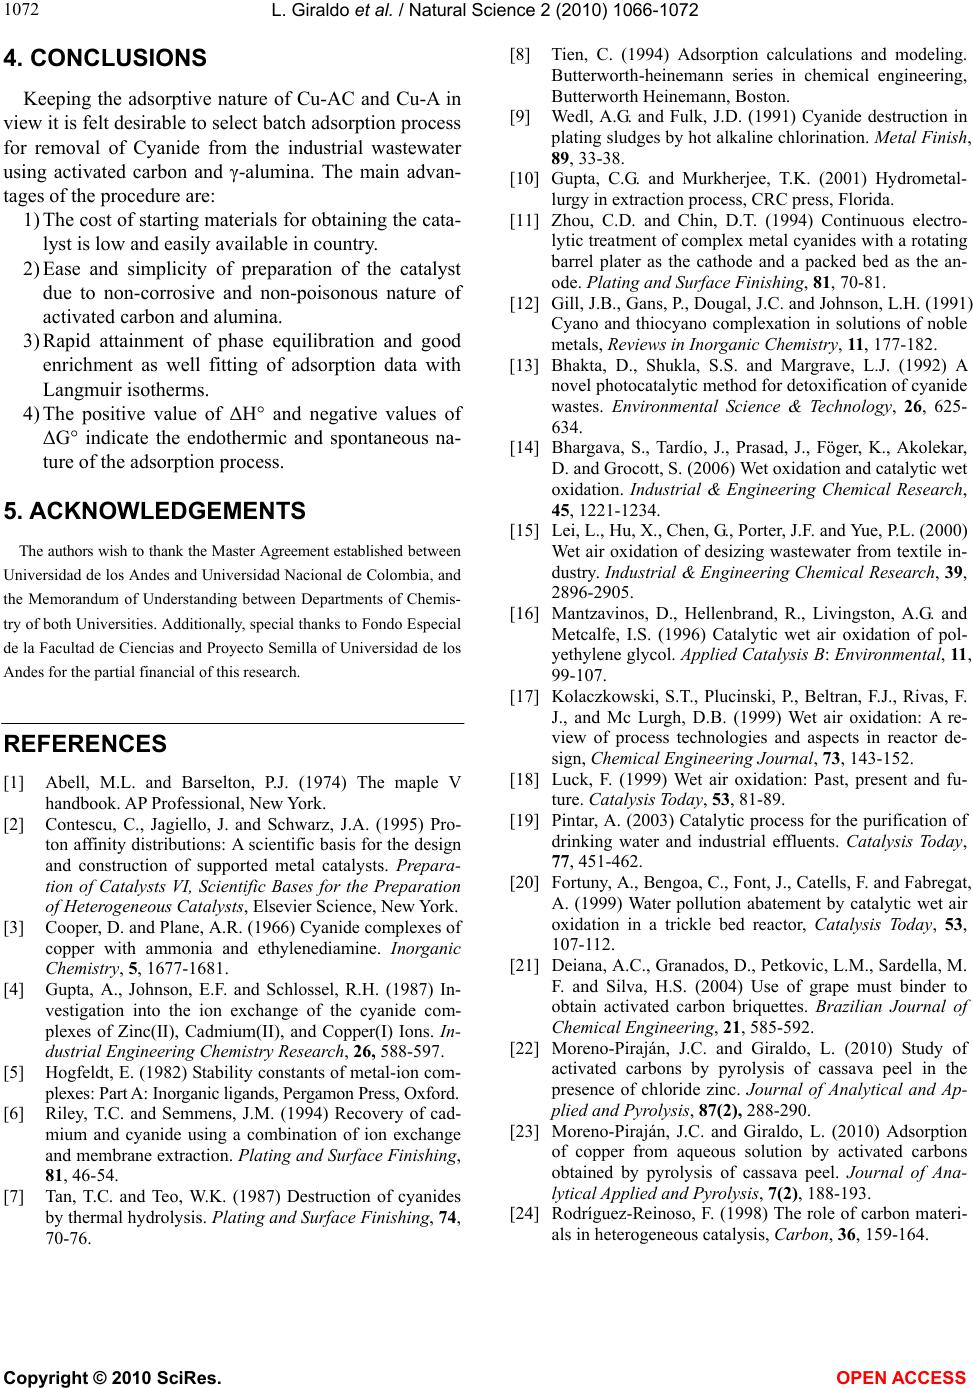 L. Giraldo et al. / Natural Science 2 (2010) 1066-1072 Copyright © 2010 SciRes. OPEN ACCESS 1072 4. CONCLUSIONS Keeping the adsorptive nature of Cu-AC and Cu-A in view it is felt desirable to select batch adsorption process for removal of Cyanide from the industrial wastewater using activated carbon and γ-alumina. The main advan- tages of the procedure are: 1) The cost of starting materials for obtaining the cata- lyst is low and easily available in country. 2) Ease and simplicity of preparation of the catalyst due to non-corrosive and non-poisonous nature of activated carbon and alumina. 3) Rapid attainment of phase equilibration and good enrichment as well fitting of adsorption data with Langmuir isotherms. 4) The positive value of ΔH° and negative values of ΔG° indicate the endothermic and spontaneous na- ture of the adsorption process. 5. ACKNOWLEDGEMENTS The authors wish to thank the Master Agreement established between Universidad de los Andes and Universidad Nacional de Colombia, and the Memorandum of Understanding between Departments of Chemis- try of both Universities. Additionally, special thanks to Fondo Especial de la Facultad de Ciencias and Proyecto Semilla of Universidad de los Andes for the partial financial of this research. REFERENCES [1] Abell, M.L. and Barselton, P.J. (1974) The maple V handbook. AP Professional, New York. [2] Contescu, C., Jagiello, J. and Schwarz, J.A. (1995) Pro- ton affinity distributions: A scientific basis for the design and construction of supported metal catalysts. Prepara- tion of Catalysts VI, Scientific Bases for the Preparation of Heterogeneous Catalysts, Elsevier Science, New York. [3] Cooper, D. and Plane, A.R. (1966) Cyanide complexes of copper with ammonia and ethylenediamine. Inorganic Chemistry, 5, 1677-1681. [4] Gupta, A., Johnson, E.F. and Schlossel, R.H. (1987) In- vestigation into the ion exchange of the cyanide com- plexes of Zinc(II), Cadmium(II), and Copper(I) Ions. In- dustrial Engineering Chemistry Research, 26, 588-597. [5] Hogfeldt, E. (1982) Stability constants of metal-ion com- plexes: Part A: Inorganic ligands, Pergamon Press, Oxford. [6] Riley, T.C. and Semmens, J.M. (1994) Recovery of cad- mium and cyanide using a combination of ion exchange and membrane extraction. Plating and Surface Finishing, 81, 46-54. [7] Tan, T.C. and Teo, W.K. (1987) Destruction of cyanides by thermal hydrolysis. Plating and Surface Finishing, 74, 70-76. [8] Tien, C. (1994) Adsorption calculations and modeling. Butterworth-heinemann series in chemical engineering, Butterworth Heinemann, Boston. [9] Wedl, A.G. and Fulk, J.D. (1991) Cyanide destruction in plating sludges by hot alkaline chlorination. Metal Finish, 89, 33-38. [10] Gupta, C.G. and Murkherjee, T.K. (2001) Hydrometal- lurgy in extraction process, CRC press, Florida. [11] Zhou, C.D. and Chin, D.T. (1994) Continuous electro- lytic treatment of complex metal cyanides with a rotating barrel plater as the cathode and a packed bed as the an- ode. Plating and Surface Finishing, 81, 70-81. [12] Gill, J.B., Gans, P., Dougal, J.C. and Johnson, L.H. (1991) Cyano and thiocyano complexation in solutions of noble metals, Reviews in Inorganic Chemistry, 11, 177-182. [13] Bhakta, D., Shukla, S.S. and Margrave, L.J. (1992) A novel photocatalytic method for detoxification of cyanide wastes. Environmental Science & Technology, 26, 625- 634. [14] Bhargava, S., Tardío, J., Prasad, J., Föger, K., Akolekar, D. and Grocott, S. (2006) Wet oxidation and catalytic wet oxidation. Industrial & Engineering Chemical Research, 45, 1221-1234. [15] Lei, L., Hu, X., Chen, G., Porter, J.F. and Yue, P.L. (2000) Wet air oxidation of desizing wastewater from textile in- dustry. Industrial & Engineering Chemical Research, 39, 2896-2905. [16] Mantzavinos, D., Hellenbrand, R., Livingston, A.G. and Metcalfe, I.S. (1996) Catalytic wet air oxidation of pol- yethylene glycol. Applied Catalysis B: Environmental, 11, 99-107. [17] Kolaczkowski, S.T., Plucinski, P., Beltran, F.J., Rivas, F. J., and Mc Lurgh, D.B. (1999) Wet air oxidation: A re- view of process technologies and aspects in reactor de- sign, Chemical Engineering Journal, 73, 143-152. [18] Luck, F. (1999) Wet air oxidation: Past, present and fu- ture. Catalysis Today, 53, 81-89. [19] Pintar, A. (2003) Catalytic process for the purification of drinking water and industrial effluents. Catalysis Today, 77, 451-462. [20] Fortuny, A., Bengoa, C., Font, J., Catells, F. and Fabregat, A. (1999) Water pollution abatement by catalytic wet air oxidation in a trickle bed reactor, Catalysis Today, 53, 107-112. [21] Deiana, A.C., Granados, D., Petkovic, L.M., Sardella, M. F. and Silva, H.S. (2004) Use of grape must binder to obtain activated carbon briquettes. Brazilian Journal of Chemical Engineering, 21, 585-592. [22] Moreno-Piraján, J.C. and Giraldo, L. (2010) Study of activated carbons by pyrolysis of cassava peel in the presence of chloride zinc. Journal of Analytical and Ap- plied and Pyrolysis, 87(2), 288-290. [23] Moreno-Piraján, J.C. and Giraldo, L. (2010) Adsorption of copper from aqueous solution by activated carbons obtained by pyrolysis of cassava peel. Journal of Ana- lytical Applied and Pyrolysis, 7(2), 188-193. [24] Rodríguez-Reinoso, F. (1998) The role of carbon materi- als in heterogeneous catalysis, Carbon, 36, 159-164.
|