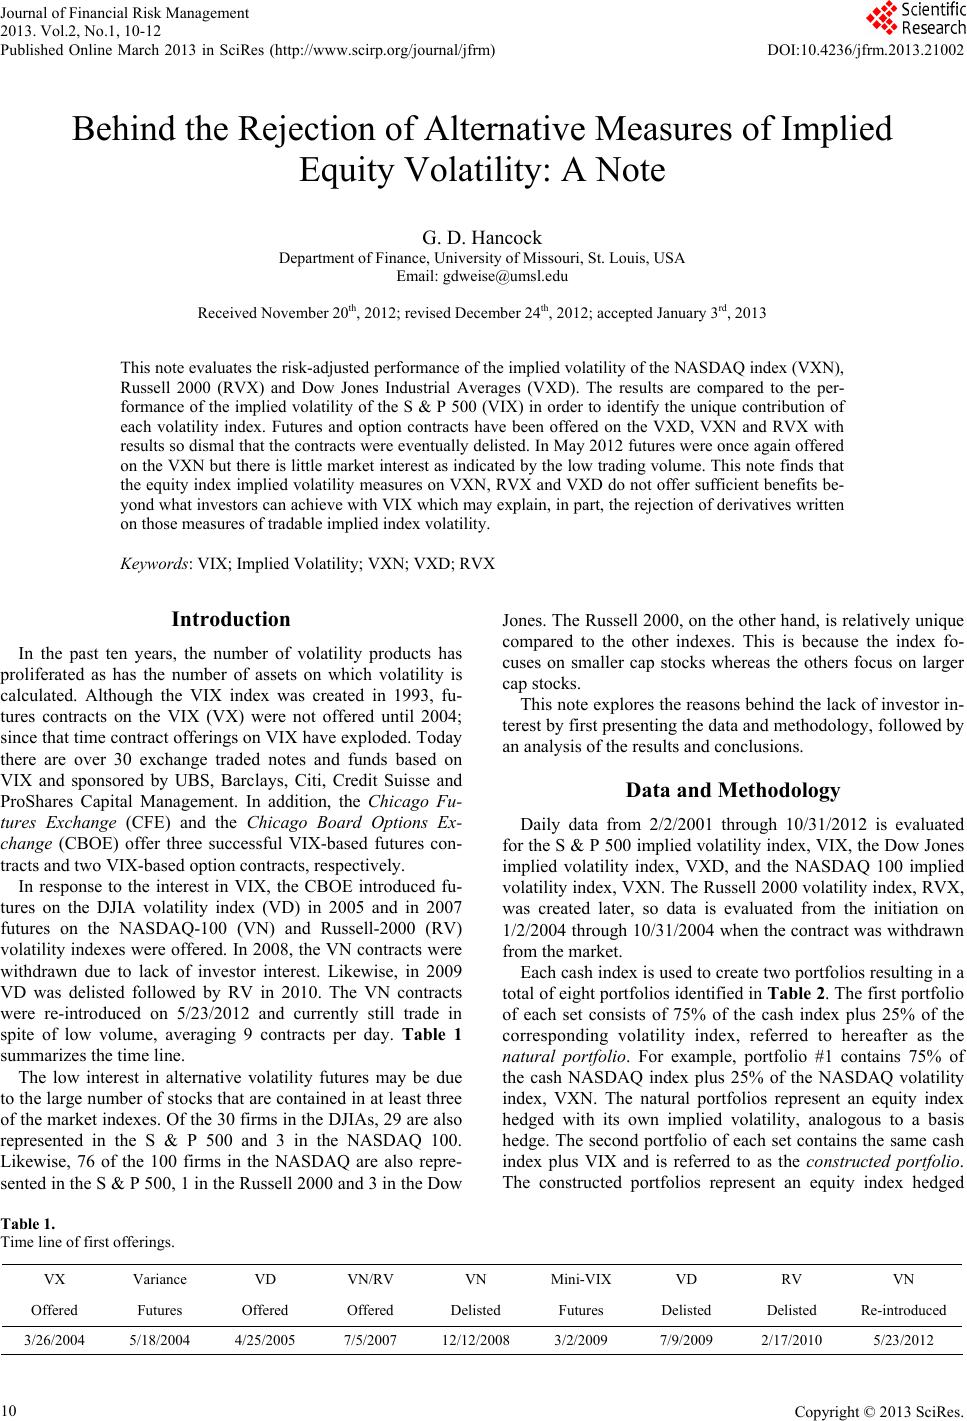
G. D. HANCOCK
Table 2.
Portfolio identities.
Symbol Description
Portfolio #1, p1 75% NASDAQ/25% VXN
Portfolio #2, p2 75% NASDAQ/25% VIX
Portfolio #3, p3 75% S & P500/25% VIX
Portfolio #4, p4 75% S & P500/25% VXN
Portfolio #5, p5 75% DJIA/25% VXD
Portfolio #6, p6 75% DJIA/25% VIX
Portfolio #7, p7 75% Russell/25% RVX
Portfolio #8, p8 75% Russell/ 25% VIX
with the implied volatility of a dissimilar equity index. It is
expected that hedging with matching volatility, as with the
natural portfolios, will outperform hedging with disparate vola-
tility, as with the constructed portfolios.
The risk-adjusted returns (RAR) of the natural portfolios
(odd numbered) are compared to the performance of the con-
structed portfolios (even numbered). When the performance of
the natural portfolio is greater than the corresponding con-
structed portfolio the conclusion is that the matched volatility
fills a unique need.
Specifically, the risk-adjusted return (RAR) is defined by
Equation (1) below and applied to each of the 8 portfolios:
,,,
tptp
RAR Rt
(1)
The portfolio returns and standard deviations are obtained as
follows:
,,
0.750.25 ,
tctvt
xR xR (2)
12
22 22
,,,,,,
0.750.2520.75 0.25
ptctvtctvt ct vt
xxxxxxx
(3)
The variables are defined as:
,
t
AR = The risk-adjusted return of the portfolio on the tth
day;
,ct
= The return on the cash index on the tth day;
,vt
= The return on the volatility index on the tth day;
,ct
= The standard deviation of returns for the cash index
over the tth time period;
,vt
= The standard deviation of returns for the volatility
index over the tth time period; and,
,ctvt
= The correlation of returns between the cash index
and the volatility index over the tth time period.
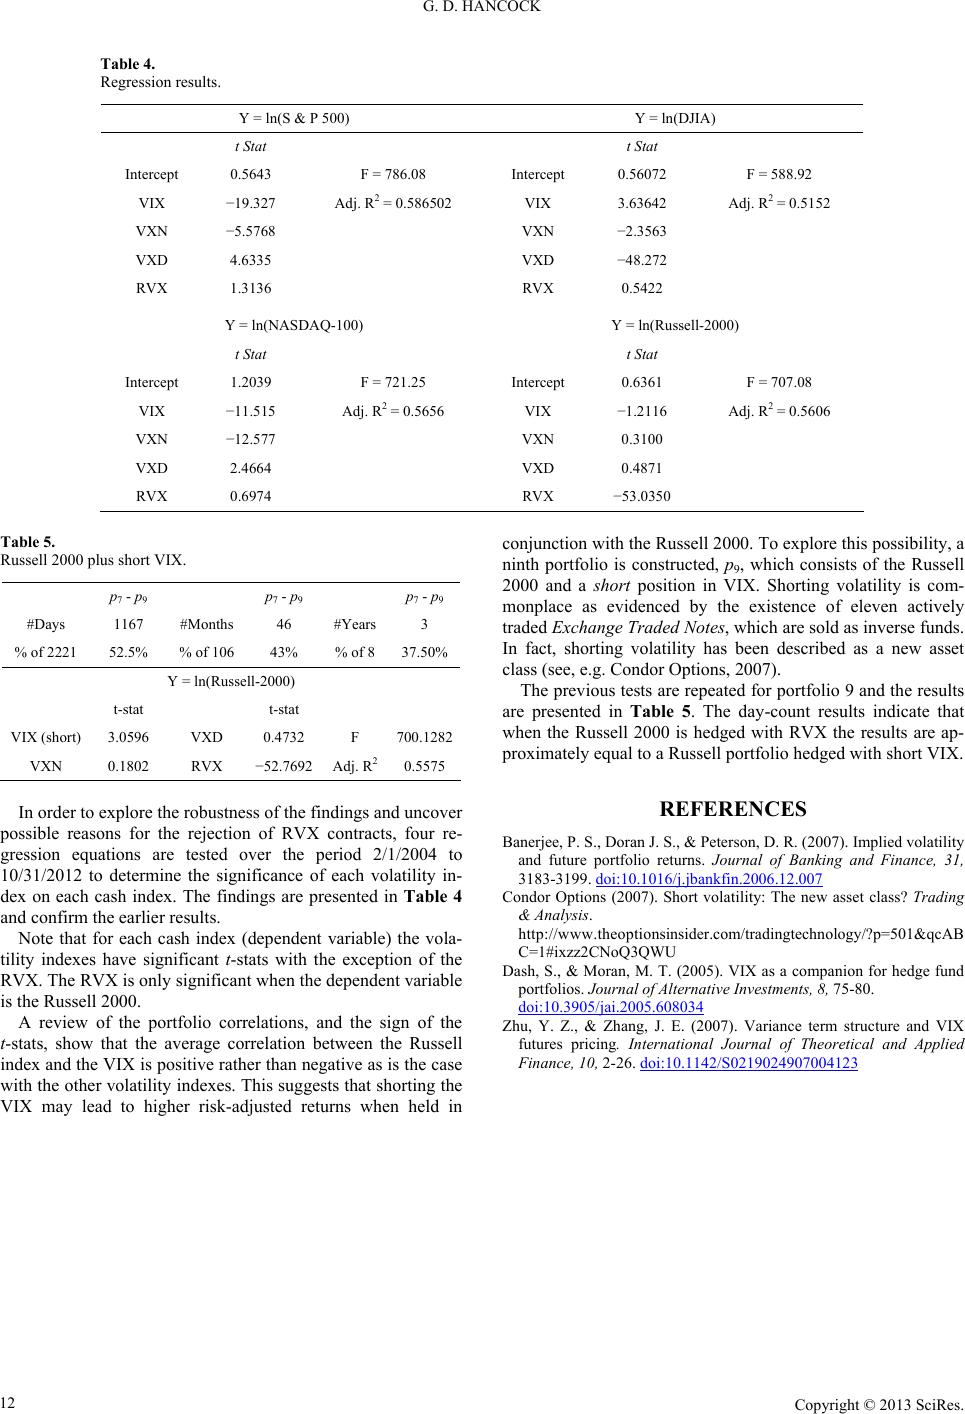
A second series of tests are performed to verify the robust-
ness of the RAR test results. This test is a simple linear regres-
sion, shown in Equation (4), designed to determine the amount
of variation in the cash index explained by volatility.
,01,2,3,4,c tvxdtrvx tvxn tvix tt
RbRbRbxRbxR
(4)
where:
,vxd t
= the return on the DJIA volatility index on day t;
,rvxt
= the return on the Russell-2000 volatility index on
day t;
,vxn t
= the return on the NASDAQ-100 volatility index on
day t;
,vix t
= the return on the S & P 500 volatility index on day t.
Results
Table 3 is presented as the difference between each natural
portfolio’s RAR and the corresponding RAR for the constructed
portfolio.
The first column, of the day-count results, indicates that in
49.5% of the days evaluated, the NASDAQ plus VIX portfolio
(p2) outperforms the NASDAQ plus VXN portfolio (p1). The
month-count and year-count results confirm that portfolio #1
and #2 perform almost equally over time.
The S & P 500 portfolios are shown in the second column of
the results presented in Table 3. Since the S & P natural portfo-
lio (p3) includes VIX, the comparison portfolio (p4) is com-
prised of the S & P 500 plus VXN. All three time counting
schemes indicate that the performance of the two portfolios is
approximately the same. Slightly different results are reported
for the DJIA portfolios. According to the day-count, the per-
formance of the natural DJIA portfolio is equal to the con-
structed portfolio. However, the month-count and year-count
results suggest that the natural portfolio (p5) more frequently
out performs the VIX hedged portfolio (p6).
Finally, the Russell-2000 portfolio findings diverge dramati-
cally from the others. According to all three time measures, the
natural portfolio (p7) almost always outperforms the con-
structed portfolio (p8) which suggests that option or futures
contracts offered on RVX should fill a unique need that cannot
be met using VIX. No so for the VXN and the VXD contracts
which appear to be mostly redundant and have, therefore, been
rejected by the market. Yet, the market has also rejected con-
tracts on the unique RVX.
All of the portfolio combinations produce smaller differences
in performance as the holding period is lengthened. This is
most likely a result of the well-documented mean reverting
behavior of volatility indexes (see, for e.g., Dash and Moran,
2005), Zhu and Zhang (2007) and Banerjee, Doran and Peter-
son (2007). It is the mean reversion tendency that explains at
least one of the reasons that sponsors of volatility products
recommend a very short holding period. Given the pricing be-
havior of volatility products and the recommendation of the
sponsors, more weight should be placed on the one-day results.
The monthly and annual results are best viewed as robustness
tests since, under no circumstances, are volatility products
recommended for long-term investment purposes.
Table 3.
Differences between portfolio RAR.
Count if <0 (Day-Count)
p1 - p2 p3 - p4 p5 - p6 p7 - p8
#Days 1460 1464 1493 236
%of 2950 49.50% 49.60% 50.60% 10.60%
Count if <0 (Month-Count)
p1 - p2 p3 - p4 p5 - p6 p7 - p8
#Months 66 68 57 0
% of 141 48.50% 50% 42% 0%
Count if <0 (Year-Count)
p1 - p2 p3 - p4 p5 - p6 p7 - p8
#Years 6 7 4 0
% of 12 50.00% 58% 33% 0%
Copyright © 2013 SciRes. 11