Paper Menu >>
Journal Menu >>
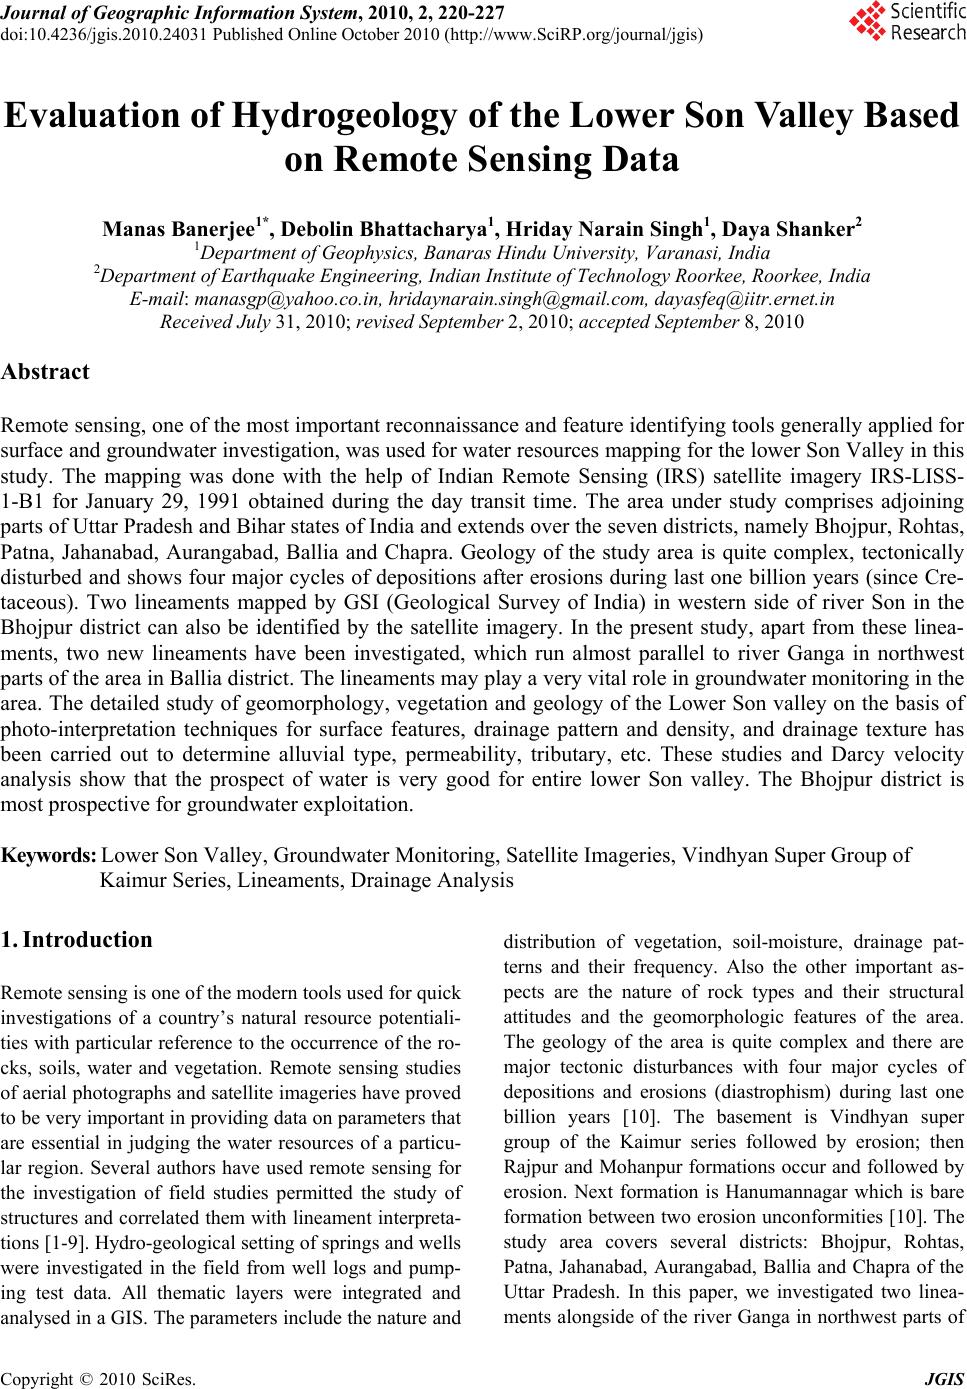 Journal of Geographic Information System, 2010, 2, 220-227 doi:10.4236/jgis.2010.24031 Published Online October 2010 (http://www.SciRP.org/journal/jgis) Copyright © 2010 SciRes. JGIS Evaluation of Hydrogeology of the Lower Son Valley Based on Remote Sensing Data Manas Banerjee1*, Debolin Bhattacharya1, Hriday Narain Singh1, Daya Shanker2 1Department of Geophysics, Banaras Hindu University, Varanasi, India 2Department of Earthquake Engineering, Indian Institute of Technology Roorkee, Roorkee, India E-mail: manasgp@yahoo.co.in, hridaynarain.singh@gmail.com, dayasfeq@iitr.ernet.in Received July 31, 2010; revised September 2, 2010; accepted September 8, 2010 Abstract Remote sensing, one of the most important reconnaissance and feature identifying tools generally applied for surface and groundwater investigation, was used for water resources mapping for the lower Son Valley in this study. The mapping was done with the help of Indian Remote Sensing (IRS) satellite imagery IRS-LISS- 1-B1 for January 29, 1991 obtained during the day transit time. The area under study comprises adjoining parts of Uttar Pradesh and Bihar states of India and extends over the seven districts, namely Bhojpur, Rohtas, Patna, Jahanabad, Aurangabad, Ballia and Chapra. Geology of the study area is quite complex, tectonically disturbed and shows four major cycles of depositions after erosions during last one billion years (since Cre- taceous). Two lineaments mapped by GSI (Geological Survey of India) in western side of river Son in the Bhojpur district can also be identified by the satellite imagery. In the present study, apart from these linea- ments, two new lineaments have been investigated, which run almost parallel to river Ganga in northwest parts of the area in Ballia district. The lineaments may play a very vital role in groundwater monitoring in the area. The detailed study of geomorphology, vegetation and geology of the Lower Son valley on the basis of photo-interpretation techniques for surface features, drainage pattern and density, and drainage texture has been carried out to determine alluvial type, permeability, tributary, etc. These studies and Darcy velocity analysis show that the prospect of water is very good for entire lower Son valley. The Bhojpur district is most prospective for groundwater exploitation. Keywords: Lower Son Valley, Groundwater Monitoring, Satellite Imageries, Vindhyan Super Group of Kaimur Series, Lineaments, Drainage Analysis 1. Introduction Remote sensing is one of the modern tools used for quick investigations of a country’s natural resource potentiali- ties with particular reference to the occurrence of the ro- cks, soils, water and vegetation. Remote sensing studies of aerial photographs and satellite imageries have proved to be very important in providing data on parameters that are essential in judging the water resources of a particu- lar region. Several authors have used remote sensing for the investigation of field studies permitted the study of structures and correlated them with lineament interpreta- tions [1-9]. Hydro-geological setting of springs and wells were investigated in the field from well logs and pump- ing test data. All thematic layers were integrated and analysed in a GIS. The parameters include the nature and distribution of vegetation, soil-moisture, drainage pat- terns and their frequency. Also the other important as- pects are the nature of rock types and their structural attitudes and the geomorphologic features of the area. The geology of the area is quite complex and there are major tectonic disturbances with four major cycles of depositions and erosions (diastrophism) during last one billion years [10]. The basement is Vindhyan super group of the Kaimur series followed by erosion; then Rajpur and Mohanpur formations occur and followed by erosion. Next formation is Hanumannagar which is bare formation between two erosion unconformities [10]. The study area covers several districts: Bhojpur, Rohtas, Patna, Jahanabad, Aurangabad, Ballia and Chapra of the Uttar Pradesh. In this paper, we investigated two linea- ments alongside of the river Ganga in northwest parts of  M. BANERJEE ET AL. Copyright © 2010 SciRes. JGIS 221 the area in Ballia district, which may play a very vital role in groundwater monitoring in the area. A detailed analysis of geomorphology and geology of the Lower Son valley on the basis of photo-interpretation techniques for surface features, drainage pattern and density, and drainage texture has been carried out to determine allu- vial type, permeability, tributary, etc. As there have been wide varieties of material exogeny with varying drainage patterns, textures and densities, the materials are found to have different hydrologic properties. The Darcy velocity analysis enab- led to find the flow pattern of ground wa- ter. Thus, we find that the water potentiality of the entire Lower Son valley is very high, and there is a very good prospect for its exploitation in future. 2. Location of the Study Area 2.1. Imagery of the Study Area The satellite imagery used is IRS LISS 1 B1 (index no. 62PO22-R50), taken on 29th January 1991 at 10:01:24 AM. The scale of the imagery is 1:250000 in the band -1 (Figure 1). 2.2. Coverage of the Study Area The area under investigation is about 13000 km2 cover- ing 44 administrative blocks and located between 24.5°- 26° N latitude and 83.5°-84.8° E longitude (Figure 2). The area of interest is covered by the Survey of India toposheet No. 72 C & D (1:250000) and extends over se- ven districts, namely Bhojpur, Rohtas, Patna, Jahanabad, Aurangabad, Ballia and Chapra. 2.3. Climate The basin lies in a zone of average rainfall of 1250 mm. About 88% of the annual precipitation occur during the four monsoon months June-September, of which 60% is recorded in only two months, July and August. During summer, the rainfall is about 3% of the total precipitation with the air temperature as high as 45°C and the relative humidity of the basin is 38%. In winter, the minimum air temperature is 6°C and the relative humidity is 63%. The daily mean wind speed in December is 4.2 km/hr, which rises to 8.5 km/hr in May. The average annual wind sp- eed is 6.5 km/hr. 3. Methodology In the present study, direct visual analysis has been carri- ed out from maps of the spatial arrangement, combinati- ons, relationships, and changes in phenomena for the in- terpretation of geologic features, such as lineaments, all- uvial types, land use pattern, geomorphologic features, etc. The use of direct and indirect indicators has been ma- de where they were necessary. Some measurements on the imagery have also been made related to coordinates, distances, lengths, elevations, areas, and other quantita- tive characteristics of objects. Mapinfo has been used for the preparation of maps, particularly for drainage analy- sis, and to show the flow direction of ground water. The flow direction of ground water has been determined from Darcy velocity analysis. 4. Geology of the Area The entire study area comprises of alluvium which is a part of Ganga basin [10]. The quality of soils indicates that the alluvium is fluvial and lacustrine origin of the Quaternary period. In Bihar, the Vindhyan occurs mainly in south Rohtas as scarps and plateaus [11]. Geological formation of the Bhojpur district forms a part of the axial belt of the Indo-Gangetic plain consisting of newer and older alluvia. The alluvial sediments consist of clay, fine to coarse-grained sand, kankar, gravel and have a maxi- mum thickness along the present course of the Ganga. The micaceous sands brought and deposited by the river Ganga is gray in colour and rich in magnesium minerals (such as serpentine, olivine, talc) and occupy topmost ho- rizon along the river course for a few kilometers. This la- yer belongs to the newer alluvium consisting of clay, kankar, fine to coarse grained sand, gravel and pebble at depth. The lower Son Valley is formed by the torrent of the Vindhyan. Therefore, the geological features, drain- age patterns and their frequencies of occurrence in the Vindhyan region were mainly responsible for the hy- dro-geological developments of the area [1]. 4.1. Delineation of Lineaments In photo-geology, the lineaments are defined as linear al- ignment of features with different shades on photos and imageries. These could be clearly demarcated on the sat- ellite imagery IRS-LISS-1-B1 as a distinct tonal varia- tion in gray shades along two parallel lines in the north- ern fringe of the lower Son valley in the Bhojpur district along lines A-A and B-B as shown in Figures 1 and 2. Two new lineaments have been inferred on the basis of variation in gray tones through soil characteristics, vege- tations and drainage patterns in the north-west corner of the area in the Ballia district along lines C-C and D-D (Figures 1 and 2). These are clearly demarcated in the imagery (Figure 1) as the soil characteristics, vegetation- ns and drainage patterns are quite different on either sid- es of the lines C-C and D-D. However, the presence of  M. BANERJEE ET AL. Copyright © 2010 SciRes. JGIS 222 these new lineaments must be examined by other techni- ques in the future. 5. Geomorphological Analysis The photo-geo-morphological features of the area around the lower Son valley are highlighted in the following pa- ragraphs. These are related to topography and drainage aspects. 5.1. Topography The Son valley mainly consists of alluvial deposits of the rivers Son and Ganga. Northern part of the lower Son va- lley is composed of the finer alluvium deposits derived from the river Ganga. It is clear that the fan shaped lower Figure 1. Satellite imagery of the Lower Son valley showing major rivers and other surface features. Two lineaments deline- ated by GSI (A-A and B-B) and two lineaments mapped in the present study (C-C and D-D) are also indicated. 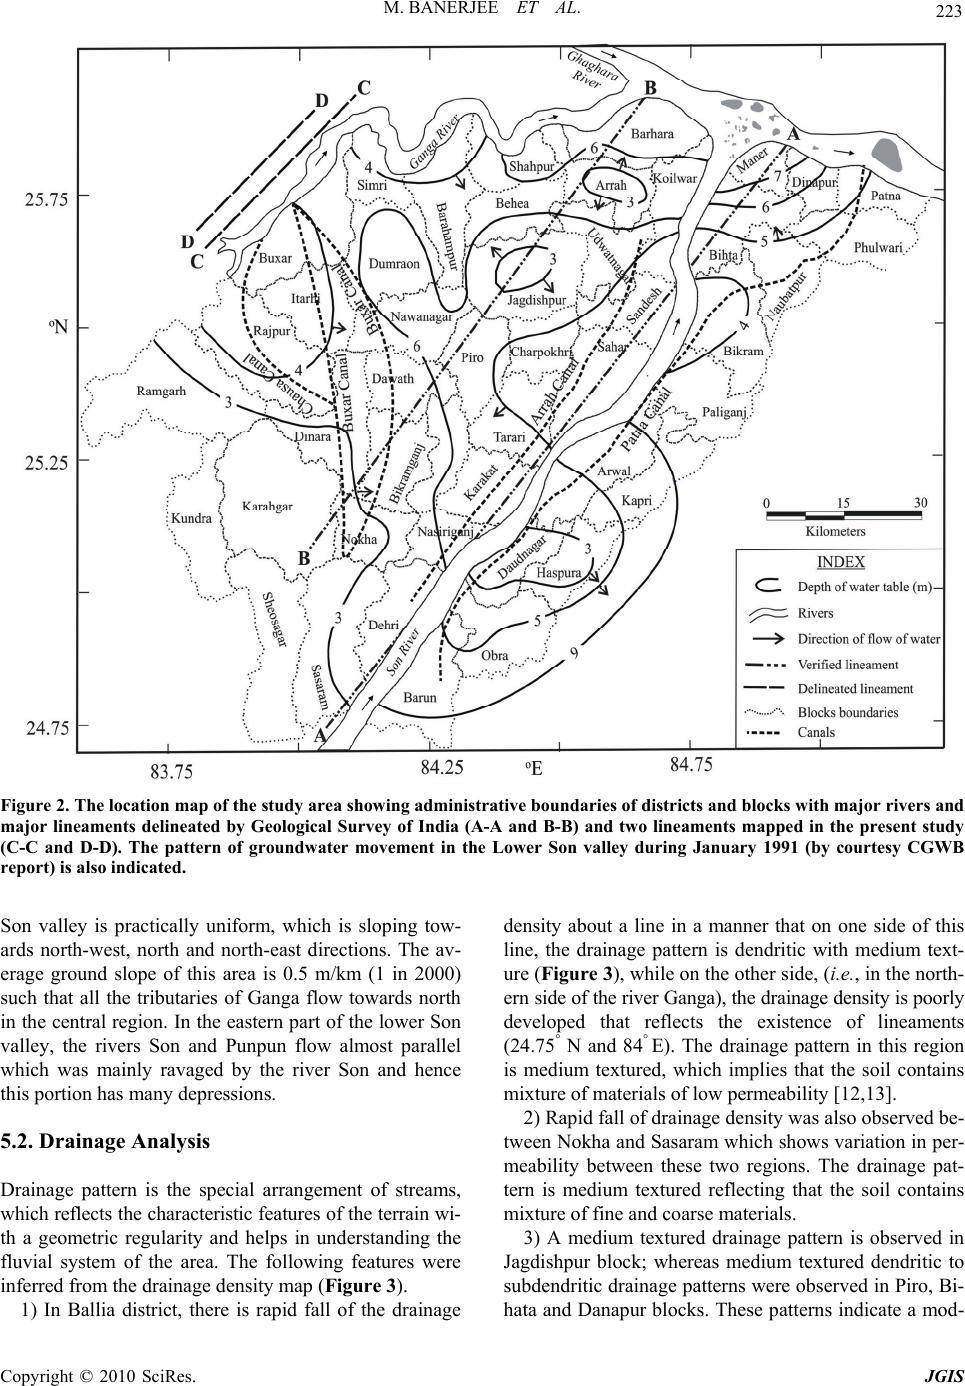 M. BANERJEE ET AL. Copyright © 2010 SciRes. JGIS 223 Figure 2. The location map of the study area showing administrative boundaries of districts and blocks with major rivers and major lineaments delineated by Geological Survey of India (A-A and B-B) and two lineaments mapped in the present study (C-C and D-D). The pattern of groundwater movement in the Lower Son valley during January 1991 (by courtesy CGWB report) is also indicated. Son valley is practically uniform, which is sloping tow- ards north-west, north and north-east directions. The av- erage ground slope of this area is 0.5 m/km (1 in 2000) such that all the tributaries of Ganga flow towards north in the central region. In the eastern part of the lower Son valley, the rivers Son and Punpun flow almost parallel which was mainly ravaged by the river Son and hence this portion has many depressions. 5.2. Drainage Analysis Drainage pattern is the special arrangement of streams, which reflects the characteristic features of the terrain wi- th a geometric regularity and helps in understanding the fluvial system of the area. The following features were inferred from the drainage density map (Figure 3). 1) In Ballia district, there is rapid fall of the drainage density about a line in a manner that on one side of this line, the drainage pattern is dendritic with medium text- ure (Figure 3), while on the other side, (i.e., in the north- ern side of the river Ganga), the drainage density is poorly developed that reflects the existence of lineaments (24.75° N and 84° E). The drainage pattern in this region is medium textured, which implies that the soil contains mixture of materials of low permeability [12,13]. 2) Rapid fall of drainage density was also observed be- tween Nokha and Sasaram which shows variation in per- meability between these two regions. The drainage pat- tern is medium textured reflecting that the soil contains mixture of fine and coarse materials. 3) A medium textured drainage pattern is observed in Jagdishpur block; whereas medium textured dendritic to subdendritic drainage patterns were observed in Piro, Bi- hata and Danapur blocks. These patterns indicate a mod- 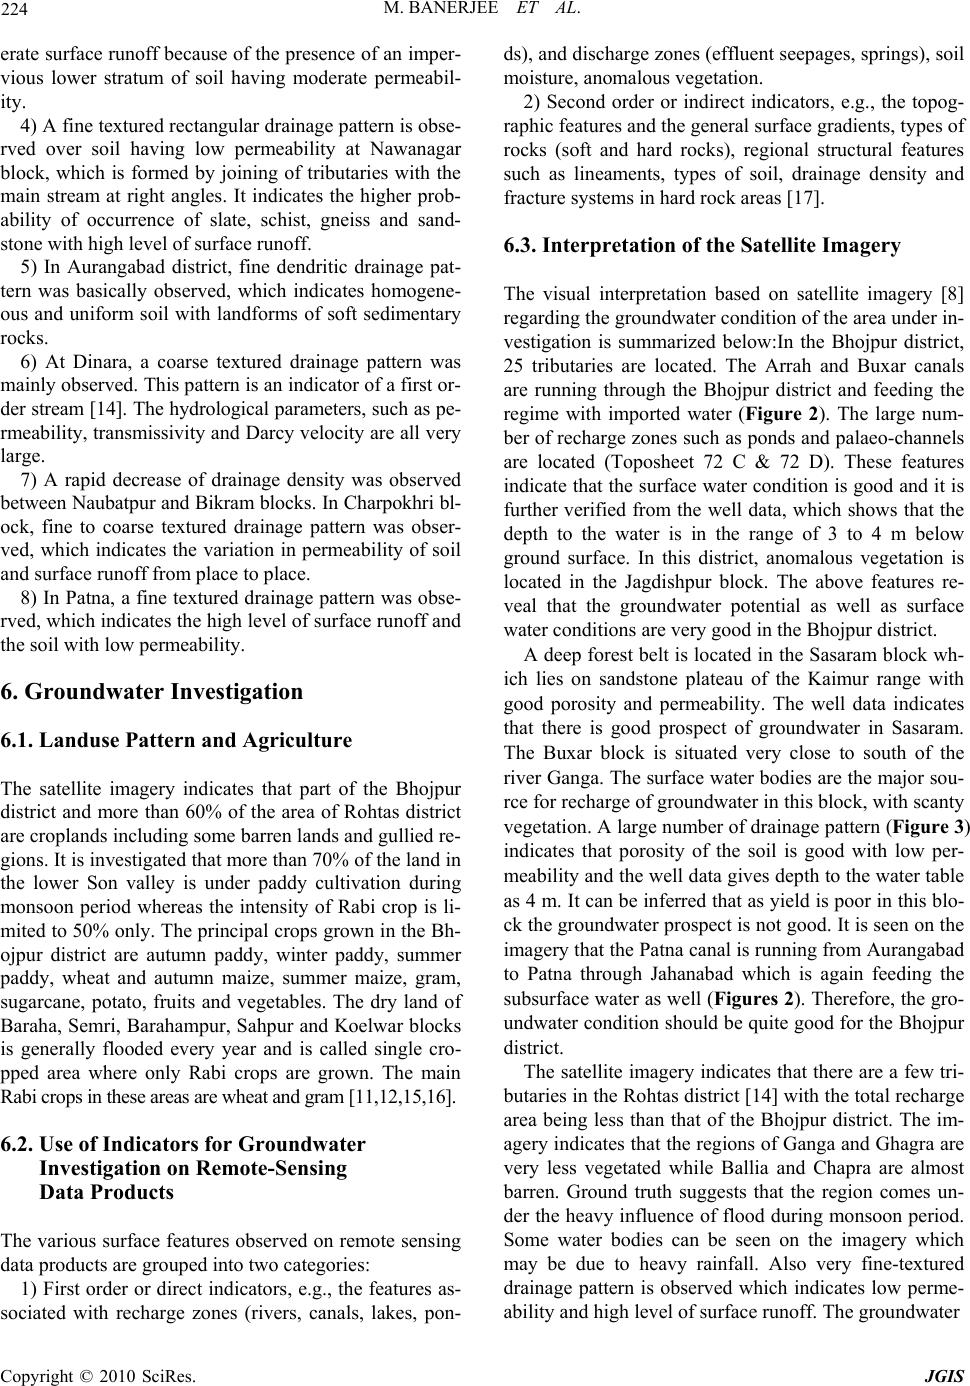 M. BANERJEE ET AL. Copyright © 2010 SciRes. JGIS 224 erate surface runoff because of the presence of an imper- vious lower stratum of soil having moderate permeabil- ity. 4) A fine textured rectangular drainage pattern is obse- rved over soil having low permeability at Nawanagar block, which is formed by joining of tributaries with the main stream at right angles. It indicates the higher prob- ability of occurrence of slate, schist, gneiss and sand- stone with high level of surface runoff. 5) In Aurangabad district, fine dendritic drainage pat- tern was basically observed, which indicates homogene- ous and uniform soil with landforms of soft sedimentary rocks. 6) At Dinara, a coarse textured drainage pattern was mainly observed. This pattern is an indicator of a first or- der stream [14]. The hydrological parameters, such as pe- rmeability, transmissivity and Darcy velocity are all very large. 7) A rapid decrease of drainage density was observed between Naubatpur and Bikram blocks. In Charpokhri bl- ock, fine to coarse textured drainage pattern was obser- ved, which indicates the variation in permeability of soil and surface runoff from place to place. 8) In Patna, a fine textured drainage pattern was obse- rved, which indicates the high level of surface runoff and the soil with low permeability. 6. Groundwater Investigation 6.1. Landuse Pattern and Agriculture The satellite imagery indicates that part of the Bhojpur district and more than 60% of the area of Rohtas district are croplands including some barren lands and gullied re- gions. It is investigated that more than 70% of the land in the lower Son valley is under paddy cultivation during monsoon period whereas the intensity of Rabi crop is li- mited to 50% only. The principal crops grown in the Bh- ojpur district are autumn paddy, winter paddy, summer paddy, wheat and autumn maize, summer maize, gram, sugarcane, potato, fruits and vegetables. The dry land of Baraha, Semri, Barahampur, Sahpur and Koelwar blocks is generally flooded every year and is called single cro- pped area where only Rabi crops are grown. The main Rabi crops in these areas are wheat and gram [11,12,15,16]. 6.2. Use of Indicators for Groundwater Investigation on Remote-Sensing Data Products The various surface features observed on remote sensing data products are grouped into two categories: 1) First order or direct indicators, e.g., the features as- sociated with recharge zones (rivers, canals, lakes, pon- ds), and discharge zones (effluent seepages, springs), soil moisture, anomalous vegetation. 2) Second order or indirect indicators, e.g., the topog- raphic features and the general surface gradients, types of rocks (soft and hard rocks), regional structural features such as lineaments, types of soil, drainage density and fracture systems in hard rock areas [17]. 6.3. Interpretation of the Satellite Imagery The visual interpretation based on satellite imagery [8] regarding the groundwater condition of the area under in- vestigation is summarized below:In the Bhojpur district, 25 tributaries are located. The Arrah and Buxar canals are running through the Bhojpur district and feeding the regime with imported water (Figure 2). The large num- ber of recharge zones such as ponds and palaeo-channels are located (Toposheet 72 C & 72 D). These features indicate that the surface water condition is good and it is further verified from the well data, which shows that the depth to the water is in the range of 3 to 4 m below ground surface. In this district, anomalous vegetation is located in the Jagdishpur block. The above features re- veal that the groundwater potential as well as surface water conditions are very good in the Bhojpur district. A deep forest belt is located in the Sasaram block wh- ich lies on sandstone plateau of the Kaimur range with good porosity and permeability. The well data indicates that there is good prospect of groundwater in Sasaram. The Buxar block is situated very close to south of the river Ganga. The surface water bodies are the major sou- rce for recharge of groundwater in this block, with scanty vegetation. A large number of drainage pattern (Figure 3) indicates that porosity of the soil is good with low per- meability and the well data gives depth to the water table as 4 m. It can be inferred that as yield is poor in this blo- ck the groundwater prospect is not good. It is seen on the imagery that the Patna canal is running from Aurangabad to Patna through Jahanabad which is again feeding the subsurface water as well (Figures 2). Therefore, the gro- undwater condition should be quite good for the Bhojpur district. The satellite imagery indicates that there are a few tri- butaries in the Rohtas district [14] with the total recharge area being less than that of the Bhojpur district. The im- agery indicates that the regions of Ganga and Ghagra are very less vegetated while Ballia and Chapra are almost barren. Ground truth suggests that the region comes un- der the heavy influence of flood during monsoon period. Some water bodies can be seen on the imagery which may be due to heavy rainfall. Also very fine-textured drainage pattern is observed which indicates low perme- ability and high level of surface runoff. The groundwater 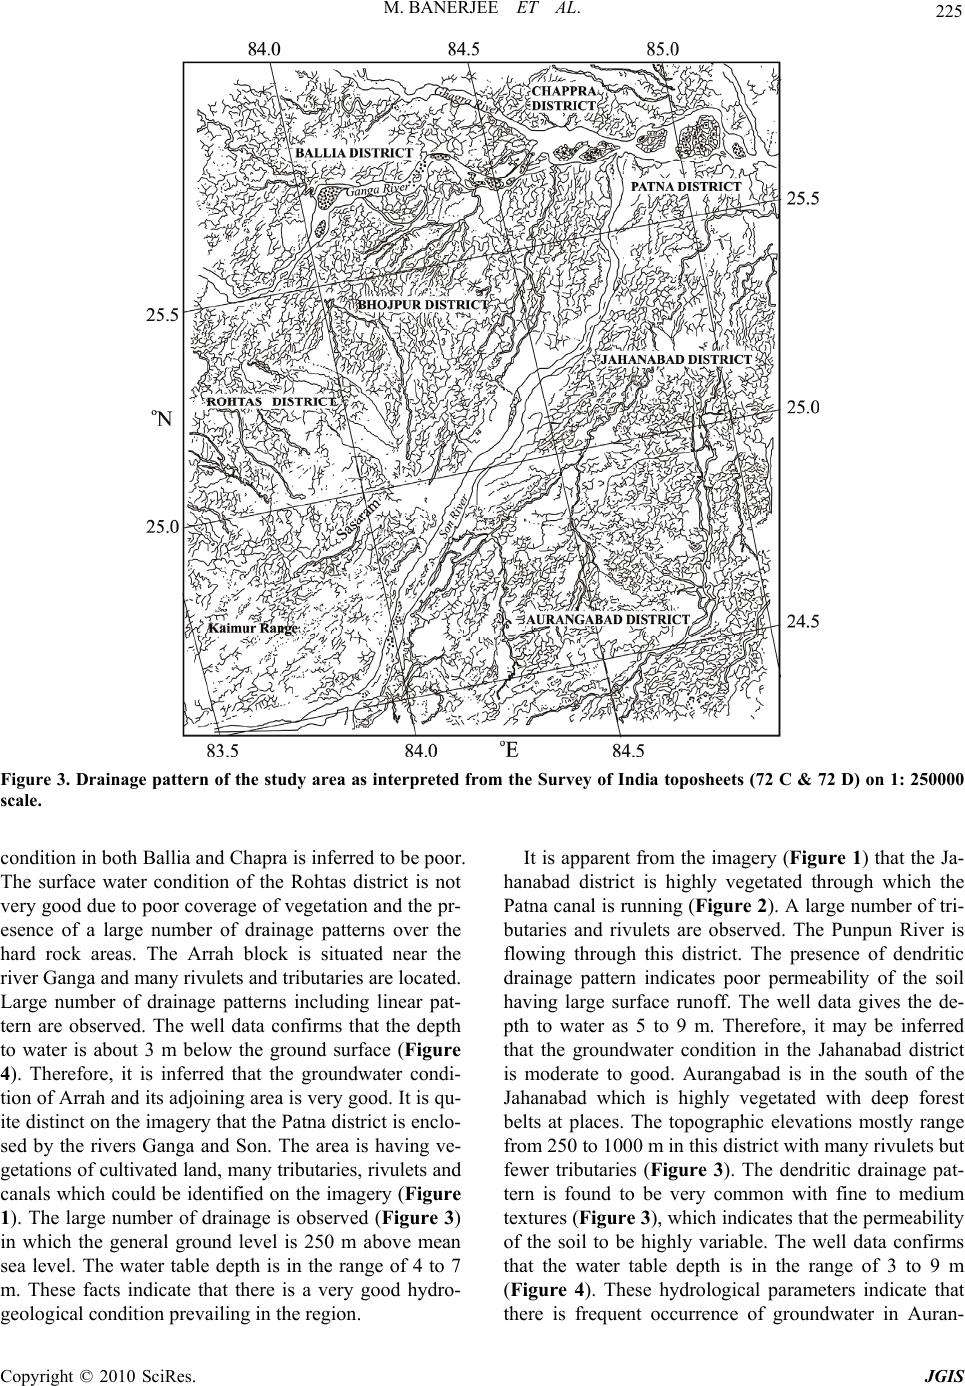 M. BANERJEE ET AL. Copyright © 2010 SciRes. JGIS 225 Figure 3. Drainage pattern of the study area as interpreted from the Survey of India toposheets (72 C & 72 D) on 1: 250000 scale. condition in both Ballia and Chapra is inferred to be poor. The surface water condition of the Rohtas district is not very good due to poor coverage of vegetation and the pr- esence of a large number of drainage patterns over the hard rock areas. The Arrah block is situated near the river Ganga and many rivulets and tributaries are located. Large number of drainage patterns including linear pat- tern are observed. The well data confirms that the depth to water is about 3 m below the ground surface (Figure 4). Therefore, it is inferred that the groundwater condi- tion of Arrah and its adjoining area is very good. It is qu- ite distinct on the imagery that the Patna district is enclo- sed by the rivers Ganga and Son. The area is having ve- getations of cultivated land, many tributaries, rivulets and canals which could be identified on the imagery (Figure 1). The large number of drainage is observed (Figure 3) in which the general ground level is 250 m above mean sea level. The water table depth is in the range of 4 to 7 m. These facts indicate that there is a very good hydro- geological condition prevailing in the region. It is apparent from the imagery (Figure 1) that the Ja- hanabad district is highly vegetated through which the Patna canal is running (Figure 2). A large number of tri- butaries and rivulets are observed. The Punpun River is flowing through this district. The presence of dendritic drainage pattern indicates poor permeability of the soil having large surface runoff. The well data gives the de- pth to water as 5 to 9 m. Therefore, it may be inferred that the groundwater condition in the Jahanabad district is moderate to good. Aurangabad is in the south of the Jahanabad which is highly vegetated with deep forest belts at places. The topographic elevations mostly range from 250 to 1000 m in this district with many rivulets but fewer tributaries (Figure 3). The dendritic drainage pat- tern is found to be very common with fine to medium textures (Figure 3), which indicates that the permeability of the soil to be highly variable. The well data confirms that the water table depth is in the range of 3 to 9 m (Figure 4). These hydrological parameters indicate that there is frequent occurrence of groundwater in Auran- 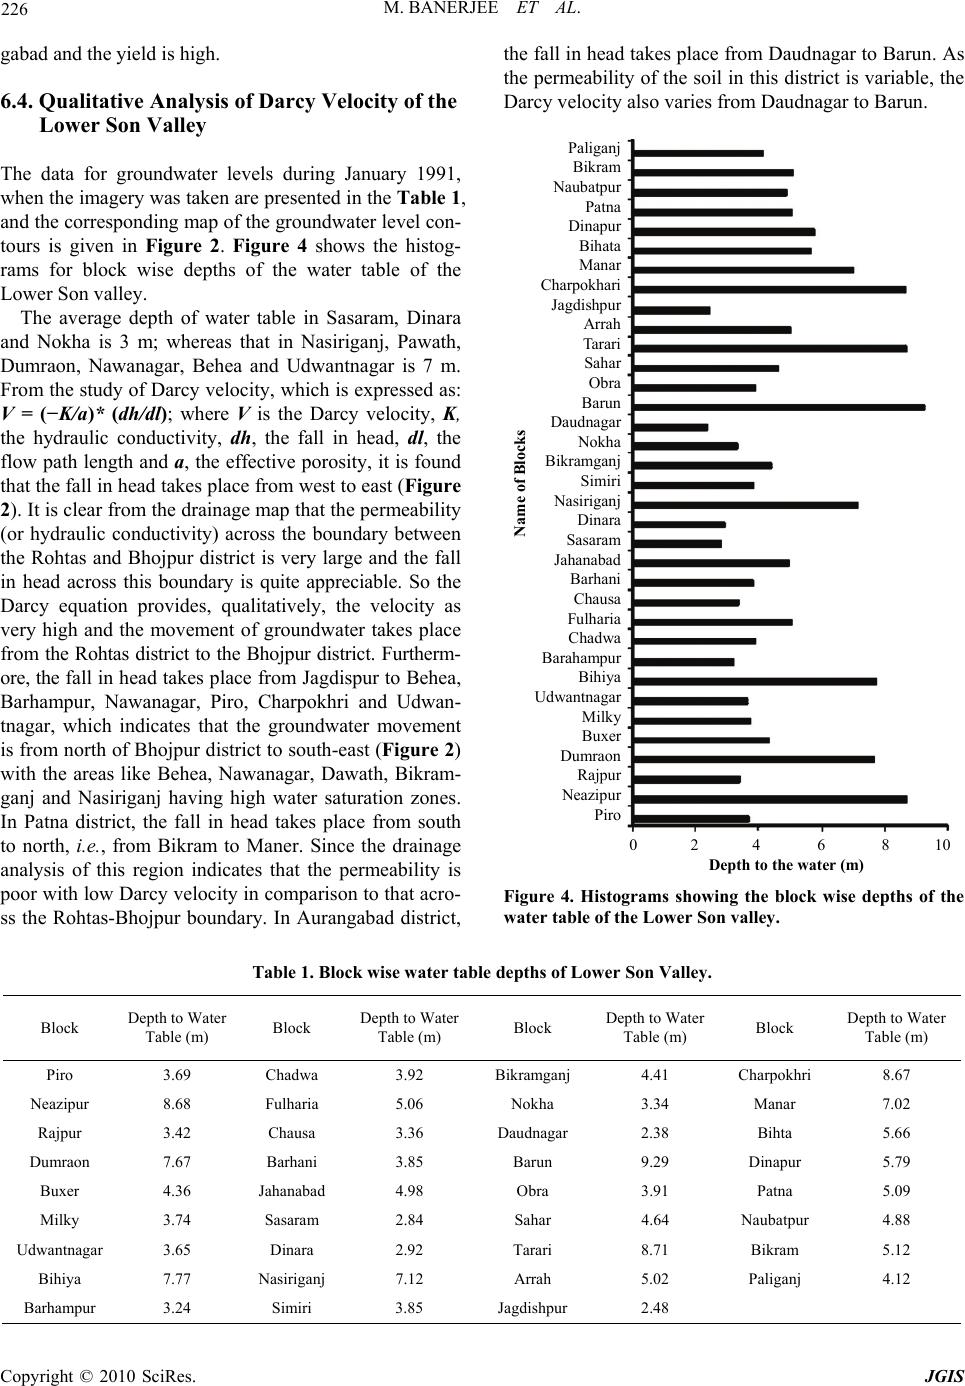 M. BANERJEE ET AL. Copyright © 2010 SciRes. JGIS 226 gabad and the yield is high. 6.4. Qualitative Analysis of Darcy Velocity of the Lower Son Valley The data for groundwater levels during January 1991, when the imagery was taken are presented in the Table 1, and the corresponding map of the groundwater level con- tours is given in Figure 2. Figure 4 shows the histog- rams for block wise depths of the water table of the Lower Son valley. The average depth of water table in Sasaram, Dinara and Nokha is 3 m; whereas that in Nasiriganj, Pawath, Dumraon, Nawanagar, Behea and Udwantnagar is 7 m. From the study of Darcy velocity, which is expressed as: V = (−K/a)* (dh/dl); where V is the Darcy velocity, K, the hydraulic conductivity, dh, the fall in head, dl, the flow path length and a, the effective porosity, it is found that the fall in head takes place from west to east (Figure 2). It is clear from the drainage map that the permeability (or hydraulic conductivity) across the boundary between the Rohtas and Bhojpur district is very large and the fall in head across this boundary is quite appreciable. So the Darcy equation provides, qualitatively, the velocity as very high and the movement of groundwater takes place from the Rohtas district to the Bhojpur district. Furtherm- ore, the fall in head takes place from Jagdispur to Behea, Barhampur, Nawanagar, Piro, Charpokhri and Udwan- tnagar, which indicates that the groundwater movement is from north of Bhojpur district to south-east (Figure 2) with the areas like Behea, Nawanagar, Dawath, Bikram- ganj and Nasiriganj having high water saturation zones. In Patna district, the fall in head takes place from south to north, i.e., from Bikram to Maner. Since the drainage analysis of this region indicates that the permeability is poor with low Darcy velocity in comparison to that acro- ss the Rohtas-Bhojpur boundary. In Aurangabad district, the fall in head takes place from Daudnagar to Barun. As the permeability of the soil in this district is variable, the Darcy velocity also varies from Daudnagar to Barun. Figure 4. Histograms showing the block wise depths of the water table of the Lower Son valley. Table 1. Block wise water table depths of Lower Son Valley. Block Depth to Water Table (m) Block Depth to Water Table (m) Block Depth to Water Table (m) Block Depth to Water Table (m) Piro 3.69 Chadwa 3.92 Bikramganj 4.41 Charpokhri 8.67 Neazipur 8.68 Fulharia 5.06 Nokha 3.34 Manar 7.02 Rajpur 3.42 Chausa 3.36 Daudnagar 2.38 Bihta 5.66 Dumraon 7.67 Barhani 3.85 Barun 9.29 Dinapur 5.79 Buxer 4.36 Jahanabad 4.98 Obra 3.91 Patna 5.09 Milky 3.74 Sasaram 2.84 Sahar 4.64 Naubatpur 4.88 Udwantnagar 3.65 Dinara 2.92 Tarari 8.71 Bikram 5.12 Bihiya 7.77 Nasiriganj 7.12 Arrah 5.02 Paliganj 4.12 Barhampur 3.24 Simiri 3.85 Jagdishpur 2.48 De p th to the water ( m ) 0 2 4 6 8 10 Name of Blocks Paliga nj Bikram Nauba tpur Patna Dinapu r Bihata Manar Charpokhari Jagd ishp u r Ar rah Tara ri Sahar Obra Barun Daudna ga r Nokh a Bikramganj Simiri Nasiri ganj Dina ra Sasaram Jahana ba d Barhani Chausa Ful haria Chadwa Barahampur Bihiya Udwantnagar Milky Buxer Dumraon Rajpur Neazip u r Piro  M. BANERJEE ET AL. Copyright © 2010 SciRes. JGIS 227 7. Conclusions Advantages of remote sensing technique and its ability to give multi-spectral, multi-spatial, multi-temporal data he- lp a great deal in accelerating and expanding its bounda- ries for the application in the water resources field. The greatest advantage of using remote sensing data for hyd- rological investigation and monitoring is the ability to ge- nerate information on spatial and temporal domain which is crucial for successful analysis, prediction and valida- tion. The attempt to study the satellite imagery IRS-LISS- 1-B1 (index no. 62PO22-R50) helped in locating the ex- isting two parallel lineaments trending north-east in the Bhojpur district. Two new lineaments were identified in the Ballia district. The analyses of drainage, vegetation and geomorphology supported by groundwater indicators helped to infer that the water potentiality of the entire Son valley is high which corroborate well with the monitor- ing results of groundwater by [15]. The analysis of Darcy velocity has provided the direction and the nature of mo- vement of ground water which may help to put wells at desired location. Among all the districts of the Lower Son valley, the Bhojpur district is having the highest water bearing potentiality. 8. Acknowledgements We express our indebtness to Prof. V. P. Singh of the Department of Geophysics, and Prof. K. N. P. Raju of Department of Geography, Banaras Hindu University, Varanasi for extending facilities in their respective de- partments. One of the Authors (D. Shanker) is thankful to Prof & Head Department of Earthquake Engineering, IIT Roorkee for providing excellent internet facilities and necessary assistance. 9. References [1] F. Ahmad, “Geology of the Vindhyan System in the East- ern Part of Son Valley,” Records GSI, Vol. 96, No. 2, 1971, pp. 1-41. [2] S. A. Drury and S. M. Berhe, “Accretion Tectonics in Northern Eritrea Revealed by Remotely Sensed Im- agery,” Geological Magazine, Vol. 130, No. 2, 1993, pp. 170-190. [3] W. Ghebreab, “An Outline of Major Pan-African Li- thologic Assemblages and Shear Zones in Eritrea: Impli- cations for Mineral Exploration,” Australian Financial Review, Vol. 3, No. 3-4, 1996, pp. 355-366. [4] M. J. McFarlane, “Groundwater Movement and Water Chemistry Associated with Weathering Profiles of the African Surface in Malawi,” In: E. P. Wright and W. G. Burgess, Eds., Hydrogeology of Crystalline Basement Aquifers in Africa, Geological Society, Special Publica- tions, London, Vol. 66, 1992, pp. 131-154. [5] M. G. S. D. Nilantha and V. Hari Prassad, “Groundwater Recharge Estimation Using Remote Sensing and Geogr- aphic Information System,” Sri Lankan Journal of Geo- Informatics, Vol. 1, 2004, pp. 44-55. [6] A. K. Saraf and P. R. Choudhury, “Integrated Remote Sensing and GIS for Groundwater Exploration and Iden- tification of Artificial Recharge Sites,” International Journal of Remote Sensing, Vol. 19, No. 10, 1998, pp. 1825-1841. [7] S. Solomon and F. Quiel, “Integration of Remote Sensing and GIS for Groundwater Assessment in Eritrea,” In: T. Benes, Ed., Proceedings of the European Association of Remote Sensing Laboratories Conference, Ghent, 2003, pp. 633-640. [8] S. Solomon, “Groundwater Study Using Remote Sensing and Geographic Information Systems (GIS) in the Central Highlands of Eritrea,” Journal of Hydrogeology, Vol. 14, No. 6, 2006, pp. 1029-1041. [9] R. Taylor and K. Howard, “A Tectono-Geomorphic Mo- del of the Hydrogeology of Deeply Weathered Crystalline Rock: Evidence from Uganda,” Hydrogeology Journal, Vol. 8, No. 3, 2000, pp. 279-294. [10] G. S. I., “Report: The Miscellaneous Publication No. 63,” 1999. [11] WAPCOS, “Son Canal Modernization Project (Feasibil- ity Report),” Vol. 1 & 2, 1988. [12] D. Bhattacharya, M.Sc. Dissertation, Banaras Hindu University, Varanasi, 1999, pp. 1-67. [13] V. C. Leuder and C. F. Miller, “Photogeology,” McGraw- Hill, London, New York, 1961. [14] R. P. Singh, “Groundwater Management Strategies, Rohtas District, Bihar, India,” Bulletin of Engineering Geology and the Environment, Vol. 63, No. 3, 2004, pp. 247-253. [15] CGWB, “The Technical Report: Groundwater Statistics and Monitoring of Groundwater in Bihar,” Series D, Vol. 96, No. 48, 1986. [16] S. K. Nag, “Morphometric Analysis Using Remote Sens- ing Techniques in the Chakh Sub-Basin, Purulia District, West Bengal,” Journal of the Indian Society of Remote Sensing, Vol. 26, No. 1-2, 1998, pp. 69-76. [17] R. P. Gupta, “Remote Sensing in Geology,” Spring- er-Verlag, New York, 1991, pp. 245-289. |