Paper Menu >>
Journal Menu >>
 J. Biomedical Science and Engineering, 2010, 3, 986-1000 JBiSE doi:10.4236/jbise.2010.310129 Published Online October 2010 (http://www.SciRP.org/journal/jbise/). Published Online October 20 10 in SciRes. http://www.scirp.org/journal/jbise Extending cell cycle synchrony and deconvolving population effects in budding yeast through an analysis of volume growth with a structured Leslie model Chris C. Stowers1, Erik M. Boczko2 1Bioprocess R&D Division, Dow AgroSciences LLC, Indianapolis, USA; 2Department of Biomedical Informatics, Vanderbilt University, Nashville, USA. Email: erik.boczko@vanderbilt.edu Received 22 June 2010; 12 July 2010; 26 July 2010. ABSTRACT Budding yeast are a fundamental organism at the center of systems biology research. Understanding the physiology and kinetics of their growth and di- vision is fundamental to the design of models of gene regulation and the interpretation of experi- mental measurements. We have developed a Leslie model with structured volume and age classes to understand population growth and cell cycle syn- chrony in budding yeast. The model exhibits broad agreement with a variety of experimental data. The model is easily annotated with volume milestones and cell cycle phases and at least three distinct goals are realizable: 1) One can investigate how any single cell property manifests itself at the popula- tion level. 2) One can deconvolve observed popula- tion averages into individual cell signals structured by volume and age. 3) One can investigate control- lability of the population dynamics. We focus on the latter question. Our model was initially designed to answer the question: Can continuous volume filtra- tion extend synchrony? To date, most general ex- perimental methods can produce an initially syn- chronous population whose synchrony decays rap- idly over three or four cell cycles. Our model pre- dicts that continuous volume filtration can extend this maintenance of synchrony by an order of mag- nitude. Our data inform the development of simple fluidic devices to extend synchrony in continuous culture at all scales from nanophysiometers to bio- reactors. Keywords: Quantitative Biology, Systems Biology, Volume Filtration, Cell Cycle 1. INTRODUCTION Unlike the simple volume symmetric division of E. Coli [1], an initially synchronous culture of budding yeast become asynchronous and stationary very rapidly. While stable, synchronous, autonomous oscillations have been observed and are of enormous interest, they do not occur generically and are far from understood [2-5]. Popu- lation synchrony is often monitored by tracking the percent of a culture that is budded as a function of time. The physiological factors influencing the rapid decay of cell cycle synchrony in budding yeast were investigated three decades ago. It was found that new daughter cells take longer to traverse the mitotic cycle than their mothers because of a volume asymmetry at division. That is, daughter cells at the time of division, are smaller in volume than their mothers. Furthermore as mothers age they give rise to progressively smaller daughters on average [6], compounding the problem. Currently there is renewed interest in the physiology of replication in relation to aging and the asymmetric partitioning of biomolecules between mother and daughter [1,7,8]. As yeast are now routinely the subject of expression analysis, synchronous growth and division has important and largely unexplored implications for attaching mean- ing to commonly measured population signals [5,9]. Our interest in developing a model for the volume growth and population synchrony of budding yeast stems from our previous work on an ostensibly simple gene regulatory circuit involved in nitrogen catabolite repression (NCR). An analysis of a minimal model of the NCR-circuit indicates that the components of the system oscillate in phase with the cell cycle [10,11]. In order to understand how a cellular oscillation is observable at the population level, and further, how one could engineer an experiment to convincingly demonstrate periodic oscillation at the cellular level from a population measurement, we under- took the development of a structured population model of yeast growth and division to be described. The central observations of this study are theoretical  C. Stowers et al. / J. Biomedical Science and Engineering 3 (2010) 986-1000 987 Copyright © 2010 SciRes. JBiSE in nature and can be summarized as follows. Theore- tically, volume symmetric division leads to persistent synchrony. Each strain of budding yeast has a charac- teristic mean daughter—mother division volume asym- metry, some more and some less pronounced. Paren- thetically, this asymmetry is a function of growth rate and has been shown to be inversely proportional to it [12]. As the asymmetry between mother and daughter division volume increases, synchrony decays in a predic- table way. For a given strain of yeast, growing exponen- tially in a bioreactor, our model predicts that continuously filtering out the smallest and largest cells extends the synchrony of the system. Our model predicts that with judicious choices of filtration cutoff volumes, synchrony can be extended by an order of magnitude. Given strain specific measurements our model can be used to predict design parameters such as the filtration cutoff volumes. The filtration process can be conceived of, in a way that we shall make precise, as a means to restore partial symmetry. While it is true that continuous filtration will skew the population of cells under observation, it can be accomplished without inducing a generic stress response within the yeast. This trade off may for certain experi- ments be useful. The cell cycle synchrony of a population of yeast, its persistence, decay and control are essentially an ontolo- gically dynamical systems phenomena. There is a long and fruitful history associated with the modeling of population growth. Budding yeast and their mitotic cell cycle continue to be an interesting and important area of mathematical cell biology. We make no formal attempt to review this enormous literature but restrict our attention to those models of which we are aware have dealt with volume growth and the effects of a mixed population of cells growing with potentially different growth rates. The mixed mother-daughter model [13] was developed based on the mathematical results of branching processes [14,15] to explain the variations in the 1 G phase of the cell cycle. This model was used to derive a stationary distribution of mothers and daughters as a function of the cell cycle. A model developed in [16] and expanded on by [12] considered the properties of an asynchronous population growing exponentially. A central result of their pioneering work was to derive a formula for the replicative age distribution at stationarity that depends on only two parameters, the culture growth rate and the parental doubling time. The formulas and analysis derived by Lord and Wheals have continued to underpin current models of cell cycle dynamics and division [17, see for instance the reset rule at the bottom of Table 1]. An admitted limitation of their work however is that it explicitly assumes that the growth rates among the age classes are the same. Their paper presented compelling evidence to support this claim. There is also a wealth of evidence to the contrary [6,18], and evidence that older mothers grow larger with each division. Age structured models that take into account this finer but important level of detail were proposed and utilized to analyze population signals of a critical protein [19], in search of the still elusive link between size control and division [20]. Population balance models that extend that of Hartwell and Unger have been proposed to explore the links between metabolism and the cell cycle during asynchronous as well as synchronous growth. These models are extensively reviewed in [2]. Recently, sophisticated population balance models have been cons- tructed that take into account the mass changes that accompany growth and division and that can vary among distinct age classes [21]. The Leslie model that we present is a discrete version of the continuous population balance model, although our focus is explicitly on volume as opposed to mass. The obvious advantage of this class of model is that it naturally allows one to describe any variation among age classes since they are explicitly represented. An important reason for utilizing and exploring a volume and age structured model is that it captures the effects that influence synchrony and, because it is a dynamical systems model, it can directly be used to examine the dynamical phenomena of synchrony and the effects of filtration as a control mechanism. That is the goal of this paper. There is a long history of elutriation as a means of preparing and examining yeast sub-populations in the biological literature [22]. There is also a long history in the chemical engineering literature of filtration and sedimentation as a means to separate and control the growth of micro-organisms [23-25]. These two literatures are now converging as systems biology has hit its stride and seeks to leverage every available technology to Table 1. A glossary of milestones and their meaning. Symbol Definition k Denotes replicative age. k V The minimal volume of yeast cell of age k. k V The maximal volume of yeast cell of age k. k The exponential growth rate of a yeast cell of age k. k--MDV The expected volume at which a yeast cell of age k will divide. k--MEDV The expected volume of a daughter born from a division in age class k. k--MEPV The expected volume of a mother immediately after a division event in age class k. k--BE The expected volume at which a cell of age k begins to bud. 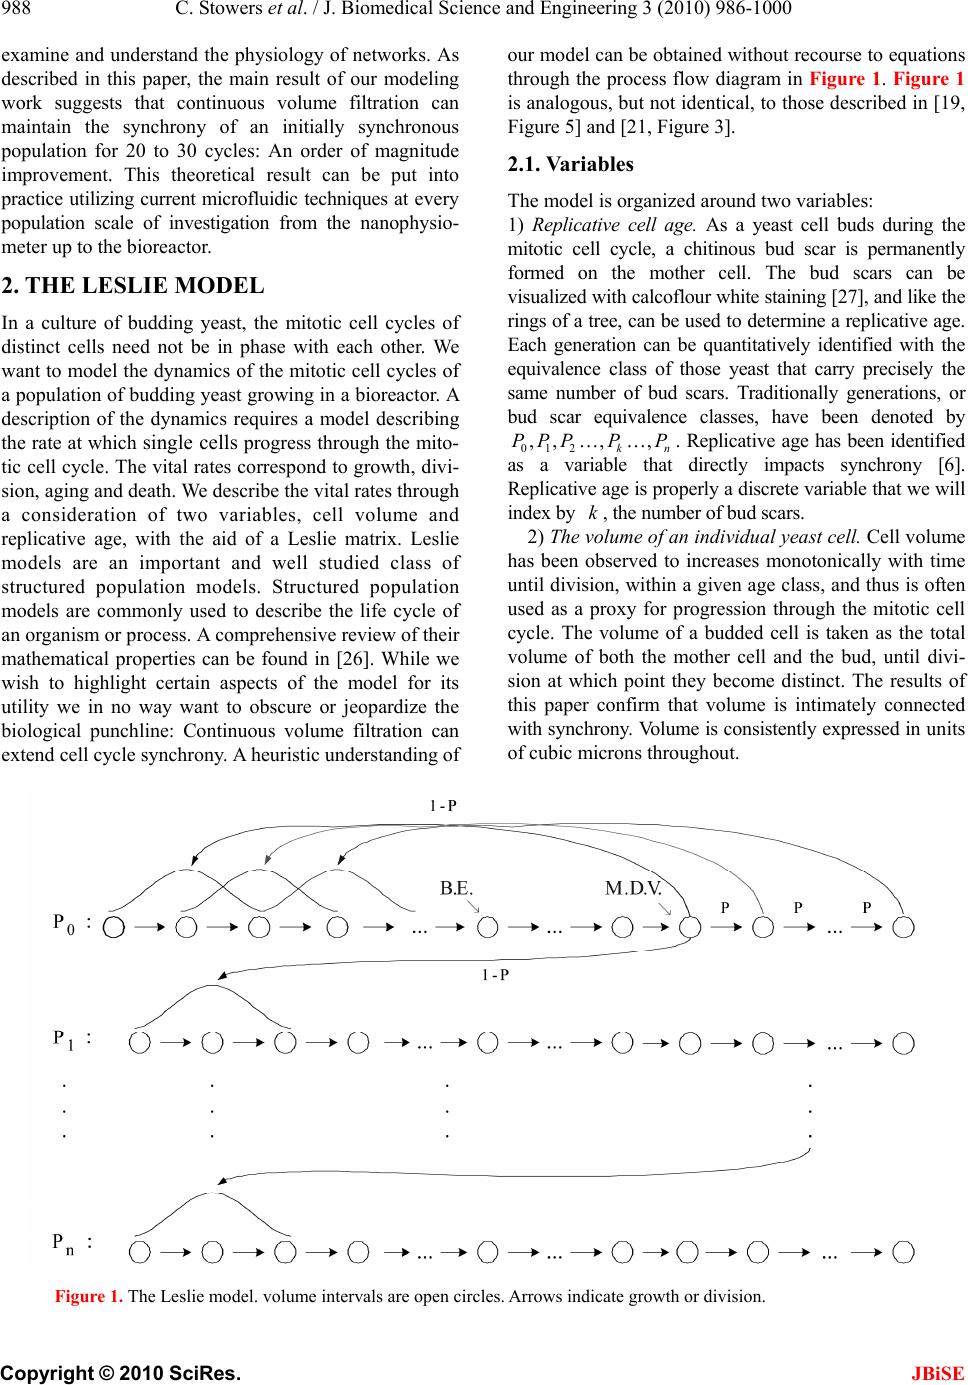 988 C. Stowers et al. / J. Biomedical Science and Engineering 3 (2010) 986-1000 Copyright © 2010 SciRes. JBiSE examine and understand the physiology of networks. As described in this paper, the main result of our modeling work suggests that continuous volume filtration can maintain the synchrony of an initially synchronous population for 20 to 30 cycles: An order of magnitude improvement. This theoretical result can be put into practice utilizing current microfluidic techniques at every population scale of investigation from the nanophysio- meter up to the bioreactor. 2. THE LESLIE MODEL In a culture of budding yeast, the mitotic cell cycles of distinct cells need not be in phase with each other. We want to model the dynamics of the mitotic cell cycles of a population of budding yeast growing in a bioreactor. A description of the dynamics requires a model describing the rate at which single cells progress through the mito- tic cell cycle. The vital rates correspond to growth, divi- sion, aging and death. We describe the vital rates through a consideration of two variables, cell volume and replicative age, with the aid of a Leslie matrix. Leslie models are an important and well studied class of structured population models. Structured population models are commonly used to describe the life cycle of an organism or process. A comprehensive review of their mathematical properties can be found in [26]. While we wish to highlight certain aspects of the model for its utility we in no way want to obscure or jeopardize the biological punchline: Continuous volume filtration can extend cell cycle synchrony. A heuristic understanding of our model can be obtained without recourse to equations through the process flow diagram in Figure 1. Figure 1 is analogous, but not identical, to those described in [19, Figure 5] and [21, Figure 3]. 2.1. Variables The model is organized around two variables: 1) Replicative cell age. As a yeast cell buds during the mitotic cell cycle, a chitinous bud scar is permanently formed on the mother cell. The bud scars can be visualized with calcoflour white staining [27], and like the rings of a tree, can be used to determine a replicative age. Each generation can be quantitatively identified with the equivalence class of those yeast that carry precisely the same number of bud scars. Traditionally generations, or bud scar equivalence classes, have been denoted by 012 ,, , , kn PPP P P . Replicative age has been identified as a variable that directly impacts synchrony [6]. Replicative age is properly a discrete variable that we will index by k, the number of bud scars. 2) The volume of an individual yeast cell. Cell volume has been observed to increases monotonically with time until division, within a given age class, and thus is often used as a proxy for progression through the mitotic cell cycle. The volume of a budded cell is taken as the total volume of both the mother cell and the bud, until divi- sion at which point they become distinct. The results of this paper confirm that volume is intimately connected with synchrony. Volume is consistently expressed in units of cubic microns throughout. Figure 1. The Leslie model. volume intervals are open circles. Arrows indicate growth or division.  C. Stowers et al. / J. Biomedical Science and Engineering 3 (2010) 986-1000 989 Copyright © 2010 SciRes. JBiSE 2.2. Volume Intervals and Time Yeast cells of a given replicative age k, are observed to grow in volume between well defined limits. The minimum and maximum cell volumes observed from experiment are random variables that naturally delimit and define intervals, ():=[ ,] k k kVV. We consider the temporal evolution of the system at a sequence of equally spaced times, := so ttst . The volume intervals, ()k, are partitioned into subintervals (, ):=(, ),(1,)() I ikVik Vikk, with ()= (,) i kIik, = 0,1,...k in, where (0,):=k Vk V, and (1,):= k k Vnk V. The partitions are chosen according to the growth law, within each age class, such that any cell with volume in the interval (, ) I ik now, would have a volume in (1,) I ik , precisely t later. The unit of time is minutes and we have taken =1t throughout. The choice of the time step was chosen based on experimental time series observations of yeast growth and model stability. The number of time intervals k n is determined from the choice of time step and the experimental values of the volume limits and the growth rate equation relating them. The state of the yeast population at time s t is described by a vector, (, )( ): = (, ). s ik t numberofcells ofgenerationkwithvolume vIik Each of the (, )( ) s ik t cells living in (, ) I ik at time s t are faced with the following possibilities: 1) The cell dies 2) The volume of the cell increases 3) The cell divides Each individual yeast does not die or divide at exactly the same volume and age. The population distributions governing each of these possibilities are functions of our independent variables namely volume and age, and are indexed by i and k. We describe the relevant details of these events and their distributions in the following sections. 2.3. Cell Death The probability that cell death occurs is denoted by ,ik d. Mortality curves have been measured for several strains of yeast under a variety of conditions [18,28,29](In particular see Ta ble 1 of the latter). These data can be used to determine an age class specific death rate. In [12] the authors observe that the death rate on average amounts to 10 10/()cell generation . 2.4. Volume Gr owth The probability that growth occurs is denoted by ki g,, and the fraction of cells that survive and grow is )(1:= ,,, kikiki dg . Volume growth has been measured and is generally considered to increase exponentially with time. For all of the experiments and analysis in this paper we have considered exponential volume growth. Let k denote the age class specific growth rate. Then, the volume intervals are conveniently described by (0, )=, (, )=(, ),(, ) (,)=(,), t k kk t k k kk Ik VVe IikVikVike In kVn kV 2.5. Cell Division All cells do not divide precisely at the same volume. The probability that a division occurs, at a given volume indexed by i, within a given age class indexed by k, is denoted ,, := 1 ik ik c . The importance of including sloppy size control in models of growth and division is discussed in [30]. We have implemented a variety of distributions. Two of the most natural are a Poisson process [31] to model division as time to failure, and second a Brownian process using a normal distribution. As will be described in the results section, qualitatively this choice makes little or no difference. The conditional mean volume at which a division happens, with respect to the distribution ki c, for fixed k(age), is referred to as the k--mean division volume and denoted as k--MDV. We assume that the division of a cell of volume v in age class k P results in a cell of age class 0 P with volume v and a cell of age class 1k P with volume v . Furthermore, =vvv . We sometimes denote the division process as 1kk PP . It has been experimentally observed [6] that after a cell has budded, the ensuing volume growth is concentrated almost entirely in the bud. This implies that there is a conditional probability distribution for v that depends on the size and age of the mother. Let ,,ijk be the probability that after a cell division, 1kk PP , we get a cell of age class 0 P with volume in (,0) I i from a dividing cell in (,) I jk . The conditional expected volume, conditioned on a fixed k, with respect to the distribution ,,ijk is referred to as the mean emergent daughter volume and denoted k--MEDV. Let, ,,ijk represent the probability that a parent cell of volume (, 1)Ijk emerges from a division event in (, ) I ik . The conditional expected volume of the parent after division is denoted k--MEPV. Generally, the distribution of division volumes has been observed to be normal [32,33]. Given these definitions we can present the projection 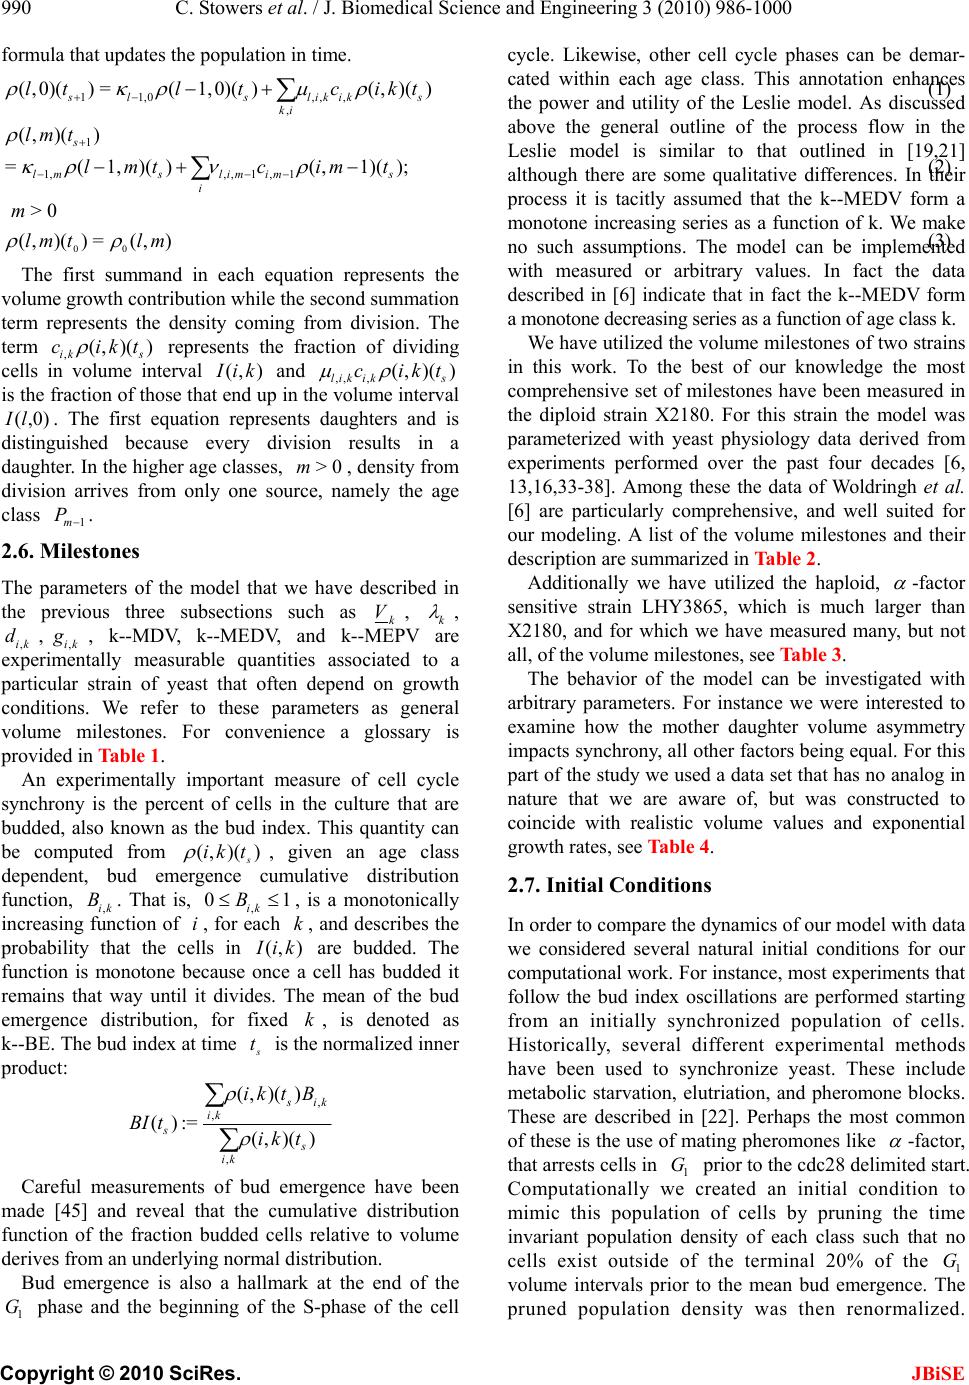 990 C. Stowers et al. / J. Biomedical Science and Engineering 3 (2010) 986-1000 Copyright © 2010 SciRes. JBiSE formula that updates the population in time. 11,0 ,,, , (,0)()=(1,0)()(,)() s lslikiks ki ltltc ikt (1) 1 1,, ,1,1 (, )() =(1,)( )(,1)( ); >0 s l mslimims i lm t lmtcimt m (2) ),(=))(,( 00 mltml (3) The first summand in each equation represents the volume growth contribution while the second summation term represents the density coming from division. The term ,(,)( ) ik s cikt represents the fraction of dividing cells in volume interval (, ) I ik and ,, ,(, )() lik iks cikt is the fraction of those that end up in the volume interval ,0)(lI . The first equation represents daughters and is distinguished because every division results in a daughter. In the higher age classes, >0m, density from division arrives from only one source, namely the age class 1m P. 2.6. Milestones The parameters of the model that we have described in the previous three subsections such as k V, k , ,ik d,,ik g , k--MDV, k--MEDV, and k--MEPV are experimentally measurable quantities associated to a particular strain of yeast that often depend on growth conditions. We refer to these parameters as general volume milestones. For convenience a glossary is provided in Table 1. An experimentally important measure of cell cycle synchrony is the percent of cells in the culture that are budded, also known as the bud index. This quantity can be computed from ))(,( s tki , given an age class dependent, bud emergence cumulative distribution function, ,ik B. That is, , 01 ik B, is a monotonically increasing function of i, for each k, and describes the probability that the cells in (, ) I ik are budded. The function is monotone because once a cell has budded it remains that way until it divides. The mean of the bud emergence distribution, for fixed k, is denoted as k--BE. The bud index at time s t is the normalized inner product: , , , (, )( ) ():= (, )( ) s ik ik ss ik ik tB BI tik t Careful measurements of bud emergence have been made [45] and reveal that the cumulative distribution function of the fraction budded cells relative to volume derives from an underlying normal distribution. Bud emergence is also a hallmark at the end of the 1 G phase and the beginning of the S-phase of the cell cycle. Likewise, other cell cycle phases can be demar- cated within each age class. This annotation enhances the power and utility of the Leslie model. As discussed above the general outline of the process flow in the Leslie model is similar to that outlined in [19,21] although there are some qualitative differences. In their process it is tacitly assumed that the k--MEDV form a monotone increasing series as a function of k. We make no such assumptions. The model can be implemented with measured or arbitrary values. In fact the data described in [6] indicate that in fact the k--MEDV form a monotone decreasing series as a function of age class k. We have utilized the volume milestones of two strains in this work. To the best of our knowledge the most comprehensive set of milestones have been measured in the diploid strain X2180. For this strain the model was parameterized with yeast physiology data derived from experiments performed over the past four decades [6, 13,16,33-38]. Among these the data of Woldringh et al. [6] are particularly comprehensive, and well suited for our modeling. A list of the volume milestones and their description are summarized in Table 2. Additionally we have utilized the haploid, -factor sensitive strain LHY3865, which is much larger than X2180, and for which we have measured many, but not all, of the volume milestones, see Table 3. The behavior of the model can be investigated with arbitrary parameters. For instance we were interested to examine how the mother daughter volume asymmetry impacts synchrony, all other factors being equal. For this part of the study we used a data set that has no analog in nature that we are aware of, but was constructed to coincide with realistic volume values and exponential growth rates, see Table 4. 2.7. Initial Conditions In order to compare the dynamics of our model with data we considered several natural initial conditions for our computational work. For instance, most experiments that follow the bud index oscillations are performed starting from an initially synchronized population of cells. Historically, several different experimental methods have been used to synchronize yeast. These include metabolic starvation, elutriation, and pheromone blocks. These are described in [22]. Perhaps the most common of these is the use of mating pheromones like -factor, that arrests cells in 1 G prior to the cdc28 delimited start. Computationally we created an initial condition to mimic this population of cells by pruning the time invariant population density of each class such that no cells exist outside of the terminal 20% of the 1 G volume intervals prior to the mean bud emergence. The pruned population density was then renormalized.  C. Stowers et al. / J. Biomedical Science and Engineering 3 (2010) 986-1000 991 Copyright © 2010 SciRes. JBiSE Table 2. A list of volume milestones and growth parameters for the strain X2180. Age(k) k V k V k BE MDV MEDV. 0 14 75 0.0062 38.5 70.7 28.5 1 40 85 0.0061 46.8 75 24.4 2 48 87 0.0044 56.1 82.4 24.2 3 56 94 0.0047 63.9 88.9 22.3 4-13 64 125 0.0047 76.3 95 22.2 Table 3. A list of volume milestones and growth parameters for the strain LHY3865. Age(k) k V k V k BE MDV MEDV 0 30 105 0.005459.0 98.0 46.0 1 45 105 0.004969.5 97.5 43.0 2 53 104 0.004968.9 96.6 36.5 3 60 115 0.004978.8 110.4 36.5 4 73 140 0.004995.7 134.1 36.5 5 97 185 0.0049155.0 179.1 36.5 6-13 129 190 0.0049155.0 179.1 36.5 Tabl e 4. A list of growth parameters to study the impact of the daughter to mother volume asymmetry on the decay of synchrony. Age(k) k V k V k BE MDV MEDV 0-13 40 110 0.0047 60 100 50 Correspondingly, we will refer to this distribution as the -factor initial condition. In the late 1960's Helmstetter [39] had the ingenious insight to create what is now referred to as the baby machine. The concept can be made to work with virtually any dividing cells, but was conceived for yeast. Cells are adhered to a membrane and perfused with media. As the cells divide the daughters fall into a receptacle. The collected 0 P cells can be re-adhered to a fresh membrane and the process iterated, with or without pheromones, limited only by imagination. In this way one can experimentally create and subsequently analyze coherent populations. Other clever ways of preparing and separating cells also exist [29,40]. With the help of a baby machine we have collected coherent 0 P cells and run these cells through a Coulter counter to measure their volume distribution. Such distributions are easy to import into the computer and in this way we have created what we will refer to as a baby initial condition. 2.8. Filtration The main objective of this study was to observe the behavior of a computational population of yeast under- going continuous filtration. Here we wish to formally define what we mean by filtration. Figure 2 depicts how the process works. Two volumes are specified, * V and * V, and together these define a volume interval, * * :=,( ) k VV k. In Figure 2, the vertical red lines indicate the volumes * V and * V and how they intersect the various intervals ()k. All cells, regardless of age, whose volume lies outside of are removed from the system at every timestep. * * (, )(, )(, )( )=0 s VikV orVikVikt This is intended to mimic what one imagines a perfect volume filter might do to a real yeast culture. In engineering practice this would be called a two stage filtration because each of the two defining inequalities would be implemented by a separate filter and the process carried out in series. 3. LABORATORY MATERIALS AND METHODS Yeast cells of Saccharomyces cerevisiae strain LHY3865 (mat a-URA, LEU, bar1 ) were grown in YNB media without ammonia or amino acids and with 100 mg/L leucine, 20 mg/L uracil, 0.2% glutamine, and 2% glucose at 30℃. Batch shake flask cultures were grown with an agitation of 225 rpm in a New Brunswick Scientific Innova 44 orbital incubator/shaker. 1.5 L bio- reactor cultures were grown in a 3 L New Brunswick Scientific bioreactor with a dilution rate of D = 0.35 hr-1, air was sparged through the reactor at a rate of 500 mL/ min, and the culture was agitated with two Rushton-type impellers ran at 225 rpm. Figure 2. Volume filtration process. The vertical red lines indicate volume filters. Cells below the lower or above the upper filters are moved from the system.  992 C. Stowers et al. / J. Biomedical Science and Engineering 3 (2010) 986-1000 Copyright © 2010 SciRes. JBiSE Figure 3. Experimental measurements of bud index synchrony and comparison with simulation. Top bud index oscillations of the X2180 strain in a shake flask [10]. Bottom is LHY3865 strain, grown in a bioreactor and synchronized with -factor. 3.1. Cell Cycle Synchronization A 750 mL yeast culture was arrested at a cell density of OD = 0.8 through the addition of 5 310 M -factor mating pheromone (Sigma # 63591) and were incubated for 3 hours. Cells were subsequently released from arrest by pelleting followed by three washes with fresh preconditioned media, free of -factor, con- taining 0.1 mg/mL Pronase E (Sigma # P-6911). The pre- conditioned media was prepared by allowing LHY3865 yeast cells to grow within the media for 4 hours at 600 =0.4OD before being removed by a 0.2 μm filter. The synchronized cells were then resuspended in 1.5 L of preconditioned media and grown in the bioreactor as described above. 0.5 mL samples were taken from the bioreactor at a time interval of 3 minutes and were immediately frozen in 50% glycerol by the addition to an ethanol-dry ice bath. For batch experiments, samples were taken at a time interval of 10 minutes for the first 90 minutes of the experiment and then every 20 minutes for the re- mainder of the experiment duration. 3.2. Bud Index Analysis Samples were analyzed using a conventional microscope for bud index. Each data point consisted of more than 100 different analyzed cells. Samples were vortexed briefly and then sonicated for 1 minute prior to analysis to minimize cell clumping to ease analysis. 10 L of each sample was then pippetted onto a glass slide to be analyzed with the microscope. Cells were individually interrogated using multiple focal planes and a 100X objective. Yeast cells were only considered budded if a septum did not separate the mother from the daughter cells. 4. RESULTS When the model is parameterized with the experi- mentally determined volume milestones we observe excellent agreement between the output of the model and experiment for both time invariant properties such as the age distribution as well as dynamical properties such as the bud index oscillations. This congruence provides confidence in our main result: The synchrony of an initially synchronous population can be extended by at least an order of magnitude through continuous volume filtration. We define synchrony as the number of conse- cutive bud index oscillations whose amplitude is at at least 60% of maximum, that is, varies between less than 20% budded and greater than 80% budded. 4.1. Comparison with Experiment 4.1.1. Bud Index Dynamics The Leslie model produces good agreement with measured experimental time series. The Leslie model qualitatively as well as quantitatively captures the dynamics of two different yeast strains with very different volume milestones. Figure 3 shows the good agreement between the Leslie model and the experiments described in [6] with strain X2180. We have made careful measurements of the bud index oscillations for the α-factor sensitive strain LHY3865, both in a batch and continuously operated bioreactor. The data shown in Figure 3 are typical of those described in the literature over the past 4 decades, see for instance [41]. The LHY3865 cells are initially synchronized with the mating pheromone -factor that arrests unbudded cells in 1 G. The agreement of fine structural features between the experiment and simu- lation, such as the breadth at the top of the oscillation, indicates that the model is capturing the essential features of budding yeast volume growth and division. Using the bud index experimental data we have performed a sensitivity analysis to determine how the individual milestones affect the congruence between model and system dynamics. The results indicate that the  C. Stowers et al. / J. Biomedical Science and Engineering 3 (2010) 986-1000 993 Copyright © 2010 SciRes. JBiSE milestones of the daughter generation are the most sensitive and the sensitivity decays monotonically with age. How well the model dynamics fit the data is most sensitive to the mean division volume of the daughter generation, followed by the mean bud emergence milestone. In general a 10% change in the milestones produced less than a 10% change in the overall fit between model dynamics and experimental time series. This indicates that the basic processes of the model robustly capture the dynamical phenomena associated with bud index oscillations. 4.1.2. Stationary Properties The model parameterized with the X2180 milestones reproduces the measured stationary values within the measured deviations where available, see Table 5. The measured quantities were the fractions(F) of daughters (D), parents(P), budded(B) and unbudded(U). It was observed in [13] that a quantitative relationship exists of the form 1 (1( ))= D PG k , where 1 ()PG is the percentage of cells in the 1 G phase, D is the observed population doubling time and k is a constant. This would be unremarkable save for the fact that =1.1k hrs was observed over a wide range of growth rates, suggesting some universality. The observed population doubling time is in reality a population weighted average over all the generations and we have computed this quantity from the model using two natural ensemble averages that produce the same value of =1.2k hrs that is in close agreement with the experimental value for which no standard deviation was reported. 4.2. Decay of Synchrony with Division Asymmetry As described in the introduction, it has been well known that the volume asymmetry between mothers and daughters has a profound effect on the decay of syn- chrony of initially synchronized populations of budding yeast. Since budding yeast display a bewildering array of strain variation we felt it legitimate and interesting to ask how the amplitude of the bud index oscillation decays as a function of inherent volume asymmetry between mo- thers and daughters at division. This volume asymmetry has a constant mean value for each strain of yeast. Essentially this value is M EPV MEDV, when it does not vary with k. From the bud index curve we have computed the envelope of the oscillation and fit the amplitude decay. As expected from the theory, see for instance [26] (Subsection 4.7), the decay is exponential. The initial rates of decay are described in the top panel of Figure 4, while the number of corresponding syn- chronous cycles are shown in the bottom panel. The computational results show that as expected the number of cycles of synchrony declines dramatically with volume asymmetry. When the daughter to mother volume ratio is 80% the number of synchronous cycles has decayed from infinity to one for the X2180 milestones. 4.3. Volume Filtration We have examined two filtration strategies computa- tionally. Figure 2 describes the general filtering scheme. In a two stage filtration we impose both an upper and a lower volume limit. All cells whose volume lies in between are retained in the system, a bioreactor, and the rest are continuously removed. In a single stage filtration there is only a lower volume limit, and all cells smaller than this are removed, those that are larger remain. The main two stage filtration results of this paper are presented in Figures 5 and 6. After inspecting the volume-time diagram constructed in [6], we conjectured that it would be possible to emulate the symmetry of near equal volume division by filtering out cells that were too small or too large. We reasoned that this would have the abstract effect of making all the age class grids nearly the same. In large part this hypothesis was born out as the data show that by a judicious choice of filtration parameters we can extend the synchrony from 1 cycle to close to 20 cell cycles in the X2180 strain and from 3 to 30 in the LHY3865 strain. Figure 7 shows the bud index profiles associated with several of the filtration parameters that describe the range from no filtering to the best that we have been able to observe at 17 cycles for the X2180 milestones. Equivalently Figure 8 shows the bud index osci- llations of the LHY3865 milestones subject to single and double stage filtration. The upper panels show the results of single stage filtration. Figure 9 codifies the behavior of the single stage filtration of the LHY3865 milestones. This figure is annotated with the k-mean daughter Table 5. Comparison of stationary properties of the model with experiment for the X2180 strain. The experimental data are reproduced from table 1 of [47] with the exception of the last two entries that are taken from [36]. F(D),F(P),F(B),F(U) are the fractions of daughters, parents, budded and unbudded respectively. Property Model prediction Experiment F(D) 61.0 60.3 1.8 F(P) 39.0 39.7 1.7 F(B) 63.0 66.9 4.0 F(U) 37.0 33.1 F(B) 1.2 1.1 ()FB 1.2 1.1  994 C. Stowers et al. / J. Biomedical Science and Engineering 3 (2010) 986-1000 Copyright © 2010 SciRes. JBiSE Figure 4. Decay of synchrony as a function of daughter:mother volume ratio. Synchrony is computed from bud index oscillations. Starting from unimodal population of daughter cells distributed in G1. Figure 5. Synchrony computed as a function of two stage filtration for strain X2180 milestones. The data indicate that there is an optimal ridge of values that produce extended synchrony. Figure 6. Synchrony computed as a function of two stage filtration for strain LHY3865 milestones. emergence volumes. It is clear from the computational data that the position of these milestones relative to the filtration volume limit determines the range of extended synchrony. The fact that there exists a broad volume range near the top of the peak ensures that the single stage filtration should in practice produce robust results. 4.4. Invariant Density For the general volume parameters and growth kinetics of budding yeast, like those detailed in [6], and summarized in Tables 2 and 3, the population density generically reaches a unique, non trivial stationary state [43]. This behavior is observed experimentally. As a consequence of the primitivity of the Leslie Matrix and the Perron-Frobenious theorem the invariant density can be recovered from the model as the 1 L-normalized eigenvector corresponding to the unique largest eigenvalue of the matrix. The state of the system at asynchronous exponential growth and is described by ()= t teX , where is the population growth rate, and X is the eigenvector that, when normalized in the 1 L norm, represents the time invariant probability density of observing a yeast cell of a given volume and age. Figure 10 describes the properties of the invariant density, X computed for the X2180 milestones. As the figure shows, the invariant population distribution within each age class are smoothed through the use of a distribution of emergent parent and daughter volumes upon division. We examined a family of normal distributions and the qualitative features are insensitive to the specific details, such as the value of . The stationary daughter distribution exhibits an inflection point at the population weighted average of the k--MEDV from all age classes with >0k. Because of the birth of new daughters coming from all age  C. Stowers et al. / J. Biomedical Science and Engineering 3 (2010) 986-1000 995 Copyright © 2010 SciRes. JBiSE classes, the daughter distribution is the only generation to exhibit bimodality. A local maximum appears just ahead of the 0-MEDV milestone that result from the 01 PP division. The daughter density distribution decays with increasing volume after the global maximum as a linear combination of two exponentials. The structure of the invariant density is similar to those hypothesized in earlier works [3,29,35,40]. The invariant density within the parent age classes, k P for >0k are similar to each other in that they achieve a global maximum that decays exponentially with increasing volume. For all age classes other than the daughter Figure 7. Bud Index oscillations of strain X2180 milestones for various filtration parameters. Top left unfltered system, clockwise limits, in units of cubic microns: [34; 91], [30; 90], and [30; 71] respectively. generation, the invariant density is indistinguishable from the function 1 2 A , where the constant A is arbitrary and the simple linear function 010 =( )/()vvv v rescales the volume interval into the unit interval. This agrees well with the theory described previously [3,29,35,40]. 4.5. Age Distribution Since replicative age can be distinguished through bud scar analysis it is possible to determine the age distribution of a culture of yeast. For instance, if we select a cell at random from a culture of X2180 cells during asynchronous, exponential growth in a bioreactor we will have a less than 1 in 3 chance of observing a 1 P and about a 1 in 6 chance of finding a 2 P. It is of interest to understand how each age class is weighted during oscillations as well as once the density becomes stationary [12,19,43,44]. The age distribution of a symmetrically dividing organism decays like the geometric series 1 =0 1 () 2 kk . For budding yeast the age distribution is more complicated. Lord and Wheals [12] derived a parsimonious formula based on the culture doubling time and the doubling time of the parents, P . The age distribution computed using the X2180 milestones, shown at lower left in Figure 10 shows excellent, agreement with the experimental data of Beran et al. [43] for a strain of Saccharomyces cerevisiae grown in a bioreactor at comparable dilution rates. The formula of Lord and Wheals was fit by least squares to the Leslie model data through the variable P. The best fit value of = 88.3P minutes is however uninter- pretable in relation to the X2180 parameters. For instance the average, maximum doubling time of the parent generations is calculated as 136.6 minutes, while  996 C. Stowers et al. / J. Biomedical Science and Engineering 3 (2010) 986-1000 Copyright © 2010 SciRes. JBiSE the average minimum doubling time time is 96.8 minutes. These latter two values should realistically bookend the mean doubling times. Based on a consideration of population flux and flux transit time we have been able to derive a recurrence relation that explains the observed non-geometric decay of the age distribution in terms of the growth parameters Figure 8. Bud index oscillations of LHY3865. Top panels single stage, bottom are two stage filtration. Right panels are best achievable. Parameters cubic microns are clockwise from top right: 39, 42, [37; 100] and [33; 178]. that extends previous works [12,44]. This analysis is to be presented elsewhere. Given the general exponential decay of the age distribution we have contented ourselves to represent 14 generations computationally. Experimentally mortality curves for replicative age has been measured for some strains of budding yeast [18,29,30]. It has been observed there that some yeast can survive upwards of 60 divisions. From the decline in the age distribution we have observed that practically, 20,30,40 generations or more, need not be represented in the model to precisely capture the dynamics of the system. We know of no experimental data sets that have completely charac- terized more than the first 8 age classes. The precise connection between senescence and replicative aging is currently undecided and is an interesting area of intense activity. 5. DISCUSSION The Leslie model captures the dynamics of bud index oscillations and their decay. We have shown that there is good agreement between measured data and the predicted bud index oscillations for two different sets of strain milestones, one haploid and one diploid, of different volume extents and growth rates. The different strains of yeast display quantitatively different behavior with regard to their decay of synchrony as we have defined it. The X2180 strain exhibits 1 synchronous cycle while the LHY3865 strain displays 3. The model captures this difference. This instills confidence in the model predictions of synchrony. The strain milestones in both cases contain measurement error and are incomplete especially in generations higher than the fourth age class. The agreement of the model and the  C. Stowers et al. / J. Biomedical Science and Engineering 3 (2010) 986-1000 997 Copyright © 2010 SciRes. JBiSE experimental data, despite these errors, exposes the robustness of the processes and the ability of the Leslie model to capture the essentials of the asymmetric growth and division process. These claims are supported by the results of a sensitivity analysis. It is well known that theoretically volume symmetric division is a degenerate case that leads to persistent synchrony [31,42]. Several well known avenues allow the manipulation of the division volume asymmetry. Lord and Wheals observed [12], as have many others, that age class growth rates depend linearly on the culture doubling time and estimated that there exists a growth rate that if achievable would produce balanced and presumably synchronous growth. Growth rates are most typically affected through variation of nitrogen or carbon source. It has also been observed that drugs such as hydroxyurea can induce nearly symmetric division [39]. It is well known that strain variations influence division volume asymmetry. We have explicitly examined the relationship between division volume asymmetry and the number of synchronous cycles of bud index oscillations. Our intentions in doing so are two fold. First, we imagine that if a legitimate relationship exists then it may be possible through a judicious mutation to create strains of yeast with predefined synchrony. Second, we see a direct relationship between the control of syn- chrony through continuous volume filtration and the natural synchrony that results from volume symmetric division. What this means is that a volume filter is seen in the abstract as a mechanism for restoring partial symmetry to an underlying volume asymmetric system. For instance, consider Figure 2. The volume grids of the different generations are not a priori commensurate, however the volume grids that live between the filter cutoffs are more so. Those cells that are far from the symmetry conditions are removed from the system, leaving the remainder more synchronous. The intrinsic asymmetry that volume filtration cannot influence are the volume milestones such as k-MEDV, k-BE and k-MDV. These however can be influenced by mutation and or nutrients. The combination of mutation, media composition and continuous volume filtration is therefore expected to be able to produce budding yeast that are remain synchronous for long periods of time starting from a homogeneous initial condition. We have explored both single and double stage filtration. We explored single stage filtration and present it here because it is far easier to implement in practice and it appears to produces results that could be observed with even a crude device. The results indicate that there exist robust windows of volume that can be used to control synchrony. An example can be seen in the single stage results, Figure 9. There is a broad peak around 3 μm 41, approximately 3 μm 4 in width that produces a roughly 4 fold extension in synchrony. This result if correct implies that even a crude filtration device should Figure 9. Single stage filtration for LHY3865. Cells below cutoff continuously removed. Synchrony measures successive cycles of Bud index oscillation that maintains at least 60% of its total amplitude.  998 C. Stowers et al. / J. Biomedical Science and Engineering 3 (2010) 986-1000 Copyright © 2010 SciRes. JBiSE produce observable changes. We are currently exploring design equations for such a device. Continuous filtration is a control mechanism that will alter the population structure relative to a unfiltered Figure 10. Invariant density for X2180. Clockwise from upper: P0, P6 and P13 distributions. Lower left compares model age distribution with data of Beran et al. [43] and formula of Lord and Wheals [24]. population. A population structure that will be altered in the filtered population are the volume distributions and the overall age distribution. How, and to what extent the age distribution is affected can be analyzed with the model. The results of this analysis are to appear else- where. Continuous filtration, we think, can be accomp- lished experimentally without inducing a general stress response in the individual cells of the population. We observe that while we have explored here the very specific application of volume filtration, the Leslie model can be used to explore a much broader range of questions that are of continuing interest in yeast physiology and in the larger picture of systems biology. For instance, as has been observed previously [19,22], it is possible to use the model to investigate how signals from single cells manifest themselves at the populations level. With the addition of volume filtration it will be possible to study cell cycle dependent protein expression more extensively. A use that has been little explored to date is how a signal, periodic in the cell cycle, such might be conceived for a gene expression, manifests itself at the population level. When signals are routinely evaluated by grinding up large numbers of cells and pooling their mRNA for instance, such questions seem reasonable. We have previously observed that how one grinds up the cells in such a situation has quantifiable effects that depend on the cell cycle [45]. Any extensive quantity that varies in a single cell with the cell cycle can be examined with this model. For example oxygen con- sumption, glucose uptake, or mRNA production of the population can be studied given measured or putative data from single cells. Conversely, it is also possible to  C. Stowers et al. / J. Biomedical Science and Engineering 3 (2010) 986-1000 999 Copyright © 2010 SciRes. JBiSE use the model to deconvolve population ensemble ave- rages into individual cell signals. Finally, a physiological component that has not been included into the current model are the putative asymmetric effects that are now emerging in the study of chronological aging and senescence [7]. It is well known that aging occurs in organisms such as Escherichia coli and fission yeast that undergo morphogenically sym- metric division [1]. Given the success of the Leslie model in matching the dynamics of the bud index oscillations for a few cell cycles, it is tempting to sug- gest that deviations between the Leslie model and the dynamics of yeast with a variety of aging phenotypes may provide new and otherwise difficult to attain insight into the rate and effects of senescence. 6. ACKNOWLEDGEMENTS We thank Linda Breeden for the gift of the LHY3865 strain. We thank Konstantin Mischaikow for coding an early version of the model and helpful discussions. EMB, and CS, were partially supported through NSF-DMS 0443855. REFERENCES [1] Stewart, E.J., Madden, R., Paul, G. and Taddei, F. (2005) Aging and death in an organism that reproduces by mor- phologically symmetric division. PLoS Biology, 3(2), 295- 300. [2] Bellgardt, K.H. (1994) Analysis of synchronous growth of bakers yeast. Part I: Development of a theoretical model for sustained oscillations. Journal of Biotechnol- ogy, 35(1), 19-33. [3] Keulers, M., Sazuki, T., Satroutdinov, A.D., Kuriyama, H. (1996) Autonomous metabolic oscillations in continuous culture of saccharomyces cerevisiae grown on ethanol. FEMS Micro Letters, 142(2-3), 253-258. [4] Murray, D.B., Klevecz, R.R. and Lloyd, D. (2003) Gen- eration and maintenance of synchrony in saccharomyces cerevisiae continuous culture. Experimental Cellular Re- search, 287(1), 10-15. [5] Tu, B.P., Kudlicki, A., Rowicka, M. and McKnight, S.L. (2006) Logic of the yeast metabolic cycle: Temporal compartmentalization of cellular processes. Science, 310 (5751), 1152-1158. [6] Woldringh, C.L., Huls, P.G. and Vischer, N. (1993) Vol- ume growth of daughter and parent cells during the cell cycle of saccharomyces cerevisiae /a as determined by image cytometry. Journal of Bacteriology, 175(10), 3174- 3181. [7] Ackerman, M., Chao, L., Berstrom, C. and Doebeli, M. (2007) On the evolutionary origin of aging. Aging Cell, 6(2), 235-244. [8] Agilaniu, H., Gustafsson, L., Rigoulet, M. and Nystrom, T. (2003) Asymmetric inheritance of oxidatively dam- aged proteins during cytokinesis. Science, 299(5613), 1751-1753. [9] Eisen, M.B., Spellman, P.T., Brown, P.O. and Botstein, D. (1998) Cluster analysis and display of genome-wide ex- pression patterns. Proceedings of National Academy Sci- ences, 95(25), 14863-14868. [10] Boczko, E.M., Cooper, T.G., Gedeon, T., Mischaikow, K., Murdock, D.G., Pratap, S. and Wells, K.S. (2005) Struc- ture Theorems and the Dynamics of Nitrogen Catabolite Repression in Yeast. Proceedings of National Academy Sciences, 102(16), 5647-5652. [11] Boczko, E.M., Gedeon, T. and Mischaikow, K. (2007) Dynamics of a simple regulatory switch. Journal of Mathematical Biolo gy, 55(5-6), 679-719. [12] Lord, P.G. and Wheals, A.E. (1980) Asymmetrical divi- sion of saccharomyces cerevisiae. Journal of Bacterial 142(3), 808-818. [13] Slater, M.L., Sharrow, S.O. and Gart, J.J. (1977) Cell cycle of saccharomyces cerevisiae in populations growing at different rates. Proceedings of National Academy Sci- ences, 74(9), 3850-3854. [14] Harris, T.E. (1967) The theory of branching processes. Die Grundlehren der Mathematischen Wissenschaften, band 119. Springer-Verlag, Berlin; Prentice-Hall, Inc., Englewood Cliffs, New Jersey. [15] Kimmel, M. and Axelrod, D.E. (2002) Branching proc- esses in biology. Interdisciplinary Applied Mathematics, Springer-Verlag, New York. [16] Hartwell, L.H. and Unger, M.W. (1977) Unequal division in saccharomyces Cerevisiae and its implications for the control for the cell division. Journal of Cellular Biology, 75(2), 422-435. [17] Chen, K.C., Calzone, L., Ccikasz, N.A., Cross, F.R., Novak, B. and Tyson, J.J. (2004) Integrative analysis of cell cycle control in budding yeast. Molecular Biology Cellular, 15(8), 3841-3862. [18] Egilmez, N.K. and Jazwinski, S.M. (1989) Evidence for the involvement of a cytoplasmic factor in the aging of the yeast saccharomyces cerevisiae. Journal of Bacteri- ology, 171(1), 37-42. [19] Vanoni, M., Vai, M., Popolo, L. and Alberghina, L. (1983) Structural heterogeneity in populations of the budding yeast saccharomyces cerevisiae. Journal of Bacteriology, 156(3), 1282-1291. [20] Jorgensen, P. and Tyers, M. (2004) How cells coordinate growth and division. Current Biology, 14, R1014-R1027. [21] Hatzis, C. and Porro, D. (2006) Morphologically struc- tured models of growing budding yeast populations. Journal of Biotechnology, 124(2), 420-438. [22] Walker, G. (1999) Synchronization of yeast cell popula- tions. Methods in Cell Science, 21(2-3), 87-93. [23] Davis, R.H. and Gecol, H. (1996) Classification of con- centrated suspensions using inclined settlers. Interna- tional Journal of Multiphase Flow, 22(3), 563-574. [24] Walsh, T.J. and Bungay, H.R. (1979) Shallow depth sedimentation of yeast cells. Biotechnology and Bioen- gineering, 21(6), 1081-1084. [25] Wickramasinghe, S.R., Lin W.C. and Dandy D.S. (2001) Seperation of different sized particles by inertial migra- tion. Biotechnical Lette rs, 23(17), 1417-1422. [26] Caswell, H. (2001) Matrix Population Models. 2nd Edi- tion, Sinauer Associates Inc. Sunderland. [27] Pringle, J.R. (1991) Staining of bud scars and other cell wall chitin with calcoflour. Methods in Enzymology, 194,  1000 C. Stowers et al. / J. Biomedical Science and Engineering 3 (2010) 986-1000 Copyright © 2010 SciRes. JBiSE 732-735. [28] Pohley, H.J. (1987) A formal mortality analysis for populations of unicellular organisms (saccharomyces cerevisiae). Mechanisms of Ageing and Development, 38(3), 231-243. [29] Sinclair, D., Mills, K. and Guarente, L. (1998) Aging in saccharomyces cerevisiae. Annual Revised Microbiology, 52, 533-560. [30] Tyson, C.B., Lord, P.G. and Wheals, A.E. (1979) De- pendency of size in saccharomyces cerevisiae cells on growth rate. Journal of Bacteriology, 138(1), 92-98. [31] Smith, J.A. and Martin, L. (1973) Do cells cycle? Proceed- ings of National Academy Sciences, 70(4), 1263-1267. [32] Hersh, R.T. and Kitos, P.A. (1980) Is 1 G normally dis- tributed? Journal of Theoretical Biology, 86(1), 117-122. [33] Wheals, A.E. (1982) Size control models of saccharo- myces cerevisiae cell proliferation. Mollecular and Cel- lular Biology, 2(4), 361-368. [34] Barford, J.P. and Hall, R.J. (1976) Estimation of the length of cell cycle phases from asynchronous cultures of saccharomyces Cerevisiae. Experimental Cell Research, 102(2), 276-284. [35] Brewer, B.J., Chlebowicz, S.E. and Fangman, W.L. (1984) Cell cycle phases in the unequal mother/daughter cell cycles of saccharomyces Cerevisiae. Molecular and Cel- lular Biology, 4(11), 2529-2531. [36] Johnston, G.C., Pringle, J.R. and Hartwell, L.H. (1977) Coordination of growth with cell division in the yeast Saccharomyces Cerevisiae. Experimental Cellular Re- search, 105(1), 79-98. [37] Johnston, G.C., Ehrhardt, C.W., Lorincz, A. and Carter, B.L.A. (1979) Regulation of cell size in the yeast Sac- charomyces Cerevisiae. Journal of Bacteriology, 137(1), 1-5. [38] Singer, R.A. and Johnston, G.C. (1981) Nature of the G1 phase of the yeast saccharomyces cerevisiae. Proceeding s o f National Ac ademy Sciences , 78(5), 3030-3033. [39] Helmstetter, C. A. (1991) Description of a baby machine for Saccharomyces cerevisiae. The New Biologist, 3(11), 1089-1096. [40] Koshwanez, J., Holl, M., Marquardt, B., Dragavon, J., Burgess, L. and Meldrum, D. (2004) Identification of budding yeast using a fiber-optic imaging bundle. Re- vised Scientific Instruction, 75(5), 1363-1365. [41] Breeden, L.L. (1997) -Factor synchronization of bud- ding yeast. Methods in Enzymology, 283, 332-342. [42] Diekmann, O., Heijmans, H.J.A.M. and Thieme, H.R. (1984) On the stability of the cell size distribution. Jour- nal of Mathematical Biology, 19(2), 227-248. [43] Beran, K., Malek, I., Steiblova, E. and Lieblova, J. (1967) The distribution of the relative age of cells in yeast populations. Microbial Physiology and Continuous Cul- ture: 3rd International Symposium Held at the Microbi- ological Research Establishment (Ministry of Defense), Porton Down, Salisbury, Wiltshire. [44] Gover, N.B. and Woldringh, C.L. (1995) Relationship between the fraction of cell of different genealogical ages and their cycle times in saccharomyces Cerevisiae: A theoretical analysis. Journal of Theoretical Biology, 174(2), 223-225. [45] Stowers, C. and Boczko, E.M. (2007) Reliable cell dis- ruption in yeast. Yeast, 24(6), 533-541. [46] Johnston, G.C. and Singer R.A. (1983) Growth and the cell cycle of the yeast saccharomyces Cerevisiae. Ex- perimental Cellular Research, 149(1), 1-13. [47] Kaeberlein, M. (2005) Regulation of yeast replicative life span by TOR and Sch9 in response to nutrients. Science 310(5751), 1193-1196. |