Paper Menu >>
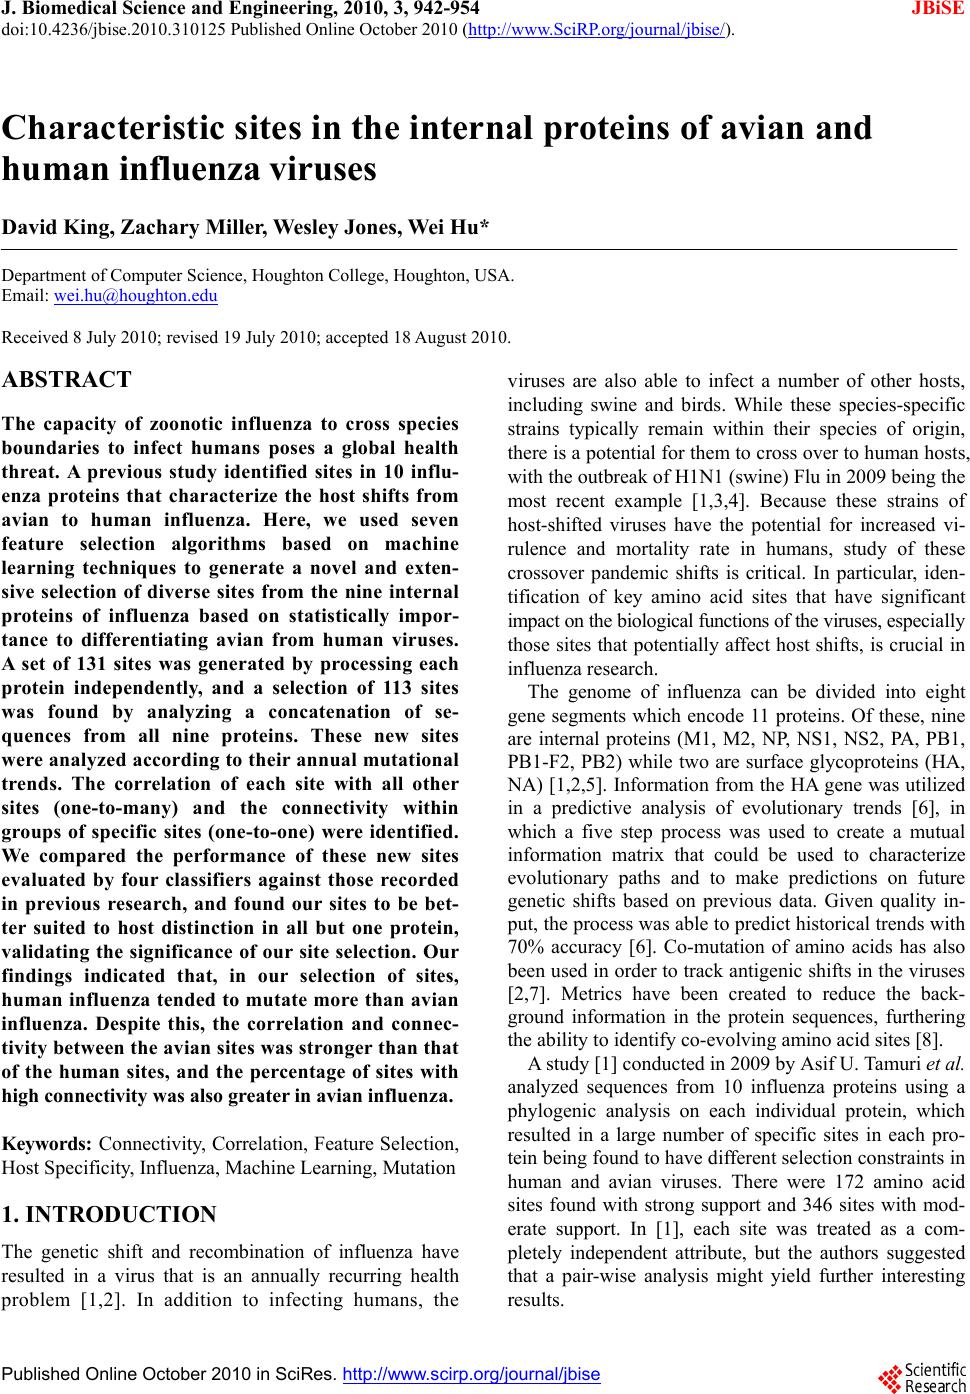
Journal Menu >>
 J. Biomedical Science and Engineering, 2010, 3, 942-954 JBiSE doi:10.4236/jbise.2010.310125 Published Online October 2010 (http://www.SciRP.org/journal/jbise/). Published Online October 20 10 in SciRes. http://www.scirp.org/journal/jbise Characteristic sites in the internal proteins of avian and human influenza viruses David King, Zachary Miller, Wesley Jones, Wei Hu* Department of Computer Science, Houghton College, Houghton, USA. Email: wei.hu@houghton.edu Received 8 July 2010; revised 19 July 2010; accepted 18 August 2010. ABSTRACT The capacity of zoonotic influenza to cross species boundaries to infect humans poses a global health threat. A previous study identified sites in 10 influ- enza proteins that characterize the host shifts from avian to human influenza. Here, we used seven feature selection algorithms based on machine learning techniques to generate a novel and exten- sive selection of diverse sites from the nine internal proteins of influenza based on statistically impor- tance to differentiating avian from human viruses. A set of 131 sites was generated by processing each protein independently, and a selection of 113 sites was found by analyzing a concatenation of se- quences from all nine proteins. These new sites were analyzed according to their annual mutational trends. The correlation of each site with all other sites (one-to-many) and the connectivity within groups of specific sites (one-to-one) were identified. We compared the performance of these new sites evaluated by four classifiers against those recorded in previous research, and found our sites to be bet- ter suited to host distinction in all but one protein, validating the significance of our site selection. Our findings indicated that, in our selection of sites, human influenza tended to mutate more than avian influenza. Despite this, the correlation and connec- tivity between the avian sites was stronger than that of the human sites, and the percentage of sites with high connectivity was also greater in avian influenza. Keywords: Connectivity, Correlation, Feature Selection, Host Specificity, Influenza, Machine Learning, Mutation 1. INTRODUCTION The genetic shift and recombination of influenza have resulted in a virus that is an annually recurring health problem [1,2]. In addition to infecting humans, the viruses are also able to infect a number of other hosts, including swine and birds. While these species-specific strains typically remain within their species of origin, there is a potential for them to cross over to human hosts, with the outbreak of H1N1 (swine) Flu in 2009 being the most recent example [1,3,4]. Because these strains of host-shifted viruses have the potential for increased vi- rulence and mortality rate in humans, study of these crossover pandemic shifts is critical. In particular, iden- tification of key amino acid sites that have significant impact on the biological functions of the viruses, especially those sites that potentially affect host shifts, is crucial in influen z a research. The genome of influenza can be divided into eight gene segments which encode 11 proteins. Of these, nine are internal proteins (M1, M2, NP, NS1, NS2, PA, PB1, PB1-F2, PB2) while two are surface glycoproteins (HA, NA) [1,2,5]. Information from the HA gene was utilized in a predictive analysis of evolutionary trends [6], in which a five step process was used to create a mutual information matrix that could be used to characterize evolutionary paths and to make predictions on future genetic shifts based on previous data. Given quality in- put, the process was able to predict historical trends with 70% accuracy [6]. Co-mutation of amino acids has also been used in order to track antigen ic shifts in the viruses [2,7]. Metrics have been created to reduce the back- ground information in the protein sequences, furthering the ability to identify co-evolving amino acid sites [8]. A st udy [ 1] cond uct ed in 2 009 by Asif U. Tamuri et al. analyzed sequences from 10 influenza proteins using a phylogenic analysis on each individual protein, which resulted in a large number of specific sites in each pro- tein being found to have different selection con straints in human and avian viruses. There were 172 amino acid sites found with strong support and 346 sites with mod- erate support. In [1], each site was treated as a com- pletely independent attribute, but the authors suggested that a pair-wise analysis might yield further interesting results.  D. King et al. / J. Biomedical Science and Engineering 3 (2010) 942-954 Copyright © 2010 SciRes. JBiSE 943 In addition to the ph ylogen ic analysis co nducted in [1 ], a paper [3] published in 2009 by Jonathan Allen et. al. reported the use of linear support vector machines (SVMs), a machine learning technique, to evaluate hu- man and avian influenza protein sites as markers for high mortality rate and host specificity. Combined, these two characteristics were indicators of potential pand emic outbreak of avian influenza in human hosts. A set of 34 amino acid markers associated with both of these traits was found. Further, the study demonstrated that current recombinations of avian an d H1N1 strains of human and swine influenza could attain these pandemic markers with a double reassortment and two amino acid muta- tions. A project [2] conducted by Xiangjun Du, et. al. fo- cused on the relationships between nucleotide positions in the eight gene segments comprising the entire influenza genome. A value Ci,j was used to calculate the co-occur- rence of a pair of nucleotides occurring at sites i and j. Another value, the K-Value, made use of Ci,j to evaluate the connectivity within a gene sequen ce (Ci,j and a modi- fied version of the K-Value are defined in Subsection 2.3). The averaged K-Values of different influenza gene sequences were evaluated according to year, which showed the trends of nucleotide substitution co-occur- rence against the passing of flu-seasons. The analysis in [2] showed that the methodology of generating co-occurrence networks was an effective tool for tracking influenza’s evolutionary patterns. Interestingly, the study implied that there was a correlation between nucleotide co-occurrence and virus antigenicity, where 86% of the pairs shared both connectivity clusters and antigenicity clusters. The design of our study was inspired by the work of [1-3]. It was our intention in this project to use seven feature selection algorithms based on machine learning techniques to discover a diverse set of widely distributed sites in each of the nine internal proteins of avian and human influenza, as well as a set selected competitively from a concatenation of all nine sequences. The muta- tional trends of these sites were analyzed, as was the site correlation using the connectivity and co-occurrence metrics described in [2]. Finally, connectivity networks of related sites within each individual protein and be- tween all nine internal proteins were generated. 2. MATERIALS AND METHODS 2.1. Protein Sequence Data Three sets of avian and human influenza protein se- quences were used in the current study, all selected from the National Influenza Virus Database, managed by The National Cen t er for Biotechnology Inf ormation. In order to establish a baseline of comparison with previous studies, the first sequence set, hereafter referred to as sequence set A, was the same as that used in [1]. Sequence set A included aligned full-length sequences from 10 influenza proteins (HA, NA, M1, M2, NP, NS1, NS2, PA, PB1, PB2). Near-duplicate sequences (those 95% similar to already-included sequences), were not included. This resulted in each protein having around 400 to 500 s equences. A second set, hereafter referred to as sequence set B, was formed to evaluate comparatively the connectivity across all nine internal proteins. Sequences from each protein (M1, M2, NP, NS1, NS2, PA, PB1, PB1-F2 and PB2) were aligned using the MAFFT multi-sequence alignment tool (available at http://mafft.cbrc.jp/align- ment/server/index.html), and divided according to host species. Protein sequences with common identifiers were concatenated in the order given above to create a set of protein sequences spanning all nine internal proteins. Positions that contained gaps in the majority of se- quences were eliminated, leaving a set of 2286 concate- nated sequences of length 3520. Lastly, a third sequence set, hereafter referred to as sequence set C, was included to allow for time- depend- ant analysis. Because sequence set B was constructed based on common sequence identifiers among all nine proteins, there were not enough sequences from each year to conduct a statistically reliable analysis. Sequence set C included roughly 3000 to 5000 full length se- quences from each internal protein. 2.2. WEKA Feature Selection In order to identify the sites significant to species dis- tinction, a feature selection was performed. To reduce the bias from a particular feature selection algorithm, seven algorithms from the data mining utility WEKA [9] were employed in our analysis. The algorithms used were: Chi-Squared, Information Gain, Information Gain Ratio, 1R, Relief, Symmetrical Uncertainty and Filtered Attribute Evaluation. In the current study, the features to be selected were the amino acid sites in the protein se- quences. Chi-Squared feature selection uses the Chi-Squared test to select the best discriminating features between positive and negative examples [10]. Both Information Gain and Information Gain Ratio construct decision trees to determine their selections. Information Gain decision trees use the Kullback-Leibler divergence (of- ten called information gain) to build the tree, while In- formation Gain Ratio decision trees use a slight modifi- cation of the Kullback-Leibler divergence that keeps the selection from focusing on features with large pools of potential values [11]. The 1R algorithm is different than most other feature selection algorithms because it ranks the features ac- cording to the error rate rather than using entropy-based  D. King et al. / J. Biomedical Science and Engineering 3 (2010) 942-954 Copyright © 2010 SciRes. JBiSE 944 measures. The algorithm chooses the most informative feature and interprets the rest of the data based on this one features [12]. Relief ranks features by their ability to discriminate between neighboring patterns [13]. Sym- metric Uncertainty evaluates the weighted mutual in- formation of two features. Filtered Attribute Evaluation simply allows for an arbitrary filter to be used to evalu- ate features; in this instance, the Ranker filter, provided by WEKA, was used. 2.3. Co-Occurrence and K-Value The evaluation of co-occurrence and connectivity be- tween amino acid sites was performed through two measurements. The original versions of these metrics were used in [2], however one of them has been modi- fied slightly to better serve the p urposes of this analysis. Ci,j, which measures the co-occurrence between two amino acids x and y at a pair of sites i and j respectively, can be defined as 2 , (, ) * ij ij ij fxy C f xfy where f(xi) is the frequency of amino acid x occurring at position i, f(yj) is the frequency of amino acid y occur- ring at position j, and f(xi,yj) is the frequency of both occurring in the same sequence. The range of the value produced is, where 1 means perfect co-occurrence of xi and yj. While [2] used these values to construct connec- tivity matrices, wherein only pairs of sites with perfect co-occurrence would receive an edge between them, all pairs are utilized in this study, and the Ci,j value is used as a weight, such that those pairs with greater co-occur- rence contribute more to the total connectivity. The K-Value, Ki, which measures the average co-occurrence value of all amino acid pairs involving site i can be given as: , 1 1*, * m iijij j K Cnxy lm where l is the sequence length, m is the number of se- quences, and n(xi,yj) is the number of occurrences of both amino acids x and y at the sites i and j occurring together. In [2], the K-Value was used to represent the average connectivity o f all sites within a single sequence, however in this study; the formula was modified to rep- resent the connectivity of a single site to all other sites in all sequences in a given sequence set. 3. RESULTS AND DISCUSSION 3.1 Important Sites for Distinguishing Avian from Human Viruses The original selection of sites important to distinguishing host species was the critical foundation for the subse- quent work in this study. Using amino acid sites as fea- tures for the seven WEKA feature selection algorithms (Subsection 2.2), two selections of sites were generated: one based on sequence set A and one based on sequence set B. For the selection based on sequence set A, the inter- section of the top 25 sites generated by each algorithm was taken for each protein. The number of sites selected by the different algorithms varied; on average, 15 sites were selected from each protein, for a total of 131 sites over all the proteins . This selection will subsequently be referred to as the individually selected sites (Table 1). In order from most to least, the number of sites se- lected from each protein was as follows: NP(22), PB2( 1 9 ), M2(18), PA(17), NS1(12), PB1(12), PB1- F2(11), M1(10), NS2(10). The frequency of amino acid substitution at these sites (Ta b l e 1 ) showed the avian strains generally had less amino acid variation than the human strains: the avian and human proteins maintained site conservation averages of 94.2 and 80.9 respectively. The avian protein with the most conserved sites was NP with a site con- servation average of 99.8, compared to human NP, with a conservation aver age of 87.2. PB1-F2 sites showed the lowest site conservation average for avian (76.8). The proteins that contained the highest and lowest site con- servation averages for human influenza were M2 with a site conservation average of 89.1, and PB1 with a site conservation average of 60.2 respectively. The same process was followed for the selection of sites for sequence set B, which contained full-length concatenated sequences. The intersection of the top 150 sites selected by the seven algorithms yielded 113 sig- nificant sites in sequence set B. Of these 113, 89 were also part of the individually selected sites (marked in Table 1). Those that were distinct from the individually selected sites included: NP:136, NP:535, NP:450, NS 1: 59 , NS1:70, NS1:84, NS1:166, NS1:171, PA:142, PA:184, PA:272, PA:277, PA:231, PA:383, PA:385, PA:387, PA:400, PA:668, PB1-F2:73, PB1-F2:76, PB1-F2:79, PB1-F2:87, PB2:67 and PB2:292. This selection will be hereafter referred to as the concatenated selected sites. Because the concatenated selected sites were based on full-length concatenated sequences, all sites were treated equally, regardless of which protein they were located in. When selected competitively, we found some proteins to be more essential to determining host species than others. The number of sites selected from each individual pro- tein was: PA(25), NP(21), PB2(20), M2(14), NS1(13), PB1-F2(8), M1(5), PB1(4) and NS2(3). In addition to the raw number of sites each protein contributed, the total percentage of the sites in each protein selected was also considered. The percentages selected from each protein, in order from greatest to least, were: M2(14.4%),  D. King et al. / J. Biomedical Science and Engineering 3 (2010) 942-954 Copyright © 2010 SciRes. JBiSE 945 PB1-F2(8.9%), NS1(5.7%), NP(5.0%), PA(2.9%), PB2 (2.6%), NS2(2.5%), M1(2.0%) and PB1(0.5%), suggesting certain proteins contained more sites informative to host origin. Notably, the proteins containing the highest per- Table 1. Important Sites for distinguishing avian from human viruses. Site Avian Freq. Human Freq. Site Avian Freq. HumanFreq. Site Avian Freq. Human Freq. M1 99(Avg) 81.9(Avg) 375*^ D 100 E(G,V,D)66(22,10,2)552*^M 100 S(T) 99(1) 115*^ V(M) 98(2) I(V) 99(1) 421 E 100 D(E) 66(34) PB1 99.7 60.2 121* T 100 A 100 422* R 100 K(R) 87(13) 212*L 100 L(V) 51(49) 137*^ T 100 A(T) 99(1) 423* A 100 S(T,P,A)45(34,18,3)327*R 100 R(K) 51(49) 147 V 100 V(I) 90(10) 442* T 100 A(T) 87(13) 336*V 100 I(V) 62(38) 167 T(A) 98(2) T(A) 57(43) 455* D 100 E(D) 87(13) 361 S 100 S(R) 59(41) 205 V 100 V(I) 71(29) NS1 90.1 84.9 473 V 100 V(L) 66(34) 218* T 100 A(T,V) 82(17,1) 21* R(L) 85(15) Q(R) 85(15) 486 R 100 R(K) 70(30) 227* A 100 A(T) 73(27) 22* F(L) 85(15) V(I,F) 95(3,2) 576 L(I) 98(2) L(I) 62(38) 231^ D(N) 96(4) D(N) 84(16) 23 A(S) 85(15) V(A) 58(42) 581*E 100 E(D) 63(37) 239 A(T) 98(2) A(T) 64(36) 53 D 100 D(N) 54(46) 584^R(H) 98(2) R(Q,H) 65(34,1) M2 95.1 89.1 60* A(E) 75(25) V(A) 91(9) 645 V 100 V(M,I) 68(28,4) 11* T(I) 98(2) I(T) 97(3) 81*^ I(-,T) 94(4,2) M(-) 99(1) 654 S 100 S(N,I) 66(32,2) 14* G(E) 96(4) E 100 98 M(I) 85(15) L(M) 57(43) 768 A 100 S(T,A) 39(31,30) 16* E(G) 96(4) G(E) 96(4) 114* S(G) 79(21) P 100 PB1-F2 76.8 67 18* K(R,S) 64(34,2) R 100 125 K(R) 99(1) K 100 3 Q(R,-) 53(44,3) Q(-) 98(2) 20* S(N) 98(2) N 100 196* E(-) 98(2) K(E) 84(16) 6 D(G,-) 85(13,2) G(D,-) 79(19,2) 28* I(V,F,T) 78(18,2,2) V(I) 90(10) 215*^ P(-) 98(2) T 100 23 N(S,-,D) 59(38,2,1) S(D,-,N)67(29,2,2) 36 L 100 L(V) 96(4) 227*^ E(-) 98(2) R(-,E) 96(3,1) 27* T(I,-) 94(4,2) I(T,-) 78(20,2) 43 L 100 L(I) 96(4) NS2 89 82 29* R(K,-) 66(31,3) K(R,-) 95(3,2) 48 F 100 F(S) 96(4) 14 M(Q,T,V)77(19,2,2)L(M,V)60(37,3)59* K(R) 97(3) R(-,K) 62(29,9) 50 C 100 C(S) 96(4) 26 E(V,A)87(11,2)E(G) 94(6) 60* Q(R,-,P) 95(2,2,1) L(-,P,Q) 55(29,8,8) 54* R(C) 98(2) L(F,R,I) 53(36,7,4) 37 S(R) 87(13) S 100 62 L(P,-) 95(4,1) P(-,L) 52(30,18) 55* L(F,I) 93(5,2) F(L) 96(4) 55 L(F) 98(2) L(I,F) 96(2,2) 66 S(N,-,I) 57(41,1,1) N(-,S) 69(30,1) 57* Y 100 H(Y,R) 90(9,1) 57 S 100 S(L) 59(41) 70 G(E,V) 53(44,3) G(-,V,E)39(30,27,4) 78* Q 100 K(E,T) 89(10,1) 60 S(N,I) 79(13,8)N(S,H,T,I)92(3,3,1,1)82 L(S,-) 91(7,2) S(-,P,L) 43(31,14,12) 82* S(N) 95(5) N(S) 51(49) 70* S 100 G(S) 97(3) PB2 98.9 88 86* V 100 A(V) 97(3) 86 R(I) 87(13) R(K) 80(20) 9* D 100 N(D,T) 96(3,1) 89* G(S) 96(4) S(G,D) 79(18,3) 89* I(K,V,M)75(19,4,2)T(I,V) 56(43,1)44*^A 100 S(A) 90(10) 93*^ N 100 S(N) 81(19) 107* L 100 F(L) 86(14) 64* M(I) 96(4) T(M,I) 96(2,2) NP 99.8 87.2 PA 99.1 88.4 81* T 100 M(V,T,I)91(4,3,2) 16* G 100 D 100 28* P(T) 95(5) L(P) 96(4) 105*^T 100 V(M,T,I)60(36,3,1) 31* R 100 K(R) 94(6) 55* D 100 N(D) 96(4) 114 V 100 V(I) 57(43) 33* V 100 I(V) 96(4) 57* R 100 Q(R) 97(3) 199*^A 100 S(A) 99(1) 61* I 100 L 100 65* S(F) 95(5) L(P,S,F)87(9,3,1)271*T(A) 96(4) A(T) 94(6) 100* R 100 V 100 66* G 100 D(G,E)76(17,7)368*R(Q) 98(2) K(R) 86(14) 109* I(T) 95(5) V(I) 84(16) 100* V(I) 95(5) A 100 453*P(S,T) 96(2,2) H(P,S) 71(27,1) 127 E 100 D(E) 81(19) 225* S 100 C(S) 90(10) 475*^L 100 M(L) 99(1) 146 A 100 T(A) 79(21) 241 C 100 Y(C) 51(49) 567*D(V) 98(2) N(D) 99(1) 214* R 100 K(R) 97(3) 268* L 100 I(L) 86(14) 588*A(T) 98(2) I(A,V) 94(3,3) 283*^ L 100 P(S) 99(1) 312 C 100 R(K) 83(17) 613*^V 100 T(A,V,I)90(6,3,1) 293* R 100 K(R) 84(16) 337* L 100 S(A) 97(3) 627*^E(K) 98(2) K 100 305*^ R 100 K(R) 91(9) 356*^ K 100 R(K) 87(13) 661*^A 100 T(A,V) 90(9,1) 313* F 100 Y(F) 99(1) 382* V 100 D(E) 94(6) 674*A 100 T(A,P) 96(3,1) 351 R 100 K(R) 93(7) 404* R 100 S(A) 90(10) 684*^A 100 S(A,D) 67(31,2) 357*^ Q 100 K(R,Q) 94(5,2) 409* W 100 N(S) 97(3) 702*^K 100 R(K) 97(3) 372* E 100 D(E) 90(10) 421* T 100 I(V,S,T)76(11,9,4)Average 94.2(Avian) 80.9(Human) The table co ntains the in dividually s elected sites, wi th those sites t hat are also in the concatenat ed selected si tes marked with a "*". The avian and human col- umns show the consensus amino acids and their frequencies. Sites marked with a "-" signify a gap in the protein sequence alignment and "^" shows that the selected sites also occur in [1].  D. King et al. / J. Biomedical Science and Engineering 3 (2010) 942-954 Copyright © 2010 SciRes. JBiSE 946 centage of sites critical to host differentiation were those with the shortest sequ ence length (M2 and PB1-F2), and the protein with the longest sequence length had the lowest percentage of sit es (PB 1). 3.2. Performance of Classification of the Individually S e le c t e d Si te s To validate the statistical significan ce of our individu ally selected sites, we compared them with the sites reported in [1]. Four classifiers provided by WEKA were used to assess the ability of these two sets of sites to differentiate avian from human viruses: Support Vector Machine, Naive Bayes, Random Forest and Rotation Forest. Pro- tein sequences from sequence set A were used in this comparison, as both our individually selected sites and the sites reported in [1] were generated using this se- quence se t. Support Vector Machines are machine learning tech- niques which, in binary classification, calculate the op- timal separating hyperplane between two data sets [14,15]. The Naive Bayes classifier uses probability to associate each independent feature with a particular class. The classifier then takes the product of the individual probabilities and classifies the instance [16]. The Ran- dom Forest constructs a number of decision trees, using a random subset of the training dataset for each. The resulting forest of decision trees represents the final en- semble classifier where each decision tree votes for the final classification, and the majority decision wins [17]. The Rotation Forest classifier randomly splits the entire data set into N training subsets, and applies the Principle Component Analysis (PCA) to each. A N axis rotation is used to select the new features for a base classifier [18]. The performance of the classifiers was calculated by the sensitivity, specificity, overall accuracy (Q2) and the Matthews correlation coefficient (MCC) expressions, defined as: TP Sensitivity TP FN , TN Specificity TNFP , 2TP TN QTPFP TNFN , ** *** TP TNFPFN MCC TN FNTN FPTPFNTPFP where TP is the number of true positives, TN is the number of true negatives, FP is the number of false posi- tives, and FN is the number of false negatives. The re- sults of these calculations for all four classifiers were averaged (Table 2), attesting that our individually se- lected sites were, with the exception of those from the NP protein, better able to determine the host species than those reported in [1]. Because [1] did not provide a se- lection of sites for NS2 and PB1-F2, these two proteins could not be com p ar ed . 3.3. Annual Mutational Trends of Individually Selected Sites In order to determine the mutational trends of the indi- vidually selected sites, the amino acids at these sites in sequence set B were concatenated based on protein to form nine sets of subsequences with equal size. Se- quence set A was not used because there were not enough sequences per year. These subsequences were grouped and a consensus sequence was taken with re- spect to each year. The annual consensus sequences were then used to generate a consensus of all the years for each protein. The percentage of sites in each annual consensus that differed from the all-year consensus was recorded. As can be seen in the plots of Figure 1, avian influ- enza tended to have very low deviation values, often Table 2. Performance metrics of WEKA classifiers on individually selected sites vs. sites in [1]. Performance Metrics for Sites Published in [1]. M1(4) M2(2) NP(13) NS1(4) NS2(0) PA(2) PB1(3) PB1-F2(0) PB2(13) Sensitivity 0.9890 0.9269 0.9992 0.9897 0.9930 0.9059 0.9954 Specificity 0.9827 0.9751 1.0000 0.9830 0.9951 0.8640 1.0000 Q2 0.9873 0.9433 0.9994 0.9886 0.9933 0.8961 0.9963 MCC 0.9668 0.8807 0.9986 0.9580 No Data 0.9723 0.7311 No Data 0.9883 Performance Metrics for Our Individually Selected Sites M1(10) M2(18) NP(15) NS1(9) NS2(10) PA(17) PB1(12) PB1-F2(11) PB2(19) Sensitivity 0.9958 0.9928 0.9976 0.9960 0.9870 0.9978 0.9643 0.9154 0.9969 Specificity 0.9926 0.9985 1.0000 0.9877 0.9729 1.0000 0.9924 0.9870 1.0000 Q2 0.9949 0.9949 0.9983 0.9946 0.9835 0.9981 0.9713 0.9610 0.9975 MCC 0.9868 0.9893 0.9957 0.9804 0.9546 0.9927 0.9280 0.9154 0.9922 These tabl es d i splay the accur acy of the WEKA classification i n comparison to the sites r ecorded in [1 ] b y p er forming the cal cu lations for sensitivity, specificity,  D. King et al. / J. Biomedical Science and Engineering 3 (2010) 942-954 Copyright © 2010 SciRes. JBiSE 947 overall accuracy (Q2) and the Matthews correlation coefficient (MCC). differing from year to year by only a single site’s worth of variance. Additionally, within the avian proteins, many years displayed no deviation whatsoever. This lead to curves that tended to be constant with occasional spikes of deviation. On average, 58.9% of the annual avian consensus sequences matched the all-year con- sensus perfectly. The avian proteins which produced the lowest deviation values on average were PB1 with 0.5%, followed by PB2, PA, and M1 with 1.0%, 0.9%, and 0.9% respectively. The proteins with the highest devia- tion values were NS1, NS2, and PB1-F2: they averaged 13.6%, 7.9%, and 9.4% respectively. Human influenza produced curves that were more va- ried, with distinctly higher deviation values. On average there was 13.7 times more deviation in human influenza than there was in avian. The proteins with the lowest deviation were M2 with 7.3% and NS2 with 8.7%, and the proteins that displayed the highest were PB1-F2, NS1 and PB1, with 29.1%, 25.5% and 25.4% respec- tively. Human influenza also had far fewer annual con- sensus sequences that matched the all-year consensus perfectly: only 7.5%. A comparative analysis of avian and human trends was also performed. While both PB1-F2 and NS2 were highly varied in both, other proteins showed distinct patterns. PB1 was one of the most varied proteins in human influenza, but one of the least in avian, with the human having 44.1 times the deviation of the avian, compared to only 1.2 times for NS2. Human influenza was clearly more varied: in no protein was the average deviation for avian greater than it was for human. There were, however, specific annual consensuses wherein the deviancy of the avian was greater than that of the human. For instance in 1971 the avian deviation of NS1 was 89.3%, the highest deviation for any one protein at any one year, while the human deviation was 3.6%. This occurred rarely, and the dramatic disparity in NS1 in 1971 was the extreme case. 3.4. Correlation of Sites in Proteins According to Year In Subsection 3.3, the annual mutational trends of the individually selected sites were analyzed. The current section analyzes the correlation patterns of amino acid pairs according to year. Because the correlation metrics used require a greater number of sequences than our mutational trends, sequence set B was not used for this analysis, despite the benefit of having the same number of sequences in each protein. The protein sequences in sequence set C were separated according to year. If the two sites i and j are conserved, Ci,j is an value of 1.0. Thus, all sites that were conserved in a given year were removed from the sequences from that year, leaving only those sites that were variable. The K-Value Ki was cal- culated for each variable site i for each year, using all other variable sites in the K-Value formula. The aver- aged K-Values of these sites in each protein were used as the K-Value of that protein for that year. We stan- dardized the K-Values according to the mean and stan- dard devi a t ion. The contrast between avian and human influenza can be seen in Figure 2, Plot A. Human influenza had higher K-Values than avian influenza across all years except 1986. Further, the patterns of correlation in each of the human influenza proteins were very similar to one an- other (Figure 2, Plot B), while those of avian influenza were much more diverse. In human influenza, when the K-Value of one protein was high, the others tended to be high, and vice versa. The proteins of avian influenza produced much more varied K-Value distributions. While there were few similarities between all nine pro- teins, we found three groups of proteins that had K-Value distributions similar to one another, these being [PA, PB1, PB2], [M1, M2, NP] and [NS1, NS2, PB1-F2 ]. These can be seen in Figure 2, Plots C through E. The [PA, PB1, PB2] group was especially interesting, as these three proteins make up the polymerase complex of influenza, which is essential for the replication and tran- scription of the influenza viruses. 3.5. Correlation of Sites in Proteins for All Years To expand the year-dependant study of the patterns of correlation of sites within each protein in Sub section 3.4, the patterns were also analyzed for all years. Unlike in Subsection 3.4, where all variable sites were us ed, in th is analysis only a certain percentage of variable sites in each protein were included. Because of the different mutation rates of avian and human influenza (Figure 1), a different cutoff was applied to each. For the avian se- lection, the 33% most variable sites were selected from the individually selected sites, while the top 20% were used for the human. These selections were subsets of the individually selected sites and from hereafter will be referred to as the I-sites. Correlation was evaluated both for I-site pairs exclusively within individual proteins as intra-protein K-Values, and for I-site pairs between pro- teins as inter-protein K-Values. Both calculations of K-Value were performed using the I-sites from sequence set B (Table 1). There were significant distinctions between both the intra- and inter-correlation of avian and human I-sites. While correlation in human influenza was fairly uniform in all proteins, with K-Values predominantly remaining between 0.5 and 0.6, avian influenza tended to be more variable, with values commonly ranging as low as 0.4 and as high as 0.8. Further, sites within avian proteins typically had similar correlation values; for instance, PA, PB1, and M1 ha consistently high K-Values for all sites,  D. King et al. / J. Biomedical Science and Engineering 3 (2010) 942-954 Copyright © 2010 SciRes. JBiSE 948 Figure 1. Annual mutational trend of individually selected sites.  D. King et al. / J. Biomedical Science and Engineering 3 (2010) 942-954 Copyright © 2010 SciRes. JBiSE 949 Plot A shows the average K-Values of all the proteins for both avian and human-host influenza. Plots B through E show the K-Values for the specific pro- teins of both human and avian hosts. Plot B shows all human-host proteins, which had similar patterns of K-Value distribution. Avian proteins yielded K-Value curves less similar to one another, and have been split into three different plots (C through E) for clarity. Figure 2. Average standardized K-Value of proteins according to year.  D. King et al. / J. Biomedical Science and Engineering 3 (2010) 942-954 Copyright © 2010 SciRes. JBiSE 950 while PB1-F2 had low values. On the other hand, while there were individual sites that deviated from the norm in human influenza, these tended to not be grouped by protein; for example, the PB1 protein in human housed both the site with the second highest K-Value (PB1:336 with an average value of 0.688) and the site with the lowest K-Value (PB1:79 with an average value of 0.386). Although both the intra- an d inter-protein correlations are similar in all proteins for both avian and human in- fluenza, the average distance between the inter- and in- tra-protein K-Values varied: 0.060 for avian, and only 0.024 for human. The K-Value gain from intra- to in- ter-K-Values was calculated such that positive numbers would represent an increase, and negative numbers a decrease; then the average was taken for each protein (Figure 3). Human K-Value gain was typically positive, indicating that human influenza tended to have higher correlation between proteins than within proteins. In contrast, avian inter-protein K-Value gain was typically negative, indicating that correlation was stronger within specific proteins than between proteins. Despite this, avian influenza had higher K-Values, indicating higher correlation, than human influenza, in both inter- and intra-proteins. This was different from the results re- ported in 3.4, where it was observed that annual correla- tion, which was measured by the K-Value of the se- quences in a particular year, was higher in human influ- enza than in avian (Figure 2). This indicated that the contribution of correlation between sequences in differ- ent years was significant. In both human and avian, an exception to this trend was the PB1-F2 protein, where the trend of hu- man-positive and avian-negative K-Value gain was re- versed : th e av er ag ed K- Value gain fo r P B1 -F2 was 0. 016 , while the averaged human K-Value gain was –0.088, indicating that in PB1-F2 avian influenza had greater correlation outside the protein than within, and vice ver- sa for human influenza. Averaged human K-Value gain was negative in NS1 and PB1 as well. These three pro- teins were also found to have the highest annual variabil- ity of any of the human proteins, as seen in Table 2. 3.6. Site-Connectivity Networks In the previous several sections, the correlations between one site and other related sites (one-to-many) were de- tected. In this section, specific associations between one site and another single site (one-to-one) from sequence set A, the set of individual-protein sequences, were ana- Plots A and B were generated by calculating K-Values for each of the I-sites. The inter-protein K-Values were calculated using pairings with all I-sites from all nine proteins, while the intra-protein K-Values include only pairings within a single protein - for instance, the site M1:167 would only be paired with amino acid sites that are also in M1. All site positions are given relative to the starting position in their containing protein. Plot C shows the K-Value gain per protein from plots A and B, such that positive values indicate that the inter-protein K-Values are higher than the intra-protein K - Values, and negative vice versa. Avian K-Value gain is consistently lower than human, with the exception of PB1-F2. Figure 3. Avian and human K-Values produced by inter- and intra-protein analysis.  D. King et al. / J. Biomedical Science and Engineering 3 (2010) 942-954 Copyright © 2010 SciRes. JBiSE 951 Figure 4. Amino acid connectivity networks.  D. King et al. / J. Biomedical Science and Engineering 3 (2010) 942-954 Copyright © 2010 SciRes. JBiSE 952 lyzed. Connectivity networks between correlated sites were generated by calculating the co-occurrence Ci,j be- tween two different sets of amino acid sites. The first consisted of the I-sites described in Subsection 3.5. The second set acted as a baseline of comparison, containing all sites in each protein that displayed any variation whatsoever, hereafter referred to as B-sites. This allowed connections to be formed not only between two sites deemed to be important (between two I-Sites), but also between an importan t site and a variable site that had not been previously selected by WEKA (between an I-site and a B-site). Co-occurrence values were calculated for all amino acid pairs such that one site of the pair belonged to the first set, and the other site belonged to the second. The connection strength between the site-pairs was the sum- mation of the co-occurrence values of all amino acid pairs occurring at those sites. To retain the most signifi- cantly connected sites, only the sites associated with the four strongest connections to each of the I-sites were included. Further, any B-sites that had only a single connection within the networ k we re removed. As seen in Figure 1, human influenza tended towards higher variance, leading to a greater number of sites be- ing selected by our procedure despite the more rigorous cutoff limit, as described in Subsection 3.5. The network graphs in Figure 4 indicated that while human influenza had more variable positions than avian, the average number of sites in each graph was almost equal: 7.625 sites per graph for human, and 7.429 for avian. The rea- son for this was that the human connectivity networks tended to be more reflexive, having more connections between the I-sites. The avian, on the other hand, tended to be less reflexive, having more connections to B-sites, those not found by WEKA. In other words, human I-sites tended to co-mutate among themselves, while the avian I-sites tended to co-mutate with sites that, while still variable, were not statistically importan t to host dif- ferentiation. 3.7. Protein-Connectivity Networks A process similar to that of Subsection 3.6 was also ap- plied to the concatenated sequences of sequence set B. The connectivity between the nine internal proteins was our goal in this section, rather than the one-to-one con- nectivity between sites. Three sets of sites were used in this portion of the study: the I-sites from Subsection 3.5, the B-sites from Subsection 3.6, and a set of all variable sites in the concatenated selected sites, hereafter referred to as C-sites. Two sets of networks were generated: one connecting the I-sites and B-sites, and another connect- ing the C-sites and B-sites. Because the B-sites included all variable sites, both the I- and C-sites were subsets of the B-sites. All B-sites were retained in sequence set B by remov- ing those sites that were conserved. Then, networks were generated by calculating Ci,j for all pairs such that site i was part of the co ntribu ting set I or C, and site j was part of the set of B-sites. For each pair of amino acid sites, the summation of all Ci,j values was taken, and a cutoff (the average of these summations) was applied such that the resulting value was 1 if greater than or equal to the cutoff, and 0 otherwise. Then the average value of all site pairs within a pair of proteins was taken, giving each pair of proteins a connectivity value between 0 and 1. The plots in Figure 5 represent the prot e in - c on n e ct i vi t y networks. The vertical axis indicates the B-sites, while the horizontal axis indicates the I- or C-sites. The col- umns, then, display the connectivity of the I- or C-sites to the B-sites, while the rows show the connectivity of the B-sites to the I- or C-sites. Because the B-sites were different than the I- and C-sites, these graphs are not symmetric. Lists of the I- and C-sites are provided in Table 3. The connectivity of the different sets of selected sites in these networks varied. Avian PB1-F2-I sites, for in- stance, had no connectivity whatsoever, while the avian PB1-F2-C sites showed high conn ectivity. The opposite Figure 5. Protein connectivity heat maps.  D. King et al. / J. Biomedical Science and Engineering 3 (2010) 942-954 Copyright © 2010 SciRes. JBiSE 953 Table 3. I-sites and C-sites used in Figure 5. Human (I) Human(C) Avian (I) Avian (C) M1 167, 205, 239 115^, 137, 227 219, 231 115^ M2 54^, 56, 82*, 89^ 11, 16, 28, 54^, 55^, 57, 78, 82*, 86, 89^, 93 55^, 82* 14, 16, 20, 54^, 55^, 82*, 89^ NP 217, 334, 343, 344, 353^, 373, 423^, 459 31, 33^, 109^, 214, 283, 293, 305, 313, 353^, 357, 372, 375, 422, 423^, 442, 450, 455 34, 109^ 33^, 109^ NS1 53, 56, 59, 84*, 166, 244 21, 22, 59, 60, 70, 81, 84*, 171, 196, 227 55, 60, 67, 70, 84* 21, 22, 59, 60, 70, 81, 84*, 166, 196, 215, 227 NS2 57, 89^ 89^, 107 48 PA 62, 184^, 241, 256, 322, 383^ 28^, 55^, 57, 65^, 66^, 142^, 184^, 268^, 272, 277^, 321^, 337, 356^, 382^, 383^, 385^, 387, 400, 404^, 409, 552^, 668^ 28^, 65^ 28^, 55^, 65^, 66^, 142^, 184^, 225, 268^, 277^, 321^, 356^, 382^, 383^, 385^, 404^, 421, 552^, 668^ PB1 52^, 212^, 327^, 336^, 361, 430, 741 212^, 327^, 336^, 581 52^, 75, 383 PB1-F 2 60*, 82 27^, 29, 59^, 60*, 73, 76^, 79, 87 27^, 59^, 60*, 76^ PB2 67^, 105^, 114, 120, 461, 526, 676 9, 44, 64^, 67^, 81, 105^, 199, 271^, 292^, 368^, 453^, 475, 567^, 588^, 613, 661, 674, 684, 702 64^, 271^, 292^, 453^ 64^, 271^, 292^, 368^, 453^, 567^, 588^, 627 This table shows the I- and C-sites for both human and avian influenza. Those sites marked with a "*" occur in all four instances, those marked with a "^ " o ccu r in two or three. was true for PB1, with PB1-C sites displaying no con- nections, and high connectivity in the PB1-I. There were commonalities between avian I- and C- sites, also: NS1 and NS2 sites yielded very low connectivity in both, while M1 and PA had very high connectivity. Similarly, in human influenza, both I- and C-sites of PB1-F2 displayed extremely low, and only mild connec- tivity for PA and NS1. NS2-C sites, on the other hand, displayed much higher connectivity than NS2-I. Other- wise, both I- and C-sites for human influenza were fairly normative, with typical connectivity values ranging be- tween 0.3 a nd 0.5. There were also differences between the avian and the human networks. While both NS1 and NS2 sites had very low connectivity in avian, the connectivity of hu- man NS1 and NS2 sites was moderate to high, with a very high connectivity value for NS2-I sites. In the same fashion, PB1-F2 sites were in general poorly connected, but the avian PB1-F2-C sites showed exceptionally high connectivity. In general, both avian I- and C-sites tended to have higher connectivity between proteins than human, which was consistent with the trend of avian influenza having more widespread connectivity within individual proteins noted in Subsection 3.6. Both of these findings were interesting in light of avian influenza’s relatively lower mutation rate, noted in Subsection 3.2. 4. CONCLUSIONS There were five main components in our findings. First, a diverse and extensive set of sites in nine internal pro- teins of avian and human influenza was identified through the use of seven feature selection algorithms. The validity of these sites was justified by the capability to differentiate between avian and human protein se- quences using four machine learning classifiers. Second, the mutational trends of these sites were analyzed, which signified that in general human influenza displayed higher mutation rates than avian. Third, by calculating the K-Values of these sites, it was found that in contrast to the higher mutation rate, the patterns of correlation in each of the human influenza proteins were very similar to one another, while those of avian influenza were much more diverse. When considered for all years, K-Values illustrated that avian site-correlation was on average higher than human site-correlation. Further, while the correlation of most individual human sites was very similar with occasional outliers, the correlation of avian sites was much more varied. Fourth, networks of correlated sites from each protein were generated, not only showing that avian connectivity tended to be higher, but also that the sites selected in avian networks tended to be more evenly distributed over the entire protein. Finally, connectivity heat maps were generated from the sites selected from concatenated sequences of all nine internal proteins, exhibiting the global trends of connec- tion across all the proteins. These findings suggest that in our site selection there is an inverse relationship between variability and con- nectivity within the nine internal proteins of avian and human influenza. Avian influenza showed consistently higher correlation and connectivity, reflected by co-occurrence and K-Value, than human, despite the significantly lower rate of mutation. Within individual proteins, there is a higher percentage of variable sites with high connectiv ity in avian than in human. The co n-  D. King et al. / J. Biomedical Science and Engineering 3 (2010) 942-954 Copyright © 2010 SciRes. JBiSE 954 tribution of connectivity between proteins to the overall connectivity of the nine proteins, however, is greater in human influenza than it is in avian. In conclusion, the sites we selected were significant in distinguishing avian and human viruses, and revealed the signatures of corre- lation and connectivity of the nine internal proteins, which reflected the characteristics of avian and human influe nz a v iruses. 5. ACKNOWLEDGEMENTS We would like to th ank th e Summer Research Institu te at Houghton College for the funding of this study. Addi- tionally, we would like to thank Asif Tamuri for provid- ing the data used in his previous study [1] as well as his helpful discussi on s. REFERENCES [1] Tamuri, A.U., Reis, M., Hay, A.J. and Goldstein, R.A. (2009) Identifying changes in selective constraints: Host shifts in influenza. PLoS Computational Biology, 5(11), e1000564. [2] Du, X., Wang, Z. and Wu, A., et al. (2008) Networks of genomic co-occurrence capture characteristics of human influenza A (H3N2) evolution. Genome Research, 18(1), 178- 187. [3] Allen, J., Gardner, S., Vitalis, E. and Slezak, T. (2009) Conserved amino acid markers from past influenza pan- demic strains. BMC Microbiology, 9, 77. [4] Furuse,Y., Suzuki, A., Kamigaki, T. and Oshitani, H. (2009) Evolution of the M gene of the influenza A virus in different host species: Large-scale sequence analysis. Virology, 6, 67. [5] Suzuki, Y. (2006) Natural selection on the influenza virus genome. Molecular Biology and Evolution, 23(10), 1902. [6] Xia, Z., Jin, G., Zhu, J.and Zhou, R. (2009) Using a mu- tual information-based site transition network to map the genetic evolution of influenza A/H3N2 virus. Bioinfor- matics, 25(28), 2309-2317. [7] Huang, J., King, C. and Yang, J. (2009) Co-evolution positions and rules for antigenic variants of human in- fluenza A/H3N2 viruses. BMC Bioinformatics, 10(1), S41. [8] Dunn, S.D., Wahl, L.M. and Gloor, G.B. (2008) Mutual information without the influence of phylogeny or en- tropy dramatically improves residue contact prediction. Bioinformatics, 24(3), 333-340. [9] Witten, I.H. and Frank, E. (2005) Data mining: Practical machine learning tools and techniques. 2nd Edition, Morgan Kaufmann Publishers, Massachusetts. [10] Cohen, A., Bhupatiraju, R. and Hersh, W. (2004) Feature generation, feature selection, classifiers, and conceptual drift for biomedical document triage. Proceedings of the Thirteenth Text Retrieval Confere nce , Gaithersburg, 1-6. [11] Quinlan, J.R. (1993) C4.5: Programs for machine learn- ing. Morgan Kaufmann Publishers, Massachusetts. [12] Holte, R.C. (1993) Very simple classification rules per- form well on most commonly used data sets. Machine Learning, 11(1), 63-90. [13] Kononenko, I. (1994) Estimating attributes: analysis and extensions of relief. Machine Learning: ECML-94, 784, 171-182. [14] Platt, J. (1999) Fast training of support vector machines using sequential minimal optimization, Advances in ker- nel methods: Support vector learning. MIT Press, Cam- bridge, Massachusetts. [15] Cortes, C. and Vapnik, V. (1995) Support-vector network. Machine Learning, 20(3), 273-297. [16] Domingos, P. and Pazzani, M. (1997) On the optimality of the simple Bayesian classifier under zero-one loss. Machine Learning, 29(2), 103-137. [17] Breiman, L. (2001) Random forests. Machine Learning, 45(1), 5-32. [18] Rodriguez, J.J., Kuncheva, L.I. and Alonso, C.J. (2006) Rotation forest: A new classifier ensemble method. IEEE Transactions on Pattern Analysis and Machine Intelli- gence, 28(10), 1619-1630. |