 Food and Nutrition Sciences, 2013, 4, 342-356 http://dx.doi.org/10.4236/fns.2013.43045 Published Online March 2013 (http://www.scirp.org/journal/fns) Study Bacteriocin Production and Optimization Using New Isolates of Lactobacillus spp. Isolated from Some Dairy Products under Different Culture Conditions Hoda Mahrous1*, Abeer Mohamed2, M. Abd El-Mongy2, A. I. El-Batal3, H. A. Hamza2 1Department of Industrial Biotechnology, Genetic Engineering and Biotechnology Research Institute, Menoufiya University, Shibin El Kom, Egypt; 2Department of Microbial Biotechnology, Genetic Engineering and Biotechnology Research Institute, Menoufiya University, Shibin El Kom, Egypt; 3National Center for Radiation Research and Technology, Cairo, Egypt. Email: *hmahrous7@yahoo.com Received October 8th, 2012; revised January 24th, 2013; accepted February 1st, 2013 ABSTRACT Lactobacilli belong to the group of lactic acid bacteria (LAB), that have several distinguished abilities such as produc- tion of lactic acid, enzymes such as β-Galactosidase and natural antimicrobial substances called bacteriocins. Bacterio- cin is a biopreservative agent potential of suppressing growth of some contaminant bacteria in food industry but its commercial availability is limited and costly. The study aimed to select isolates of Lactobacillu s spp. potential for pro- ducing bacteriocins to suppress the growth of Escherichia coli ATCC 25922 and Bacillus subtilis NCIB3610, and to optimize the process of bacteriocin production. Results obtained in this study showed that L. acidophilus isolate CH1 was selected as the best candidate for bacteriocin among the four isolates that tested. The largest amounts of the bacte- riocins were synthesized only in MRS medium was supplemented with K2HPO4 (1.0%), Tween 80 (1%), Beef extract (1%), glucose, cyctein and peptone extract (1%). The optimization of culture conditions for bacteriocin production areas showed that corn steep liquor medium was the best medium for all isolates against Bacillus subtilis while no effect was observed on Escherichia coli ATCC 25922 except when used MRS medium. The optimum conditions for bacteriocin production were pH 6.0, temperature 34˚C with 4% Phenyl acetamide showing the greatest growth inhibition areas. Keywords: Lactobacillus acidoph ilus; Lactic Acid Bacteria; Bacteriocins Production 1. Introduction Lactic acid bacteria (LAB) produce a number of antim- icrobial substances such as organic acids, free fatty acids, ammonia, reuterin, diacetyl, hydrogen peroxide and bac- teriocin, which have the capacity to inhibit the growth of food spoilage and pathogenic organisms [1]. Bacteriocins are proteinaceous and ribosomally synthesized antibacte- rial compounds produced by certain LAB during lactic acid fermentations that exhibit bactericidal activity against closely related species [2,3]. In recent years, a renewed interest in bacteriocin like activities has led to the dis- covery, isolation, and purification of bacteriocins from both gram-negative and gram-positive bacteria. They are now being considered for a variety of antimicrobial uses in foods and medicine [4]. Some bacteriocins produced by lactic acid bacteria, such as nisin, inhibit not only closely related species but are also effective against food- borne pathogens and many other gram-positive spoilage bacteria [5]. For this reason, bacteriocins have attracted considerable interest for use as natural food preservatives in recent years, which have led to the discovery of ever increasing potential sources of these protein inhibitors. LAB bacteriocins are divided into three main groups, based on their amino acid sequence, mode of action, heat tolerance, biological activity, presence of modified amino acids, and secretion mechanism. The classes I and II are further divided into subgroups, and the members of these classes are the most studied because they are so wide- spread among the LAB and due to their heat stability. The class III bacteriocins are heat-labile and therefore less interesting in the terms of food processing and pro- tection. Quite recently a new classification has been pro- posed by Cotter et al. [6]. In this scheme the most dra- matic change is the removal of class III bacteriocins to their own group of “bacteriolycins”, hence making the group of bacteriocins smaller and more strictly defined. Lactobacillus bacteriocins are found within each of the four major classes. Class I bacteriocins (antibiotics) were discovered in the lactobacillaceae by Mortvedt et al. [7]. These bacteriocins are small membrane-active peptids *Corresponding author. Copyright © 2013 SciRes. FNS  Study Bacteriocin Production and Optimization Using New Isolates of Lactobacillus spp. Isolated from Some Dairy Products under Different Culture Conditions 343 (<5 kDa) containing an unusual amino acids, lanthionine. The class II bacteriocins are small heatstable, non-lan- thionine containing and membrane-active peptides (<10 kDa). The class III bacteriocins, have been found in Lactobacillus, include heat labile proteins of large mo- lecular mass. The class IV bacteriocins are a group of complex proteins, associated with other lipid or carbohy- drate moieties, which appear to be required for activity. They are relatively hydrophobic and heat stable [8]. Different bacteriocin exhibits different inhibition pro- file on food spoilage and pathogenic microorganisms. Therefore, they could be natural replacements for syn- thetic food preservatives [9]. In order to increase the productivity of bacteriocins, a better understanding of factors affecting their production is essential. Bacteriocin production has been reported to be affected by several factors including carbon and nitrogen sources; and fer- mentation conditions, such as pH, temperature and agita- tion [9]. The optimization of bacteriocin production and en- hancement of its activity are economically important to reduce the production cost. Thus, the aims of this study were to formulate industrial media for bacteriocin pro- duction by four lactic acid bacteria isolates and the opti- mization of culture conditions for maximizing bacterio- cin production. 2. Materials and Methods 2.1. Isolation and Identification of Lactic Acid Bacteria The lactic acid bacteria were isolated from raw milk and Ras cheese, by appropriate dilutions with NaCl physio- logical. Dilutions (10−1 - 10−6) were prepared and plated on de Man Rogosa agar (MRS agar) medium (Hi Media Laboratory Pvt. Ltd. Mumbai, India) to isolate the Lac- tobacillus spp and incubated at 37˚C for 48 - 72 h [10]. The strains were sub-cultured onto MRS agar slant incu- bated at 30˚C for 24 h and preserved in 20% glycerol at −80˚C. One of the isolates was selected for further stud- ies. It exhibited strong inhibitory activity against indica- tor strains. It was identified on the basis of growth, cell morphology, gram staining and catalase activity. Further, identification was performed according to carbohydrate fermentation patterns and growth at 15˚C and 45˚C in the de Man Rogosa Sharpe (MRS) broth based on the char- acteristics of the lactobacilli as described in Bergey’s Manual of Determinative Bacteriology [11-14] and fer- mentation of different carbon sources (API 50 CHL, bioMerieux SA, France). The ability of these isolated strains to produce acids from different carbohydrates was determined by API 50 CHL test kit (bioMerieux SA, France). 2.2. Selection of Isolates Producing Bacteriocin 2.2.1. Treatment of Bacteria Prior to Production of Bacteriocin The isolates were tested for their production of Bacterio- cin. E. coli ATCC 25922 and Bacillus subtilis NCIB3610 were used as indicator microorganism in all assays. Indi- cator microorganisms used are propagated for 48 h in the Nutrient agar media, and at the temperatures indicated 30˚C. 2.2.2. Detection of Antibacterial Activity The antimicrobial activity of the isolates during the growth phase against Gram negative bacterium E. coli ATCC 25922 and Gram positive bacterium Bacillus sub tilis NCIB3610 was evaluated by deferred methods: 1) well- diffusion assay [15] and 2) Tetrazolium/formazan-test method [16]. 2.3. The Maximization of Bacteriocins Production 2.3.1. Determination of Bacteriocin Production at Different Culture Conditions The effects of different temperatures and initial pH on the bacteriocin production were tested. MRS broth (10 mL) was inoculated with each isolate and incubated at different temperatures such as 10˚C, 20˚C, 30˚C, 40˚C and 50˚C to study the effect of different temperatures on the bacteriocin production. The effect of initial medium pH on bacteriocin production was determined by adjust- ing the MRS broth to different pH levels of 2, 4, 6, 8 and 10, respectively. Each tube was inoculated with 2.0% v/v of an 18 h-old culture of the four isolates and incubated at 30˚C for 96 h, without agitation. 2.3.2. Influence of Medium Component on the Production of Bacteriocins The effect of medium ingredients on bacteriocin produc- tion was evaluated using composed media. The supple- ments studied were tryptone, yeast extract, beef extract, triammonium citrate sodium acetate, MgSO4-7H2O, K2HPO4, NaCI, glucose and tween 80 (1%, 2% and 3%) for each. Then, cells were removed by centrifugation at 6 000 rpm for 20 min. the culture media was adjusted to pH 7.0 using 1 M NaOH to exclude the antimicrobial effect of organic acids, followed by filtration of the su- pernatant through a 0.2 ml pore-size cellulose acetate filter. 2.3.3. Influence of Different Media on the Production of Bacteriocins The effect of different medium on bacteriocin production was evaluated using media at 30˚C for 48 hours. Copyright © 2013 SciRes. FNS  Study Bacteriocin Production and Optimization Using New Isolates of Lactobacillus spp. Isolated from Some Dairy Products under Different Culture Conditions 344 Selective medium (MRS media) as control. Medium (A) Corn steep liquor-Lactose medium [17]. Medium (B) Corn steep liquor-Lactose medium [18]. Medium (D) Corn steep liquor medium [19]. Medium (E) Glycerol-molasses-liquid medium [17]. Broth media were used as seed culture (10% of the to- tal volume of the fermentation medium). The culture was adjusted to pH 7.0. 2.4. Optimization of Bacteriocins Activity 2.4.1. Production of Crude Bacteriocin Samples Lactobacillus species were cultured in 1000 ml MRS broth (pH 7.0) for 48 h at 30˚C. For extraction of bacte- riocins, a cell-free solution was obtained by centrifuging (6000 rpm for 20 min. at 4˚C) the culture and was ad- justed to pH 7.0 [20,21]. 2.4.2. Effect of Temperature on Crude Bacteriocins Activity In order to test the heat resistance, 10 ml of bacteriocin preparation was heated for 30 minutes at 30˚C, 60˚C, 90˚C and 121˚C respectively. Residual bacteriocin activ- ity was detected against E. coli and Bacillus subtilus at each of these temperatures [22] by teterazoluim chloride method. 2.4.3. Effect of pH on Crude Bacteriocins Activity According to the method described by Karaoglu et al. [8], sensitivity of the cell-free supernatant to different pH values was tested by adjusting the pH of the bacteriocins in the range of pH 2 to 10 with sterile IN Noah and IN HC1. Residual activity of each of the samples was de- termined against the indicator organism by agar-well diffusion assay. 2.4.4. Effect of Surfactants on Crude Bacteriocins Activity The effect of surfactants on the bacteriocins was tested by adding SDS, CTAB, EDTA and Tween 80 (0.5% v/v final concentration), to crude bacteriocins. Untreated bac- teriocin preparation (positive control). All samples were incubated at room temperature for 2 hours then tested for residual antimicrobial activity by teterazolium formazan test. 2.4.5. Effect of Organic Solvents on Crude Bacteriocins Activity Crude bacteriocin preparations were mixed with organic solvents including acetone, butanol, chloroform, ethanol, methanol and propanol at a final concentration of 0.5%. Untreated bacteriocins preparation were used as (positive control). All samples were incubated at room tempera- ture for 2 hours and tested for residual antimicrobial ac- tivity by teterazolium formazan test. 2.4.6. Effect of Metal Ions on Crude Bacteriocins Activity In a separate experiment the effect of metal salts on bac- teriocin was examined by adding AgNO3, CuSO4, FeSO, MgSO4, MnCl2, and ZnSO4 (Merck) to 10 ml of crude bacteriocin preparation (0.5% final concentration). Un- treated bacteriocin preparation (positive control). All samples were incubated at room temperature for 2 hours and tested for residual antimicrobial activity [23,24] by teterazolium formazan test. 2.4.7. Effect of Different Concentration of NaCl on Crude Bacteriocins Activity In a separate experiment the effect of different concen- tration of NaCl (2%, 4%, 6%, 8%, 10%) on bacteriocins were examined by adding to 10 ml of crude bacteriocins preparation. Untreated bacteriocin preparation (positive control). All samples were incubated at room tempera- ture for 2 hours and tested for residual antimicrobial ac- tivity [24] by agar-well diffusion assay. 2.4.8. Effect of Different Concentration of Amino Acids on Crude Bacteriocins Activity In a separate experiment the effect of different concen- tration of 21 amino acids compound (essential amino acids) (2%, 4%, 6%, 8% and 10%) on bacteriocins were examined by adding to 10 ml of crude bacteriocins prepa- ration. Untreated bacteriocin preparation (positive con- trol). All samples were incubated at room temperature for 2 hours and tested for residual antimicrobial activity by agar-well diffusion assay. 2.4.9. Effect of Different Concentration of Vitamins on Crude Bacteriocins Activity In a separate experiment the effect of different concen- tration of vitamins (50%) such as (B12 and B complex) on bacteriocins were examined by adding (1) to 10 ml of crude bacteriocins preparation. Untreated bacteriocin preparation (positive control). All samples were incu- bated at room temperature for 2 hours and tested for re- sidual antimicrobial activity by agar-well diffusion assay. 2.5. Statistical Analysis Data are presented as the mean ± standard deviation, and n represents the number of the isolates and the control. 3. Results and Discussion 3.1. Isolation and Identification of Bacteriocinogenic Strains Sixteen isolates of LAB were isolated from the samples. Copyright © 2013 SciRes. FNS  Study Bacteriocin Production and Optimization Using New Isolates of Lactobacillus spp. Isolated from Some Dairy Products under Different Culture Conditions Copyright © 2013 SciRes. FNS 345 After series of purification on MRS agar, four isolates were found to be Gram-positive, catalase negative, non- motile bacilli. In addition, all strains were tested for growth at 10˚C for 10 days, 45˚C for 48 h, and CO2 pro- duction from glucose [25]. Table 1 presents the results of the final identifications for each type of isolates with API gallery as stated below: L. acidophilus M2, L. acidophi- lus CH1, L. fermentum M1 and L. pentosus CH2. 3.2. Bacteriocin Production The antibacterial activity of bacteriocins against food borne pathogenic, as well as spoilage bacteria has raised considerable interest for their application in food preser- vation [26]. Application of bacteriocins may help reduce the use of chemical preservatives and/or the intensity of heat and other physical treatments, satisfying the de- mands of consumers for foods that are fresh tasting, ready to eat, and lightly preserved. In the present study the average diameter of the inhibition zones measured ranged from 2 - 20 mm in size (Table 2). Among the isolates, L. fermentum M1 and L. a cidophilus CH1 were bacteriocin effectively inhibited the Bacillus subtilis NCIB3610 with maximum inhibitory activity, compared to the other tested bacteria while, the impact of these strains were less against E. coli ATCC 25922. In addition, L. a cidophilus M2 exhibited stronger inhibition activity on Bacillus subtilis NCIB3610 than E. coli ATCC 25922 but its effect was less than the effect of L. acidophilus CH1 that exemplifies a difference within the same spe- cies. The present L. pentosus CH2 isolate showed inhibi- tory activity against Ba cillus subtilis NCIB3610 on the other hand it was less inhibitory activity against E. coli ATCC 25922. Such observations [27,28] made earlier are in tune with the results of the present study which con- firmed that the bacteriocins of Gram-positive bacteria generally exhibit antagonistic activity against Gram-posi- tive bacteria and the activity against Gram negative bac- teria is an unusual phenomenon and has been reported for the bacteriocins produced by Lactobacillus plantarum [29], the isolates were screened for antimicrobial spec- trum against Gram-positive and Gram-negative bacteria using the AWD method. 3.3. Effect of Culture Conditions and Medium Composition on Bacteriocin Production The culture conditions and composition of the growth medium are very important for the production of indi- vidual bacteriocins [5]. Several media have been evalu- ated by numerous authors to improve bacteriocin synthe- sis [30] because these peptides are not always produced in standard or enriched culture media. Lactic acid bacte- ria are fastidious microorganisms that require rich media containing milk, whey ultrafiltrate, or complex synthetic media such as MRS [10], M17 [31] or LAPTg [32] for growth. Therefore, the isolation of a peptide(s) in rich- medium supernatant is an additional problem, making the purification of the bacteriocin a relatively complicated protocol. The present study was primarily aimed to de- termine cultural conditions for obtaining better and stable bacteriocins production. L. acidophilus CH1 was able to produce bacteriocins, which had a wide inhibitory spec- trum towards both Gram-negative and Gram-positive food spoilage and pathogenic bacteria. Results show that bac- teriocin was produced when nutrients were available for metabolic activity. Tables 3 and 4 showed that maximum activity was noted at pH 6.0, temperature 30˚C. Bacte- riocin production is frequently regulated by pH and growth temperature, as has been shown in several studies involving the pediocin AcH [33]. From the results proved that it could be used in acidic foods like pickle or yoghurt. It might be secondary metabolites. The composition of medium influencing the produc- tion of bacteriocin by Lactobacillus isolates. Table 5 showed that MRS seemed to be more suitable medium Table 1. Pre-identification of some isolates. Preliminary tests Strain Gram staining Catalase test Growth at 10˚C Growth at 45˚C CO2 Production API Identification M2 + − − + − L. acidophilus CH1 + − − + − L. acidophilus CH2 + − − + + L. pentousus M1 + − + + − L. fermentum Table 2. Bacteriocin production by four isolates Detected by well-diffusion assay. Strains Diameter of the inhibition-zone (mm) for B. subtilis Diameter of the inhibition-zone (mm) for E. coli L. fermentum M1 20 ± 0.01 3 ± 0.02 L. acidophilus M2 18 ± 0.02 16 ± 0.03 L. acidophilus CH1 20 ± 0.01 18 ± 0.01 L. pentousus CH2 15 ± 0.01 2 ± 0.02 Data are presented as mean ± SD.  Study Bacteriocin Production and Optimization Using New Isolates of Lactobacillus spp. Isolated from Some Dairy Products under Different Culture Conditions 346 Table 3. Effect of different temperature on production. Diameter of the inhibition-zone (mm) for E. coli ATCC 25922 Diameter of the inhibition-zone (mm) for Bacillus subtilis NCIB3610 Temp. Strains L. fermentum M1 L. acidophilus M2 L. acidophilus CH1 L. pentosus CH2 L. fermentum M1 L. acidophilus M2 L. acidophilus CH1 L. pentosus CH2 Control 20 ± 0.01 3 ± 0.01 9 ± 0.01 5 ± 0.01 3 ± 0.01 4 ± 0.01 16 ± 0.01 2 ± 0.01 10 0.0 0.0 0.0 0.0 0.0 0.0 0.0 0.0 20 3 ± 0.01 4 ± 0.01 6 ± 0.01 4 ± 0.01 5 ± 0.01 4 ± 0.01 14 ± 0.01 6 ± 0.01 30 4 ± 0.01 3 ± 0.01 16 ± 0.01 7 ± 0.01 4 ± 0.01 5 ± 0.01 21 ± 0.01 7 ± 0.01 40 3 ± 0.01 5 ± 0.01 9 ± 0.01 3 ± 0.01 3 ± 0.01 2 ± 0.01 15 ± 0.01 6 ± 0.01 50 0.0 0.0 0.0 0.0 0.0 0.0 0.0 0.0 Data are presented as mean ± SD. Table 4. Effect of different pH on production. Diameter of the inhibition-zone (mm) for E. coli ATCC 25922 Diameter of the inhibition-zone (mm) for mBacillus subtilis NCIB3610 pH Strains L. fermentum M1 L. acidophilus M2 L. acidophilus CH1 L. pentosus CH2 L. fermentum M1 L. acidophilus M2 L. acidophilus CH1 L. pentosus CH2 Control 2 ± 0.01 3 ± 0.01 9 ± 0.01 5 ± 0.01 3 ± 0.01 4 ± 0.01 16 ± 0.01 2 ± 0.01 2 1 ± 0.01 0.0 2 ± 0.01 0.0 0.0 1 ± 0.01 3 ± 0.01 0.0 4 2 ± 0.01 1 ± 0.01 3 ± 0.01 1 ± 0.01 0.0 1 ± 0.01 4 ± 0.01 0.0 6 2 ± 0.01 3 ± 0.01 10 ± 0.01 7 ± 0.01 4 ± 0.01 4 ± 0.01 20 ± 0.01 7 ± 0.01 8 1 ± 0.01 2 ± 0.01 5 ± 0.01 2 ± 0.01 2 ± 0.01 2 ± 0.01 10 ± 0.01 10 ± 0.01 10 0.0 0.0 0.0 0.0 0.0 0.0 0.0 0.0 Data are presented as mean ± SD. for the bacteriocin production. Similar results were ob- served by [34,35]. Results in Table 5 also indicate that larger amounts of the bacteriocins were synthesized only in MRS medium supplemented with K2HPO4 (1.0%), Tween 80 (1%), Beef extract (1%), glucose, cyctein and peptone extract (1%), while addition of tri-ammonium citrate, sodium acetate and magnesium sulphate, had no effect on bacteriocin production. Thus variation in the concentration of constituents/ supplementation of culti- vation media might have an influence on the amount of bacteriocin produced by microorganisms. Similar obser- vations have been made previously. Daba et al. [21] ob- tained similar results in the production of mensenterocin 5. Biswas et al. [33] compared the production of pediocin ACH by Pediococcus acidilactici H cultivated in TGE broth, MRS broth and several modifications of it. Modi- fication of nutrients of cultivation media should be con- sidered for maximal production of bacteriocin that has potential use as a food biopreservative [33]. Similar re- sults were recorded for nisin [36] and pediocin AcH [33]. The reason for increased bacteriocin production is not clear and yet to be ascertained. Most of the bacteriocin producing organisms requires stabilizers or a unique me- dium composition for bacteriocin synthesis. It is probable that the yeast extract may in part serve to inactivate an inhibitor of bacteriocin synthesis [37]. Being a surfactant Tween 80, might enable the discharging of the bacterio- cin from the cell surface of the producer strain. This finding was supported by the increased bacteriocin pro- duction in the medium supplemented with different con- centrations of yeast extract plus Tween-80. An earlier study by the senior author [28] revealed that in L. plantaram MTCC1746, maximum bacteriocin pro- duction could be achieved by providing 1.5% yeast ex- tract and 1.5% Tween-80. The addition of MgSO4 could make a slight impact on the production of bacteriocin. Activity of 1000 AU/mL was observed by the addition of this substrate at a lower concentration of 0.02% to 0.04%. The higher concentrations 1%, 2% and 3%, however, bring about reduction in bacteriocin production. 3.4. Influence of Different Media on the Production of Bacteriocins Several complex culture media of high cost have been used for bactenocins production. In the current study, we have used an effluent from the food industry (Corn sleep Copyright © 2013 SciRes. FNS  Study Bacteriocin Production and Optimization Using New Isolates of Lactobacillus spp. Isolated from Some Dairy Products under Different Culture Conditions 347 Table 5. Effect of adding some nutrient components in MRS media on bacteriocins production by Lactobacillus spp. isolates. Diameter of the inhibition-zone (mm) Medium Constituents % E. coli ATCC 25922 Bacillus subtilis NCIB3610 M1 M2 CH1 CH2 M1 M2 CH1 CH2 MRS (control) 2 3 9 5 3 4 16 2 1 0.00 3 9 0.00 0.00 0.00 10 0.00 2 0.00 0.00 0.00 0.00 0.00 0.00 9 0.00 MRS + Yeast extract 3 0.00 0.00 0.00 0.00 0.00 0.00 0.00 0.00 1 10 0.00 13 0.00 0.00 0.00 25 0.00 2 15 0.00 17 10 0.00 0.00 0.00 0.00 MRS + Beef extract 3 0.00 0.00 0.00 0.00 0.00 0.00 0.00 0.00 1 0.00 0.00 0.00 0.00 5 7 24 0.00 2 0.00 0.00 0.00 0.00 0.00 0.00 0.00 0.00 MRS + Peptone extract 3 0.00 0.00 0.00 0.00 0.00 0.00 0.00 0.00 1 0.00 0.00 0.00 0.00 0.00 0.00 13 0.00 2 0.00 0.00 15 0.00 0.00 0.00 11 0.00 MRS + Glucose 3 9 19 11 9 0.00 0.00 0.0 0.00 1 0.00 0.00 12 0.00 0.00 0.00 23 0.00 2 0.00 0.00 0.00 0.00 0.00 0.00 15 0.00 MRS + Tween80 3 0.00 0.00 5 9 8 12 20 0.00 1 1 2 3 5 9 0.00 19 0.00 2 2 2 4 2 0.00 0.00 0.00 0.00 MRS + Sodium acetate 3 0.00 0.00 0.00 0.00 0.00 0.00 0.00 0.00 1 4 0.00 0.00 0.00 0.00 5 10 0.00 2 0.00 0.00 0.00 0.00 0.00 0.00 0.00 0.00 MRS + Tri-ammonium citrate 3 0.00 0.00 0.00 0.00 0.00 0.00 0.00 0.00 1 0.00 11 12 5 6 6 16 0.00 2 0.00 5 0.0 0.00 7 0.0 0.0 0.00 MRS + MgSo4·7H2O 3 0.00 0.0 0.0 0.0 0.0 0.0 0.0 0.00 1 12 10 20 0.00 0.00 0.00 15 0.00 2 0.00 0.00 15 0.00 0.00 0.00 11 0.00 MRS + Cyctein 3 0.00 0.00 25 15 0.00 0.00 10 0.00 1 0.00 0.00 0.00 10 9 20 27 0.00 2 0.00 0.00 0.00 9 0.00 9 13 0.00 MRS + K2HPO4 3 0.00 0.00 0.00 0.00 0.00 0.00 0.00 0.00 liquar (CSL), CSL with glucose and glysrol culture me- dia for bacteriocins production of at low costs. These media were used for bactenocin production by four lactic acid bacteria isolates (Lactobacillus fermentum M1, Lactobacillus acidophilus M2, Lactobacillu s acidophilus CH1 and Lactobacillus pentosus CH2). Production of bacteriocins at 30˚C and at a pH 6.5 were carried out in different media MRS, Medium (A) Corn steep liquor— Lactose medium, Medium (B) Corn steep liquor—Lac- tose medium, Medium (C) Corn steep liquor medium, Medium (D) Glycerol-molasses-liquid medium for bac- teriocins (Table 6). A maximum growth rate were shown in MRS and CSL for all isolates and a maximum bacte- riocrn activity (inhibition zone mm of Bacillus subtilis NCIB3610) was appeared by-isolate Lactoba cillus aci- dophilus CH1 in medium C, but the maximum bacte- riocm activity by isolate CH1. On the other hand isolates CHl and M1 were given the maximum bacteriocm(s) activity in meadium C. The lowest amounts of bacterio- cins activity were produced in date by M1 isolate. Al- though this fact suggests the possible effect of substrate inhibition, it could also be related to the control that the supplied sugar substrate exerts on the bacteriocm bio- synthesis. Biswas et al. [33] reported that MRS medium is a better medium for cell growth and bacteriocins pro- duction than other media. Generally, maximum produc- tion corresponds to against pathogenic microbe such as Bacillus subtilis NCIB3610 and E. coli ATCC 25922. Copyright © 2013 SciRes. FNS  Study Bacteriocin Production and Optimization Using New Isolates of Lactobacillus spp. Isolated from Some Dairy Products under Different Culture Conditions 348 Table 6. Effect of different media on production of bacteriocins. Strains Diameter of the inhibition-zone (mm) for Bacillus subtilis NCIB3610 Diameter of the inhibition-zone (mm) for E. coli ATCC 25922 Media L. fermentum M1 L. acidophilus M2 L. acidophilus CH1 L. pentosus CH2 L. fermentum M1 L. acidophilum M2 L. acidophilus CH1 L. pentosus CH2 MRS control 2 3 9 5 3 4 16 2 A 8 0.0 10 0.0 0.0 0.0 0.0 0.0 B 8 5 20 12 0.0 0.0 0.0 0.0 C 5 25 32 20 0.0 0.0 0.0 0.0 D 10 0.0 16 0.0 0.0 0.0 0.0 0.0 Medium (A) Corn steep liquor-Lactose medium. Medium (B) Corn steep liquor-Lactose medium with some modifications. Medium (C) Corn steep liquor medium. Medium (D) Glycerol-molasses-liquid medium. Therefore increased cell concentrations in a high cell- density reactor is expected to increase bactenocm pro- duction. In general bactencin production by lactic acid bacteria occurs during the active growth phase [29,38]. Conditions favouring bacterial growth and high cell den- sities are frequently beneficial to bactenocin production as well [38]. However, a high cell yield does not neces- sarily result in a high bactenocin activity since the latter may be limited by a low specific bacteriocin production, i.e. a low bacteriocin production per gram of cells [28]. Hence, there exists a rather complex relationship be- tween environmental conditions and bactenocin activity levels and no generalisation about the optimum condi- tions for bactenocin production can readily be made. The kinetics of both cell growth and bactenocin production in function of the environmental situation have to be stud- ied to obtain a better understanding of the production mechanism. 3.5. Optimization of Bacteriocin Activity 3.5.1. Effect of Different Temperatures on the Crud Bacteriocin The effect of different temperatures on crud bacteriocin have been clarified in the Tables 7-10. These tables clearly highlights of effect of different temperature 30˚C, 60˚C and 90˚C /30min on crud bacteriocin from four LAB: L. fermentum M1, L. acidoph ilus M2, L. acidophi- lus CH1and L. pentosus CH2 according to the tetera- zolium chloride methods. As can be seen, LAB were isolated from local raw milk and Ras cheese using MRS agar. According to Table 7, the isolated Lactobacillus fermentum M1 was showed antimicrobial activity against E.coli ATCC 25922 which showed the largest of growth inhibitor% around 76.08% in temp. 60˚C/30min bacte- riocin but the smallest of the antimicrobial activity was 39.34% in temp. 90˚C/30min wherever Lactobacillus fermentum was showed antimicrobial activity against Ba- cillus subtilis NCIB3610 was 35.79% in temp. 60˚C/30min but the smallest of the antimicrobial activity was 30% in temp. 30˚C/30min. Table 8, in addition, the strains L. acidophilus M2 which showed the largest growth inhibi- tion% was 80.32% in temp. 60˚C/30min against Bacillus subtilis NCIB3610 but the smallest was 65.81% in temp. 90˚C/30min wherever, the same strain was the largest growth inhibitor% 87.34% in temp. 60˚C/30min but the smallest was 11.12% in temp. 30˚C/30min against to E. coli. According to Table 9 The isolated Lactobacillus aci- dophilus CH1 was showed antimicrobial activity against E.coli ATCC 25922 which showed the largest of growth inhibitor% around 59.56% in temp. 60˚C/30min but that showed the smallest 18.08% in temp. 90˚C/30min. Bac- teriocin wherever La ctobacillus acidophilus CH1 was showed antimicrobial activity against Bacillus subtilis NCIB3610 was 87.08% in temp. 30˚C/30min but the smallest of the antimicrobial activity was 18.08% in temp. 90˚C/30min. Table 10, in addition, the strains L. pento- sus CH2 which showed the largest growth inhibition% was 85.98% in temp. 60˚C/30min against Bacillus sub- tilis NCIB3610 but the smallest was 0.00% in temp. 60˚C/30min wherever, the same strain was the largest growth inhibitor% 98.40% in temp. 90˚C/30min against to E. coli. An optimal temperature of 25˚C for the production of bacteriocin by Leuconostoc carnosum LA54A was found by Geisen et al. [39]. Vignolo et al. [40] showed that production of lactocin 705 by Lactobacillus casei CRL 705 increased as the culture temperature was reduced: for every temperature tested (15˚C ± 30˚C), bacteriocin pro- duction levels were identical but biomass increased with the temperature. Moreover, the lower the temperature, the higher the volumic production, particularly for mes- enterocin 52 A. This indicated that bacteriocin produc- tion was stimulated by temperatures unfavorable for growth, particularly the low temperatures. 3.5.2. Effect of Different Levels of pH on the Crud Bacteriocin The effects of different pH such as 2, 4, 6, 8 and 10 on crude of bacteriocins were studied. In MRS broth, pH2 Copyright © 2013 SciRes. FNS  Study Bacteriocin Production and Optimization Using New Isolates of Lactobacillus spp. Isolated from Some Dairy Products under Different Culture Conditions 349 Table 7. Effect of temperature on crude bacteriocins. L. fermentum M1 Bacillus subtilis NCIB3610 E. coli ATCC 25922 O.D Growth % Growth inhibitor % O.D Growth % Growth inhibitor % Control 0.813 100 0.00 1.350 100 0.00 30˚C/30min 0.569 69.99 30.01 0.531 39.33 60.67 60˚C/30min 0.522 64.21 35.79 0.323 23.93 76.08 90˚C/30min 0. 55 67.65 32.34 0.090 6.66 39.34 Table 8. Effect of temperature on crude bacteriocins. L. acidophilus M2 Bacillus subtilis NCIB3610 E. coli ATCC 25922 O.D Growth % Growth inhibitor % O.D Growth % Growth inhibitor % Control 0.813 100 0.00 1.350 100 0.00 30˚C/30min 0.232 28.54 71.46 0.943 69.85 30.15 60˚C/30min 0.160 19.68 80.32 0.171 12.66 87.34 90˚C/30min 0.278 34.19 65.81 1.20 88.88 11.12 Table 9. Effect of temperature on crude bacteriocins. L. acidophilus CH1 Bacillus subtilis NCIB3610 E. coli ATCC 25922 O.D Growth % Growth inhibitor % O.D Growth % Growth inhibitor % Control 0.813 100 0.00 1.350 100 0.00 30˚C/30min 0.105 12.92 87.08 1.007 74.59 25.41 60˚C/30min 0.411 50.55 49.45 0.546 40.44 59.56 90˚C/30min 0.666 81.92 18.08 1.096 81.19 18.82 Table 10. Effect of temperature on crude bacteriocin. L. pentosus CH2 Bacillus subtilis NCIB3610 E. coli ATCC 25922 O.D Growth % Growth inhibitor % O.D Growth % Growth inhibitor % Control 0.813 100 0.00 1.350 100 0.00 30˚C/30min 0.122 15 84.99 0.221 16.37 83.63 60˚C/30min 0.114 14.02 85.98 0.221 16.37 83.63 90˚C/30min 1.229 151.17 −51.17 2.154 1.59 98.40 increased the activity of bacteriocins isolated from Lac- tobacillus acidophillu s CH1 against to E. coli ATCC 25922 was 12 mm but the L. acidophillus M2, L. fer- mentum M1 and L. pentosus CH2 isolates were around (5, 9, 10) mm, wherever four isolates were decreased pH against to Bacillus subtilis NCIB3610 (Table 11). Among them, in pH 6, the largest activity of bacteriocin from Lactobacillus acidophilus CH1, L. acidophillus M2, L. fermentum M1 and L. pentosus CH2 against E. coli ATCC 25922 was shown 11, 11, 28 and 15 mm, but isolates were decreased pH against to Bacillus subtilis NCIB3610. Among them, in pH 8, the largest activity of bacteriocin from Lactobacillus acidophilus CH1, L. acidophillus M2, L. fermentum M1 and L. pentosus CH2 against E. coli ATCC 25922 was shown 13, 10, 26 and 20 mm, but iso- lates were decreased pH against to Bacillus subtilis NCIB3610. In pH 10, no activity for bacteriocin from Lactobacillus spp. against E. coli ATCC 25922 and Ba- cillus subtilis NCIB3610. So that, the activity of different bacteriocins were shown in pH6 against E. coli ATCC 25922 and the isolates were decreased against to Bacillus subtilis NCIB3610. Thus, under uncontrolled pH conditions, a lower tem- perature coincided with a higher maximum bacteriocin production, a result also obtained by De Vugst et al. [41] with the bacteriocin from Lactobacillus amylovorus. Copyright © 2013 SciRes. FNS  Study Bacteriocin Production and Optimization Using New Isolates of Lactobacillus spp. Isolated from Some Dairy Products under Different Culture Conditions 350 Table 11. Effect of pH on crude bacteriocins. E. coli ATCC 25922 Bacillus subtilis NCIB3610 pH Strains L. fermentum M1 L. acidophilus M2 L. acidophilus CH1 L. pentosus CH2 L. fermentum M1 L. acidophilus M2 L. acidophilus CH1 L. pentosus CH2 2 10 9 12 5 6 8 9 5 4 9 11 9 9 10 8 10 10 6 11 11 28 20 5 5 33 5 8 13 10 26 15 5 5 9 5 10 0.0 0.0 0.0 0.0 0.0 0.0 0.0 0.0 3.5.3. Effect of Surfactant on Crude Bacteriocins Tables 12-15 clearly highlights of effect of different minerals such as SDS, ETDA, Tween80 and CTAB on crud bacteriocin from four LAB such as L. fermentum M1, L. acidophilus M2, L. acidophilus CH1and L. pen- tosus CH2 according to the teterazolium chloride meth- ods. As can be seen, LAB were isolated from local raw milk and Ras cheese using MRS agar. According to Ta- ble 12 The isolated Lactobacillus fermentum M1 was showed antimicrobial activity against E. coli ATCC 25922 which showed the largest of growth inhibitor% around 73.56% in Tween80 on bacteriocin but the smallest of the antimicrobial activity was 34.23% in CTAB wher- ever Lactobacillus fermentum was showed antimicrobial activity against Bacillus subtilis NCIB3610 was 47.48% in Tween80 but the smallest of the antimicrobial activity was 12.42% in SDS. Table 13, in addition, the strains L. acidophilus M2 which showed the largest growth inhibi- tion% was 78.59% in SDS against Bacillus sub tilis NCIB3610 but the smallest was 11.44% in Tween80 wherever, the same strain was the largest growth inhibi- tor% 74.52% in CTAB but the smallest was 39.4% in Tween80 against to E. coli. According to Table 14, the isolated Lactoba cillus acidophilus CH1 was showed antimicrobial activity against E. coli ATCC 25922 which showed the largest of growth inhibitor% around 78.29% in Tween80 but that showed the smallest 20% in CTAB. Bacteriocin wher- ever Lactobacillus acidophilus CH1 was showed antim- icrobial activity against Bacillus su btilis NCIB3610 was 75.77% in Tween80 but the smallest of the antimicrobial activity was 34.44% in SDS. Table 15, in addition, the strains L. pentosus CH2 which showed the largest growth inhibition% was 49.57% in CTAB against Bacillus sub- tilis NCIB3610 but the smallest was 7.13% in Tween80 wherever, the same strain was the largest growth inhibi- tor% 80.59% in CTAB against to E. coli but the smallest of the antimicrobial activity was 40.89% in ETDA. Simi- lar observation was made earlier in L. acidophilus [42]. 3.5.4. Effect of Organic Solvents on Crude Bacteriocins Activity Tables 16-19 clearly highlights of effect of different sol- vent such as ethanol, Isopropanol, Isoamylchlorde and chrolform on crud bacteriocin from four LAB such as L. fermentum M1, L. acidophilus M2, L. acidophilus CH1and L. pentosus CH2 according to the teterazolium chloride methods. As can be seen, LAB were isolated from local raw milk and Ras cheese using MRS agar. According to Ta- ble 16, the isolated Lactobacillus fermentum M2 was showed antimicrobial activity against E. coli ATCC 25922 which showed the largest of growth inhibitor% around 60.67% in ethanol bacteriocin wherever Lactobacillus fermentum was showed antimicrobial activity against Bacillus subtilis NCIB3610 was 93.85% in Iso amyl chloride but the smallest of the antimicrobial activity was 30% in ethanol. Table 17, in addition, the strains L. aci- dophilus M2 which showed the largest growth inhibi- tion% was 88.98% in chroloform against Bacillus subtilis NCIB3610 but the smallest was 46.87% in ethanol wher- ever, the same strain was the largest growth inhibitor% 87% in isopropanol but the smallest was 11.12% in Iso amyl chloride against to E. coli. According to Table 18, the isolated Lactobacillus aci- dophilus CH1 was showed antimicrobial activity against E. coli ATCC 25922 which showed the largest of growth inhibitor% around 85.19% in ethanol but that showed the smallest 38.45% in isoamylchlorde. Bacteriocin wher- ever Lactobacillus acidophilus CH1 was showed antim- icrobial activity against Bacillus su btilis NCIB3610 was 87.69% in ethanol but the smallest of the antimicrobial activity was 14.69% in chloroform. Table 19, in addition, the strains L. pentosus CH2 which showed the largest growth inhibition% was 33.21% in ethanol against Ba - cillus subtilis NCIB3610 but the smallest was 0.00% in chloroform wherever, the same strain was the largest growth inhibitor% 70.52% in ethanol but the smallest was 40.74% in isopropanol against to E. coli. 3.5.5. Effect of Some Minerals Salt on Crude Bacteriocins Tables 20-23 clearly highlights of effect of different minerals such as AgNo3, CuSo4, FeSo4, MgSo4, MnCl2 and ZnSo4 on crud bacteriocin from four LAB isolates according to the teterazolium chloride methods. Tables Copyright © 2013 SciRes. FNS  Study Bacteriocin Production and Optimization Using New Isolates of Lactobacillus spp. Isolated from Some Dairy Products under Different Culture Conditions 351 Table 12. Effect of surfactant on crude bacteriocins from Lactobacillus fermentum M1. Lactobacillus fermentum M1 Baccillus subtilis NCIB3610 E. coli ATCC 25922 Isolates Surfactant O.D Growth % Growth inhibitor % O.D Growth % Growth inhibitor % Control 0.813 100 0.00 1.350 100 0.00 SDS 0.712 87.58 12.42 0.739 54.74 45.26 ETDA 0.576 71.09 28.91 1.766 130.81 −30.81 Tween80 0.427 52.52 47.48 0.357 26.44 73.56 CTAB 0.465 57.19 42.80 0.888 65.78 34.23 Table 13. Effect of surfactant on crude bacteriocins from Lactobacillus acidophillus M2. L. acidophillus M2 Baccillus subtilis NCIB3610 E. coli ATCC 25922 Isolates Surfactant O.D Growth % Growth inhibitor % O.D Growth % Growth inhibitor % Control 0.813 100 0.00 1.350 100 0.00 SDS 0.174 21.40 78.59 0.549 40.67 59.34 ETDA 0.272 33.46 66.54 1.463 108.37 −8.37 Tween80 0.720 88.56 11.44 0.818 60.59 39.4 CTAB 0.583 71.71 28.29 0.344 25.48 74.52 Table 14. Effect of surfactant on crude bacteriocins from Lactobacillus acidophillus CH1. L. acidophillus CH1 Baccillus subtilis NCIB3610 E. coli ATCC 25922 Isolates Surfactant O.D Growth % Growth inhibitor % O.D Growth % Growth inhibitor % Control 0.813 100 0.00 1.350 100 0.00 SDS 0.533 65.56 34.44 0.359 26.59 73.41 ETDA 0.494 60.76 39.24 1.670 123.70 −23.70 Tween80 0.197 24.23 75.77 0.293 21.70 78.29 CTAB 0.292 35.92 64.08 1.080 80 20 Table 15. Effect of surfactant on crude bacteriocins from Lactobacillus pentosus CH2. L. pentosus CH2 Baccillus subtilis NCIB3610 E. coli ATCC 25922 Isolates Surfactant O.D Growth % Growth inhibitor % O.D Growth % Growth inhibitor % Control 0.813 100 0.00 1.350 100 0.00 SDS 0.512 62.98 37.02 1.907 141.25 −14.25 ETDA 0.503 61.87 38.13 0.798 59.11 40.89 Tween80 0.755 92.87 7.13 2.499 185.11 −85.11 CTAB 0.410 50.43 49.57 0.262 19.41 80.59 Table 16. Effect of different solvent on crude bacteriocin. Lactobacillus fermentum M1 Bacillus subtilis NCIB3610 E. coli ATCC 25922 Different Solvents O.D Growth % Growth inhibitor % O.D Growth % Growth inhibitor % Control 0.813 100 0.00 1.350 100 0.00 Ethanol 0.569 69.99 30.01 0.531 39.33 60.67 Isopropanol 0.522 64.21 35.79 1.323 98 2 Iso amyl chlode 0.05 6.15 93.85 0.90 66.66 33.34 Chroloform 0.554 68.14 31.86 0.00 0.00 0.00 Copyright © 2013 SciRes. FNS  Study Bacteriocin Production and Optimization Using New Isolates of Lactobacillus spp. Isolated from Some Dairy Products under Different Culture Conditions 352 Table 17. Effect of different solvent on crude bacteriocin. Lactobacillus acidophilus M2 Bacillus subtilis NCIB3610 E. coli ATCC 25922 Different Solvents O.D Growth % Growth inhibitor %O.D Growth % Growth inhibitor % Control 0.813 100 0.00 1.350 100 0.00 Ethanol 0.10 12.30 87.69 0.20 14.81 85.19 Isopropanol 0.683 84.00 15.99 0.767 56.81 43.19 Iso amyl chloride 1. 90 233.7 −33.7 0.831 61.56 38.45 Chroloform 0.692 85.12 14.89 0.739 54.74 45.26 Table 18. Effect of different solvent on crude bacteriocin. Lactobacillus acidophilus CH1 Bacillus subtilis NCIB3610 E. coli ATCC 25922 Different Solvents O.D Growth % Growth inhibitor %O.D Growth % Growth inhibitor % Control 0.813 100 0.00 1.350 100 0.00 Ethanol 0.432 53.14 46.87 0.943 69.85 30.15 Isopropanol 0.10 12.30 87.69 0.171 12.66 87.34 Iso amyl chlode 0.278 34.19 65.81 1.20 88.88 11.12 Chroloform 0.090 11.07 88.93 2.00 148.15 −48.15 Table 19. Effect of different solvent on crude bacteriocin. Lactobacills pentosus CH2 Bacillus subtilis NCIB3610 E. coli ATCC 25922 Different Solvents O.D Growth % Growth inhibitor %O.D Growth % Growth inhibitor % Control 0.813 100 0.00 1.350 100 0.00 Ethanol 0.543 66.79 33.21 0.398 29.48 70.52 Isopropanol 0.765 94.09 5.91 0.800 59.26 40.74 Iso amyl chlode 0.625 76.88 23.12 0.699 51.78 48.23 Chroloform 0.00 0.00 0.00 0.421 30.52 69.48 showed that LAB were isolated from local raw milk and Ras cheese using MRS agar. According to Table 20 The isolated Lactobacillus fermentum M1 was showed an- timicrobial activity against E. coli ATCC 25922 which showed the largest of growth inhibitor% around 86.89% in MgSo4 on bacteriocin but the smallest of the antim- icrobial activity was 12.23% in FeSo4 wherever Lacto- bacillus fermentum was showed antimicrobial activity against Ba cillus subtilis NCIB3610 was 87.20% in FeSo4 but the smallest of the antimicrobial activity was 39.36% in CuSo4. Table 21 showed that the L. acidophilu s M2 isolate which showed the largest growth inhibition% was 95.57% in FeSo4 against Bacillus subtilis NCIB3610 but the smallest was 46.74% in CuSo4 wherever, the same strain was the largest growth inhibitor% 77.70% in MgSo4 but the smallest was 40.37% in FeSo4 against to E. coli. According to Table 22, the Lactobacillus acidophilus CH1 isolate was showed antimicrobial activity against E.coli ATCC 25922 which showed the largest of growth inhibitor% around 97.92% in FeSo4 but that showed the smallest 66.89% in MgSo4. Bacteriocin wherever Lacto- bacillus acidophilus CH1 was showed antimicrobial ac- tivity against Bacillus su btilis NCIB3610 was 75.03% in ZnSo4 but the smallest of the antimicrobial activity was 5.41% in CuSo4. Table 23, in addition, the strains L. pentosus CH2 which showed the largest growth inhibi- tion% was 97.17% in FeSo4 against Bacillus subtilis NCIB3610 but the smallest was 15.5% in ZnSo4 wher- ever, the same strain was the largest growth inhibitor% 93.11% in MgSo4 against to E. co li but the smallest of the antimicrobial activity was 13.34% in AgSo4. 3.5.6. Effect of Different Concentration of NaCl on Crude of Bacteriocins The effects of different concentration of NaCl on crude of bacteriocins were studied. In MRS broth, 2% NaCl increased the activity of bacteriocins isolated from Lac- tobacillus pentosus CH2 against to E.coli ATCC 25922 was 14 mm, L. fermen tum M1 was shown15 mm against to Bacillus subtilis NCIB3610 (Table 24). Among them, bacteriocin from Lactobacillus pentosus CH2 against Copyright © 2013 SciRes. FNS  Study Bacteriocin Production and Optimization Using New Isolates of Lactobacillus spp. Isolated from Some Dairy Products under Different Culture Conditions 353 Table 20. Effect of some mineral salt on crude bacteriocins from Lactobacillus fermentum M1. Lactobacillus fermentus M1 Bacillus subtilis NCIB3610 E. coli ATCC 25922 O.D Growth % Growth inhibitor %O.D Growth % Growth inhibitor % control 0.813 100 0.00 1.350 100 0.00 AgNO3 0.844 103.8 −3.8 2.221 164.5 −64.5 CuSO4 0.493 60.63 39.36 2.221 164.5 −64.5 FeSO4 0.104 12.79 87.20 1.185 87.76 12.23 MgSO4 0.301 37.03 62.98 0.177 13.11 86.89 MnCl2 0.216 26.57 73.43 2.301 170.44 −70.44 ZnSO4 0.424 52.15 47.85 0.975 72.22 27.77 Table 21. Effect of some mineral salt on crude bacteriocins from Lactobacillus acidophillus M2. Lactobacillus acidophillus M2 Bacillus subtilis NCIB3610 E. coli ATCC 25922 O.D Growth % Growth inhibitor %O.D Growth % Growth inhibitor % control 0.813 100 0.00 1.350 100 0.00 AgNO3 0.448 55.10 44.89 1.305 96.67 3.34 CuSO4 0.433 53.26 46.74 1.793 132.8 −32.8 FeSO4 0.036 4.43 95.57 0.805 59.63 40.37 MgSO4 0.09 11.07 88.92 0.301 22.29 77.70 MnCl2 0.833 102.46 −2.46 2.040 151.11 −51.11 ZnSO4 0.297 36.53 63.47 2.20 162.96 −62.96 Table 22. Effect of some mineral salt on crude bacteriocins from Lactobacillus acidophillus CH1. Lactobacillus acidophillus CH1 Bacillus subtilis NCIB3610 E. coli ATCC 25922 O.D Growth % Growth inhibitor %O.D Growth % Growth inhibitor % control 0.813 100 0.00 1.350 100 0.00 AgNO3 0.665 81.79 18.20 2.096 155.25 −55.25 CuSO4 0.769 94.59 5.41 2.301 170.44 −70.44 FeSO4 0.265 32.59 67.40 0.028 2.07 97.92 MgSO4 0.301 37.02 62.97 0.447 33.11 66.89 MnCl2 0.700 86.10 13.89 2.484 184 −84 ZnSO4 0.203 24.97 75.03 2.444 181.03 −81.03 Table 23. Effect of some mineral salt on crude bacteriocins from Lactobacillus pentosus CH2. Lactobacillus pentosus CH2 Bacillus subtilis NCIB3610 E. coli ATCC 25922 O.D Growth % Growth inhibitor %O.D Growth % Growth inhibitor % control 0.813 100 0.00 1.350 100 0.00 AgNO3 0.543 66.79 33.21 1.170 86.67 13.34 CuSO4 0.685 84.26 15.74 2.461 182.3 −82.3 FeSO4 0.023 2.83 97.17 0.334 24.74 75.26 MgSO4 0.201 24.73 75.27 0.093 6.89 93.11 MnCl2 0.687 84.50 15.5 2.470 182.9 −82.96 ZnSO4 0.230 28.3 71.7 0.155 11.48 88.51 Copyright © 2013 SciRes. FNS 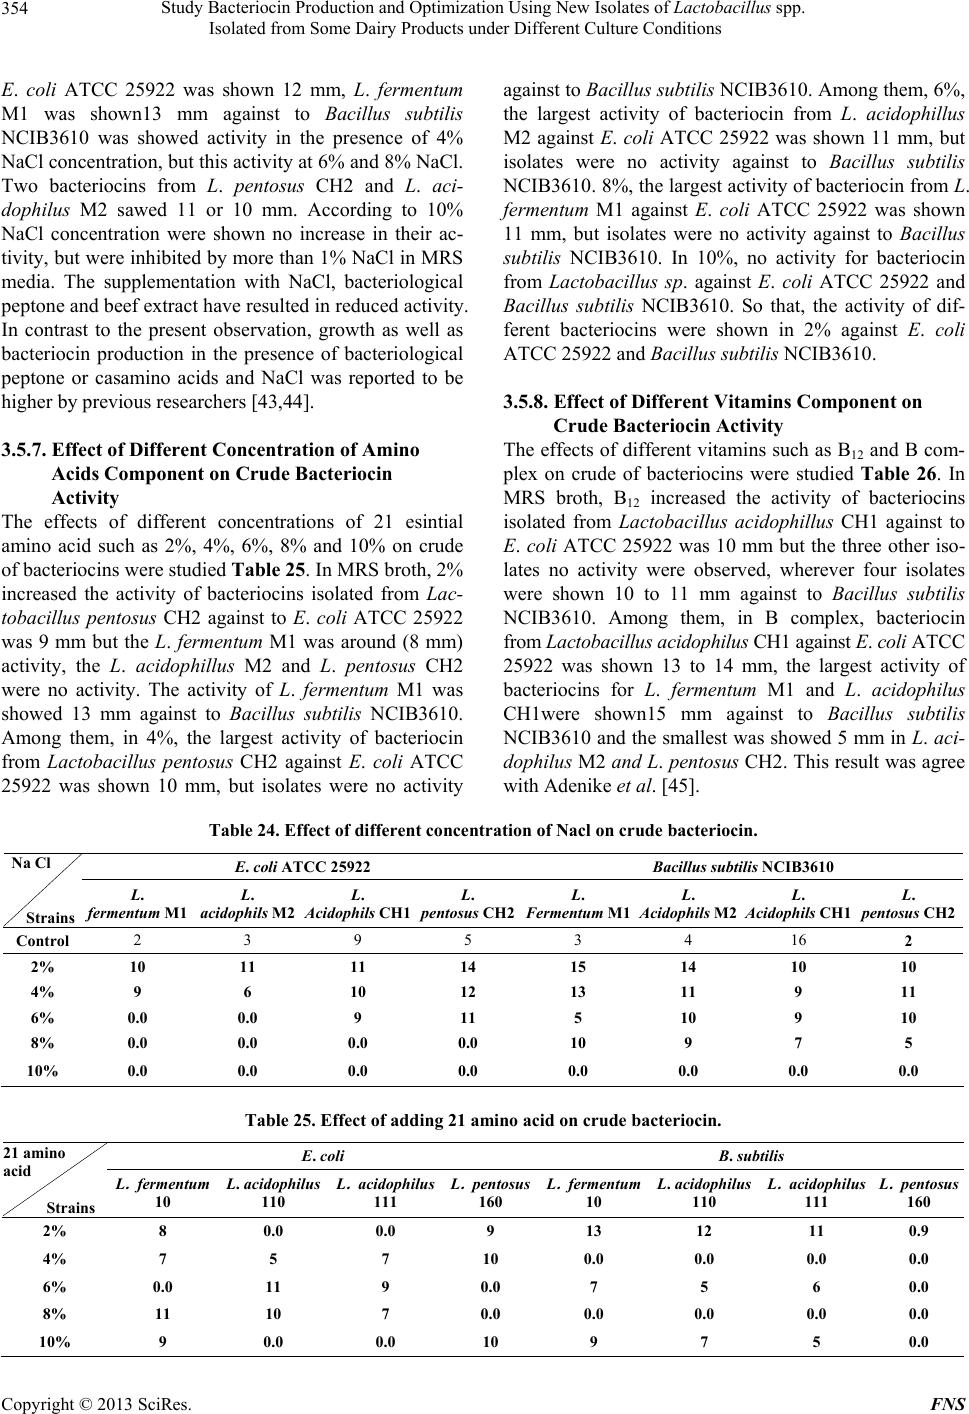 Study Bacteriocin Production and Optimization Using New Isolates of Lactobacillus spp. Isolated from Some Dairy Products under Different Culture Conditions 354 E. coli ATCC 25922 was shown 12 mm, L. fermentum M1 was shown13 mm against to Bacillus subtilis NCIB3610 was showed activity in the presence of 4% NaCl concentration, but this activity at 6% and 8% NaCl. Two bacteriocins from L. pentosus CH2 and L. aci- dophilus M2 sawed 11 or 10 mm. According to 10% NaCl concentration were shown no increase in their ac- tivity, but were inhibited by more than 1% NaCl in MRS media. The supplementation with NaCl, bacteriological peptone and beef extract have resulted in reduced activity. In contrast to the present observation, growth as well as bacteriocin production in the presence of bacteriological peptone or casamino acids and NaCl was reported to be higher by previous researchers [43,44]. 3.5.7. Effect of Different Concentration of Amino Acids Component on Crude Bacteriocin Activity The effects of different concentrations of 21 esintial amino acid such as 2%, 4%, 6%, 8% and 10% on crude of bacteriocins were studied Table 25. In MRS broth, 2% increased the activity of bacteriocins isolated from Lac- tobacillus pentosus CH2 against to E. coli ATCC 25922 was 9 mm but the L. fermentum M1 was around (8 mm) activity, the L. acidophillus M2 and L. pentosus CH2 were no activity. The activity of L. fermentum M1 was showed 13 mm against to Bacillus subtilis NCIB3610. Among them, in 4%, the largest activity of bacteriocin from Lactobacillus pentosus CH2 against E. coli ATCC 25922 was shown 10 mm, but isolates were no activity against to Bacillus subtilis NCIB3610. Among them, 6%, the largest activity of bacteriocin from L. acidophillus M2 against E. coli ATCC 25922 was shown 11 mm, but isolates were no activity against to Bacillus subtilis NCIB3610. 8%, the largest activity of bacteriocin from L. fermentum M1 against E. co li ATCC 25922 was shown 11 mm, but isolates were no activity against to Bacillus subtilis NCIB3610. In 10%, no activity for bacteriocin from Lactobacillus sp. against E. coli ATCC 25922 and Bacillus subtilis NCIB3610. So that, the activity of dif- ferent bacteriocins were shown in 2% against E. coli ATCC 25922 and Bacillu s subtilis NCIB3610. 3.5.8. Effect of Different Vitamins Component on Crude Bacteriocin Activity The effects of different vitamins such as B12 and B com- plex on crude of bacteriocins were studied Table 26. In MRS broth, B12 increased the activity of bacteriocins isolated from Lactobacillus acidoph illus CH1 against to E. coli ATCC 25922 was 10 mm but the three other iso- lates no activity were observed, wherever four isolates were shown 10 to 11 mm against to Bacillus subtilis NCIB3610. Among them, in B complex, bacteriocin from Lactobacillus acidophilus CH1 against E. coli ATCC 25922 was shown 13 to 14 mm, the largest activity of bacteriocins for L. fermentum M1 and L. acidophilus CH1were shown15 mm against to Bacillus subtilis NCIB3610 and the smallest was showed 5 mm in L. aci- dophilus M2 and L. pentosus CH2. This result was agree with Adenike et al. [45]. Table 24. Effect of different concentration of Nacl on crude bacteriocin. E. coli ATCC 25922 Bacillus subtilis NCIB3610 Na Cl Strains L. fermentum M1 L. acidophils M2 L. Acidophils CH1 L. pentosus CH2 L. Fermentum M1 L. Acidophils M2 L. Acidophils CH1 L. pentosus CH2 Control 2 3 9 5 3 4 16 2 2% 10 11 11 14 15 14 10 10 4% 9 6 10 12 13 11 9 11 6% 0.0 0.0 9 11 5 10 9 10 8% 0.0 0.0 0.0 0.0 10 9 7 5 10% 0.0 0.0 0.0 0.0 0.0 0.0 0.0 0.0 Table 25. Effect of adding 21 amino acid on crude bacteriocin. E. coli B. subtilis 21 amino acid Strains L . fermentum 10 L. acidophilus 110 L . acidophilus L . pentosus 160 L . fermentum 10 L. acidophilus 111 110 L . acidophilus 111 L . pentosus 160 2% 8 0.0 0.0 9 13 12 11 0.9 4% 7 5 7 10 0.0 0.0 0.0 0.0 6% 0.0 11 9 0.0 7 5 6 0.0 8% 11 10 7 0.0 0.0 0.0 0.0 0.0 10% 9 0.0 0.0 10 9 7 5 0.0 Copyright © 2013 SciRes. FNS 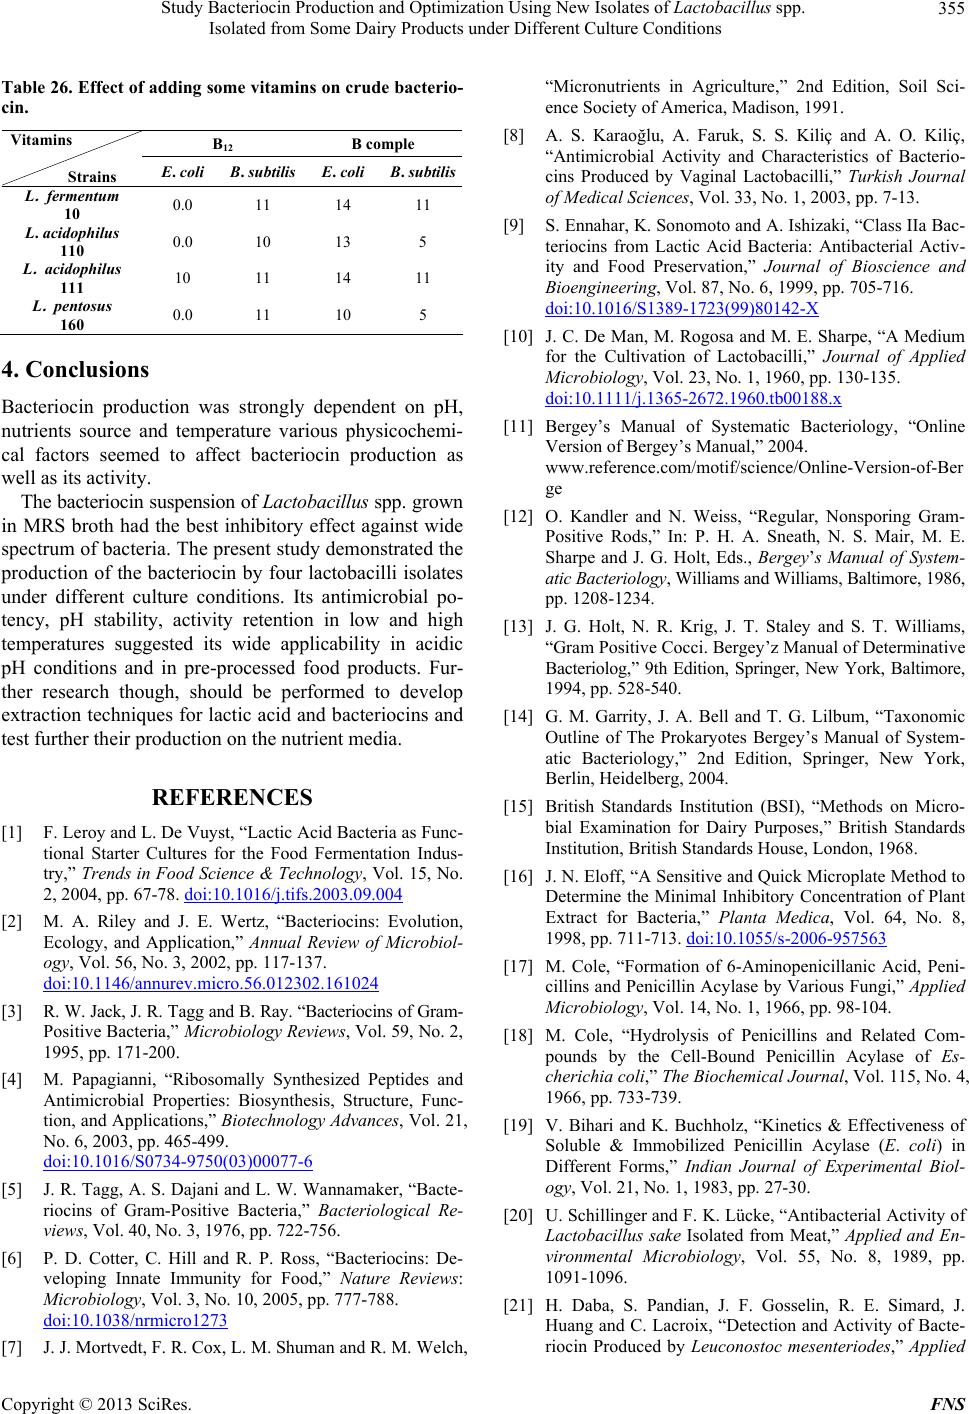 Study Bacteriocin Production and Optimization Using New Isolates of Lactobacillus spp. Isolated from Some Dairy Products under Different Culture Conditions 355 Table 26. Effect of adding some vitamins on crude bacterio- cin. B12 B comple Vitamins Strains E. coli B. subtilis E. coli B. subtilis L . fermentum 10 0.0 11 14 11 L. acidophilus 110 0.0 10 13 5 L . acidophilus 111 10 11 14 11 L . pentosus 160 0.0 11 10 5 4. Conclusions Bacteriocin production was strongly dependent on pH, nutrients source and temperature various physicochemi- cal factors seemed to affect bacteriocin production as well as its activity. The bacteriocin suspension of Lactobacillus spp. grown in MRS broth had the best inhibitory effect against wide spectrum of bacteria. The present study demonstrated the production of the bacteriocin by four lactobacilli isolates under different culture conditions. Its antimicrobial po- tency, pH stability, activity retention in low and high temperatures suggested its wide applicability in acidic pH conditions and in pre-processed food products. Fur- ther research though, should be performed to develop extraction techniques for lactic acid and bacteriocins and test further their production on the nutrient media. REFERENCES [1] F. Leroy and L. De Vuyst, “Lactic Acid Bacteria as Func- tional Starter Cultures for the Food Fermentation Indus- try,” Trends in Food Science & Technology, Vol. 15, No. 2, 2004, pp. 67-78. doi:10.1016/j.tifs.2003.09.004 [2] M. A. Riley and J. E. Wertz, “Bacteriocins: Evolution, Ecology, and Application,” Annual Review of Microbiol- ogy, Vol. 56, No. 3, 2002, pp. 117-137. doi:10.1146/annurev.micro.56.012302.161024 [3] R. W. Jack, J. R. Tagg and B. Ray. “Bacteriocins of Gram- Positive Bacteria,” Microbiology Reviews, Vol. 59, No. 2, 1995, pp. 171-200. [4] M. Papagianni, “Ribosomally Synthesized Peptides and Antimicrobial Properties: Biosynthesis, Structure, Func- tion, and Applications,” Biotechnology Advances, Vol. 21, No. 6, 2003, pp. 465-499. doi:10.1016/S0734-9750(03)00077-6 [5] J. R. Tagg, A. S. Dajani and L. W. Wannamaker, “Bacte- riocins of Gram-Positive Bacteria,” Bacteriological Re- views, Vol. 40, No. 3, 1976, pp. 722-756. [6] P. D. Cotter, C. Hill and R. P. Ross, “Bacteriocins: De- veloping Innate Immunity for Food,” Nature Reviews: Microbiology, Vol. 3, No. 10, 2005, pp. 777-788. doi:10.1038/nrmicro1273 [7] J. J. Mortvedt, F. R. Cox, L. M. Shuman and R. M. Welch, “Micronutrients in Agriculture,” 2nd Edition, Soil Sci- ence Society of America, Madison, 1991. [8] A. S. Karaoğlu, A. Faruk, S. S. Kiliç and A. O. Kiliç, “Antimicrobial Activity and Characteristics of Bacterio- cins Produced by Vaginal Lactobacilli,” Turkish Journal of Medical Sciences, Vol. 33, No. 1, 2003, pp. 7-13. [9] S. Ennahar, K. Sonomoto and A. Ishizaki, “Class IIa Bac- teriocins from Lactic Acid Bacteria: Antibacterial Activ- ity and Food Preservation,” Journal of Bioscience and Bioengineering, Vol. 87, No. 6, 1999, pp. 705-716. doi:10.1016/S1389-1723(99)80142-X [10] J. C. De Man, M. Rogosa and M. E. Sharpe, “A Medium for the Cultivation of Lactobacilli,” Journal of Applied Microbiology, Vol. 23, No. 1, 1960, pp. 130-135. doi:10.1111/j.1365-2672.1960.tb00188.x [11] Bergey’s Manual of Systematic Bacteriology, “Online Version of Bergey’s Manual,” 2004. www.reference.com/motif/science/Online-Version-of-Ber ge [12] O. Kandler and N. Weiss, “Regular, Nonsporing Gram- Positive Rods,” In: P. H. A. Sneath, N. S. Mair, M. E. Sharpe and J. G. Holt, Eds., Bergey’s Manual of System- atic Bacteriology, Williams and Williams, Baltimore, 1986, pp. 1208-1234. [13] J. G. Holt, N. R. Krig, J. T. Staley and S. T. Williams, “Gram Positive Cocci. Bergey’z Manual of Determinative Bacteriolog,” 9th Edition, Springer, New York, Baltimore, 1994, pp. 528-540. [14] G. M. Garrity, J. A. Bell and T. G. Lilbum, “Taxonomic Outline of The Prokaryotes Bergey’s Manual of System- atic Bacteriology,” 2nd Edition, Springer, New York, Berlin, Heidelberg, 2004. [15] British Standards Institution (BSI), “Methods on Micro- bial Examination for Dairy Purposes,” British Standards Institution, British Standards House, London, 1968. [16] J. N. Eloff, “A Sensitive and Quick Microplate Method to Determine the Minimal Inhibitory Concentration of Plant Extract for Bacteria,” Planta Medica, Vol. 64, No. 8, 1998, pp. 711-713. doi:10.1055/s-2006-957563 [17] M. Cole, “Formation of 6-Aminopenicillanic Acid, Peni- cillins and Penicillin Acylase by Various Fungi,” Applied Microbiology, Vol. 14, No. 1, 1966, pp. 98-104. [18] M. Cole, “Hydrolysis of Penicillins and Related Com- pounds by the Cell-Bound Penicillin Acylase of Es- cherichia coli,” The Biochemical Journal, Vol. 115, No. 4, 1966, pp. 733-739. [19] V. Bihari and K. Buchholz, “Kinetics & Effectiveness of Soluble & Immobilized Penicillin Acylase (E. coli) in Different Forms,” Indian Journal of Experimental Biol- ogy, Vol. 21, No. 1, 1983, pp. 27-30. [20] U. Schillinger and F. K. Lücke, “Antibacterial Activity of Lactobacillus sake Isolated from Meat,” Applied and En- vironmental Microbiology, Vol. 55, No. 8, 1989, pp. 1091-1096. [21] H. Daba, S. Pandian, J. F. Gosselin, R. E. Simard, J. Huang and C. Lacroix, “Detection and Activity of Bacte- riocin Produced by Leuconostoc mesenteriodes,” Applied Copyright © 2013 SciRes. FNS  Study Bacteriocin Production and Optimization Using New Isolates of Lactobacillus spp. Isolated from Some Dairy Products under Different Culture Conditions 356 and Environmental Microbiology, Vol. 57, No. 12, 1991, pp. 3450-3455. [22] S. T. Ogunbanwo, A. I. Sanni and A. A. Onilude, “Char- acterization of Bacteriocin Produced by Lactobacillus plantarum F1 and Lactobacillus brevis OG1,” African Journal of Biotechnology, Vol. 2, No. 8, 2003, pp. 219- 227. [23] P. M. Muriana and T. R. Klaenhammer, “Purification and Partial Characterization of Lactacin F, a Bacteriocin Pro- duced by Lactobacillus acidophilus 11088,” Applied and Environmental Microbiology, Vol. 57, No. 1, 1991, pp. 114-121. [24] K. Adinarayana and P. Ellaiah, “Response Surface Opti- mization of the Critical Medium Components for the Pro- duction of the Alkaline Protease by a Newly Isolated Ba- cillus sp.,” Journal Pharmacy & Pharmaceutical Sciences, Vol. 5, No. 3, 2003, pp. 272-278. [25] W. F. Harigon and M. E. McCane, “Laboratory Methods in Foods and Dairy Microbiology,” In: W. F. Harigon and M. E. McCane, Eds., Laboratory Methods in Foods and Dairy Microbiology, Academic Press, New York, 1976, pp. 12-15. [26] A. Galvez, R. L. Lopez, H. Abriouel, E. Valdivia and N. B. Omar, “Application of Bacteriocins in the Control of Food Borne Pathogenic and Spoilage Bacteria,” Critical Reviews in Biotechnology, Vol. 28, No. 2, 2008, pp. 125- 152. doi:10.1080/07388550802107202 [27] S. H. Ko and C. Ahn, “Bacteriocin Production by Lacto- coccus lactis KCA2386 Isolated from White Kimchi,” Food Science and Biotechnology, Vol. 9, No. 4, 2000, pp. 263-269. [28] A. R. Sarika, “Optimization Analysis of Free and Immo- bilized Bacteriocin Elaborated by Lactobacillus planta- rum MTCC B 1746 and Lactococ cus lactis MTCC B 440,” M.Sc. Dissertation, Manonmaniam Sundaranar University, Thirunelveli, 2003, p. 54. [29] H. S. Chin, J. S. Shim, J. M. Kim, R. Yang and S. S. Yoon, “Detection and Antibacterial Activity of a Bacte- riocin Produced by Lactobacillus plantarum,” Food Sci- ence and Biotechnology, Vol. 10, No. 2, 2001, pp. 335- 341. [30] M. S. Juarez Tomas, E. Bru, B. Wiese, A. Pesce de Ruiz Holgado and M. E. Nader-Macias, “Influence of pH, Temperature and Culture Media on the Growth and Bac- teriocin Production by Vaginal Lactobacillus salivarius CRL 1328,” Journal Applied Microbiology, Vol. 93, No. 4, 2002, pp. 714-724. doi:10.1046/j.1365-2672.2002.01753.x [31] B. E. Terzaghi and W. E. Sandine, “Improved Medium for Lactic Streptococci and Their Bacteriophages,” Ap- plied Microbiology, Vol. 29, No. 6, 1975, pp. 807-813. [32] P. Raibaud, J. V. Galpin, R. Ducluzeau, G. Mocquot and G. Oliver, “The ‘Lactobacillus’ Genus in the Digestive Tract of Rats. II. Characteristics of Heterofermentative Strains Isolated from ‘Holo-’ and ‘Gnotoxenic’ Rats,” Annales de Microbiologie, Vol. 124, No. 2, 1973, pp. 223-235. [33] S. R. Biswas, P. Ray, M. C. Johnson and B. Ray, “Influ- ence of Growth Conditions on the Production of a Bacte- riocin, Pediocin AcH by Pediococcus acidilactici H,” Ap- plied and Environmental Microbiology, Vol. 57, No. 4, 1991, pp. 1265-1267. [34] V. Karthikeyan and S. W. Santosh, “Isolation and Partial Characterization of Bacteriocin Produced from Lactoba- cillus plantarum,” African Journal of Microbiology Re- search, Vol. 3, No. 5, 2009, pp. 233-239. [35] A. A. O. Ogunshe, M. O. Omotoso and A. D. V. Ay- ansina, “Microbial Studies and Biochemical Characteris- tics of Controlled Fermented Afiyo—A Nigerian Fer- mented Food Condiment from Prosopis africana (Guill and Perr.) Taub,” Pakistan Journal of Nutrition, Vol. 6, No. 6, 2007, pp. 620-627. doi:10.3923/pjn.2007.620.627 [36] Ö. Şimşek, A. H. Çon and Ş. Tulumoĝlu, “Isolating Lac- tic Starter Cultures with Antimicrobial Activity for Sour- dough Processes,” Food Control, Vol. 17, No. 4, 2009, 263-270. doi:10.1016/j.foodcont.2004.10.011 [37] H. Fukushima, J. Kelstrup, S. Fukushima, T. Umemoto and H. Sagawa, “Isolation, Partial Purification and Pre- liminary Characterization of a Bacteriocin from Strepto- coccus mutants Rm-10,” Antonie van Leeuwenhoek, Vol. 49, No. 1, 1983, pp. 41-50. doi:10.1007/BF00457878 [38] M. C. Audisto, G. Oliver and M. C. Apella, “Effect of Different Complex Carbon Sources on Growth and Bac- teriocin Synthesis of Enterococcus faecium,” Int. J. Food Microbiol., 2001, 63, 235-241. doi:10.1016/S0168-1605(00)00429-3 [39] R. Geisen, B. Becker and W. H. Holzapfel, “Modelling the Bacteriocin Production of Leuconostoc carnosum,” FEMS Microbiology Reviews, 1993, Vol. 12-S, pp. 337- 340. [40] G. Vignolo, S. Fadda, M. N. DeKairuz, A. A. P. De Ruiz Holgdo and G. Olivier, “Control of Listeria monocyto- genes in Ground Beef by B. E. Terzaghi and W. E. Sandine,” Applied Microbiology, Vol. 29, No. 60, 1975, p. 807. [41] L. De Vugst and E. J. Vandamme, “Bacteriocins of Lactic Acid Bacteria, Microbiology, Genetic Application,” Blackie Academy and Professional, London, 1994. [42] S. Saharan, N. Dilbaghi and S. Sharma, “Optimization of Medium Conditions for the Production of Bacterio- cin-SN21 by Lactobacillus acidophilus,” Indian Journal of Microbiology, Vol. 38, No. 4, 1998, pp. 225-227. [43] S. D. Todorov and L. M. T. Dicks, “Lactobacillus plan- tarum Isolated from Molasses Produces Bacteriocins Ac- tive against Gram-Negative Bacteria,” Enzyme and Mi- crobial Technology, Vol. 36, No. 2-3, 2005, pp. 318-326. doi:10.1016/j.enzmictec.2004.09.009 [44] N. E. Pingitore Jr., J. W. Clague, M. A. Amaya, B. Ma- ciejewska and J. J. Reynoso, “Urban Airborne Lead: X- Ray Absorption Spectroscopy Establishes Soil as Domi- nant Source,” PLoS ONE, Vol. 4, No. 4, 2009, Article ID; e5019. doi:10.1371/journal.pone.0005019 [45] A. O. A. Ogunshe1, M. Z. Johnny and A. O. Arinze, “Ef- fects of Food Spices on Gram-Negative Food Indicator Bacteria from Some Nigerian Ethnic Fermented Plant Food Condiments,” African Journal of Plant Science, Vol. 6, No. 1, 2012, pp. 8-14. Copyright © 2013 SciRes. FNS
|