Advances in Computed Tomography, 2013, 2, 4-12
http://dx.doi.org/10.4236/act.2013.21002 Published Online March 2013 (http://www.scirp.org/journal/act)
Can CT Perfusion Guide Patient Selection for Treatment
of Delayed Cerebral Ischemia?
Pina C. Sanelli1,2*, Rachel Gold1, Nikesh Anumula1, Austin Ferrone1, Carl E. Johnson1,
Joseph P. Comunale1, Apostolos J. Tsiouris1, Howard Riina3, Halinder Mangat4,
Axel Rosengart4, Alan Z. Segal4
1Department of Radiology, Weill Cornell Medical Colleg e, New York, USA
2Department of Public Health, Weill Cornell Medical College, New York, USA
3Department of Neurological Surgery, Weill Cornell Medical College, New York, USA
4Department of Neurology, Weill Cornel l Medical College, New York, USA
Email: *pcs9001@med.cornell.edu
Received November 8, 2012; revised December 20, 2012; accepted January 4, 2013
ABSTRACT
Purpose: To evaluate qualitative and quantitative CT perfusion (CTP) for different treatment options of delayed cere-
bral ischemia (DCI) in aneurysmal SAH. Methods: Retrospective study of consecutive SAH patients enrolled in a pro-
spective IRB-approved clinical trial. Qu alitative analysis of CTP deficits were determined by two b linded neuroradiolo-
gists. Quantitative CTP was performed using standardized protocol with region-of-interest placement sampling the cor-
tex. DCI was assessed by clinical and imaging criteria. Patients were classified into treatment groups: 1) hyperten-
sion-hemodilution-hypervolemia (HHH); 2) intra-arterial (IA) vasodilators and/or angioplasty; 3) no treatment. Mean
quantitative CTP values were compared using ANOVA pairwise comparisons. Receiver operating characteristic (ROC)
curves, standard error (SE) and optimal threshold values were calculated. Results: Ninety-six patients were classified
into three treatment groups; 21% (19/96) HHH, 34% (33/96) IA-therapy and 46% (44/96) no treatment. DCI was diag-
nosed in 42% (40/96); of which 18% (7/40) received HHH, 80% (32/40) IA-therapy, and 2% (1/40) no treatment. CTP
deficits were seen in 50% (48/96); occurring in 63% (12/19) HHH, 94% (31/33) IA-therapy, and 11% (5/44) no treat-
ment. Presence of CTP deficits had 83% sensitivity, 8 9% specificity, 90% positive pred ictive and 81% negativ e predic-
tive values for treat ment. Mean quantitative CTP valu es revealed significant differences in CBF (p < 0.0001) and MTT
(p = 0.0001) amongst the treatment groups. ROC analysis revealed CBF with the highest accuracy of 0.82 (SE 0.04) for
comparing treatment groups. Threshold an alysis calculated CBF of 30 mL/100 gm/min (89% specificity, 7 1% sensitiv-
ity) for determining treatment. Conclusion: These in itial findings of significant differences in CTP deficits for different
treatment groups suggest that CTP may have a potential role in guiding patient selection for treatment of DCI.
Keywords: CT Perfusion; Aneurysmal Subarachnoid Hemorrhage; Delayed Cerebral Ischemia; Treatment
1. Introduction
Delayed cerebral ischemia (DCI) is a serious complica-
tion following aneurysmal SAH, and is the leading cause
of morbidity and mortality in this patient population. Its
pathophysiology is complex and poorly understood lead-
ing to delayed diagnosis. However, proximal vasospasm
is thought to partly contribute to DCI causing reduced
cerebral blood flow (CBF) to the distal vascular territory
[1-3]. DCI manifests as clinical deterioration typically
developing between 4 - 14 days following the initial an-
eurysm rupture with symptoms of focal neurological im-
pairment (such as hemiparesis, hemiplegia, aphasia, etc.),
or a decrease of at least 2 points on the Glasgow Coma
Scale. Early diagnosis and prompt treatment of DCI may
prevent its devastating sequelae of permanent neurologic
deficits, cerebral infarction and death.
There are several treatment options for DCI typically
used in clinical practice. Medical management with hy-
pervolemic, hemodilution and hypertensive (HHH) ther-
apy is commonly used as the initial treatment. HHH is a
systemic therapy used to improve global cerebral perfu-
sion by increasing both blood pressure and flow to the
brain. For patients that do not adequately respond to
HHH therapy, more selective invasive intra-arterial (IA)
therapy is performed to immediately dilate an artery in
spasm using vasodilatory medications and/or angioplasty
in order to improve the blood flow to a specific region of
the brain. However, in some patients continuous close
observation in the neuro-intensive care unit (N-ICU) set-
ting is sufficient depending on the patient’s clinical con-
*Corresponding a uthor.
C
opyright © 2013 SciRes. ACT
P. C. SANELLI ET AL. 5
dition and considering the risks associated with both
HHH and IA-therapy. The main complications that may
occur with HHH are cerebral edema, aneurysm re-bleed-
ing, pulmonary edema, and potential cardiac injury re-
lated to the aggressive use of pressor type medications
[4]. Several important risks associated with IA-therapy
include vascular injury (such as dissection and vessel
rupture), cerebral infarction and death related to the arte-
rial catheterization techniques and balloon angioplasty.
Therefore, more accurate assessment of patients who
require treatment of DCI is critical to improve patient
selection in order to provide maximal treatment benefit
and to minimize exposing patients to unnecessary serious
risks.
Several methods are used for the diagnosis of DCI re-
lated to vasospasm, including clinical examination, neu-
rologic monitoring devices, transcranial Doppler ultra-
sound (TCD), CTA, and DSA. Many institutions have
also employed CT perfusion (CTP) to evaluate the
hemodynamic status of the brain at the capillary level.
CTP is a dynamic imaging study using cine scanning to
capture the first pass of contrast through the brain to as-
sess cerebral perfusion. The acquired dataset is post-pro-
cessed using a deconvolution algorithm to construct the
perfusion maps of CBF, cerebral blood volume (CBV)
and mean transit time (MTT). The principle of CTP is
that these perfusion parameters can be derived from the
mathematical algorithm that describes the relationship
between the arterial input, capillary flow and venous
drainage. The arterial and venous time attenuation curves
are obtained from the acquired dataset, representing the
time series data of contrast through the brain. Two as-
sumptions are made with CTP including that blood and
contrast have the same hemodynamic properties and
there is a linear relationship between contrast concentra-
tion in the brain with the measured Hounsfield units.
There are several advantages of CTP compared with
other perfusion imaging techniques, including its non-
invasiveness, short acquisition time, widespread avail-
ability, and limited patient contraindications lending to
its usefulness in this critically ill patient population. In
the literature, several studies have reported the ability of
CTP to detect impairment of cerebral perfusion thought
to occur in the development of DCI and vasospasm
[1-3,5]. However, not all perfusion deficits correlate with
symptoms of DCI or arterial narrowing on imaging stud-
ies, indicating that not all perfusion deficits require
treatment. In particular, the issue of which perfusion
deficits require treatment with HHH and/or IA-therapy
has not been fully explored. Thereby, further under-
standing of these CTP deficits is needed in order to im-
prove patient selection for treatment of DCI. Quan titative
differences in CTP deficits may assist in identifying pa-
tients earlier who require treatment, particularly in pa-
tients with limited clinical assessments, uncertain clinical
findings, and discrepant clinical and imaging data, that
may lead to delayed diagnosis and treatment.
The purpose of this study is to evaluate qualitative and
quantitative CTP for different treatment options of DCI
in aneurysmal SAH. Our hypothesis is that there are sta-
tistically significant differences in the CTP parameters in
patients who are selected for different treatment regi-
mens.
2. Materials and Methods
2.1. Study Design
A retrospective study of 104 consecutive aneurysmal
SAH patients enrolled in a prospective clinical trial fro m
December 2004 to December 2008 was performed. This
study was approved by the institutional review board
(IRB) and a health insurance portability and accountabil-
ity act (HIPAA) waiver was obtained. Inclusion criteria
were adult patients (18 years and older) with documented
aneurysmal SAH at admission based on the initial non-
contrast head CT, cerebrospinal fluid analysis, CTA and/
or DSA. Exclusion criteria were CTP exams performed
after treatment of DCI or after cerebral infarction oc-
curred. All subjects in the study underwent surg ical clip-
ping and/or endovascular coiling for aneurysm repair and
were monitored in the N-ICU, as per usual standard-of-
care. Chart review was performed for the clinical and de-
mographic characteristics of the study population, in-
cluding age, gender, aneurysm location and treatment,
and Hunt Hess grades on presentation. Treatment man-
agement decisions were based on all clinical and imaging
data available, with the exception of CTP. Patients were
categorized into three treatment groups as 1) medical
HHH only; 2) IA-therapy; and 3) no treatment (close
observation). Patients classified in the IA-therapy group
did not adequately respond to HHH as the initial treat-
ment.
The diagnosis of DCI was determined for each treat-
ment group to assess appropriate classification of patients.
DCI was determined in this cohort by incorporating the
most relevant clinical and imaging outcome measures, as
recommended by the recent consensus expert opinion [6].
Furthermore, Reichman et al. developed and evaluated a
reference standard incorporating these outcomes meas-
ures to assess aneurysmal SAH patients applicable to
clinical practice [7]. This reference standard consists of
angiographic criteria for vasospasm based on the arterial
luminal narrowing on DSA compared with the normal
parent vessel and comparison with DSA performed on
initial presentation. In this study, DSA interpretations
were performed by two observers, one of two intervene-
tional neuroradiologists at our institution who performed
the exam (with either 10 or 25 years experience) and a
neuroradiologist blinded to all patient information (22
Copyright © 2013 SciRes. ACT
P. C. SANELLI ET AL.
6
years’ experience). For disagreements, a third neurora-
diologist (10 years’ experience) independently reviewed
the exam in a blinded fashion. In patients who did not
have DSA performed, the following clinical and/or im-
aging criteria were used: a) clinical criteria—a permanent
neurologic deficit on clinical examination, distinct from
the deficit at baseline produced by the SAH event or sur-
gical intervention, which was not attributable to other
causes; b) imaging criteria-cerebral infarction on fol-
low-up CT and/or MR imaging that occurred after day 4.
This criterion has been used to effectively exclude pri-
mary brain damage from SAH and/or surgical intervene-
tion [8].
Clinical outcome measures were also determined for
each treatment group to further assess appropriate classi-
fication of patients. At discharge from the N-ICU, pa-
tients were evaluated for a permanent neurologic deficit
on physical examination and cerebral infarction on fol-
low-up CT and/or MR imaging. Discharge status was
also documented as home, rehabilitation care facility
(acute rehabilitation or long-term skilled nursing), and
death.
2.2. CTP Scanning Protocol, Post-Processing and
Data Collection
CTP was performed during the typical time-period for
DCI, between days 6 - 8 in asymptomatic patients and on
the same day clinical deterioration occurred in sympto-
matic patients. There is a standard scanning protocol for
CTP at our institution using GE Lightspeed or Pro—16
scanners (General Electric Medical Systems, Milwaukee,
WI) with cine 4i scanning mode and 45 second acquisi-
tion at 1 rotation per second using 80 kVp and 190 mA.
A scanning volume of 2.0 cm was used consisting of 4
slices at 5.0 mm thickness with its inferior extent se-
lected at the level of the basal ganglia, above the orbits,
to minimize radiation exposure to the lenses. Approxi-
mately 45 mL of nonionic iodinated contrast was admin-
istered intravenously at 5 mL/s using a power injector
with a 5-second delay.
Post-processing of the acquired images into cerebral
blood flow (CBF), cerebral blood volume (CBV) and
mean transit time (MTT) maps were performed on a GE
Advantage Workstation using CTP software version 3.0
(General Electric Medical Systems). This software em-
ploys a deconvolution method, which is considered most
accurate for low contrast injection rates [9]. The post-
processing technique was standardized for all patients
according to recommended guidelines [10] with the arte-
rial input function as the A2 segment of the anterior
cerebral artery (ACA) [11] and venous function as the
superior sagittal sinus.
The perfusion maps were qualitatively evaluated by
two neuroradiol ogi st s (10 a nd 7 years e xperience) blin ded
to clinical and imaging data to determine the presence of
perfusion deficits, defined as areas of reduced CBF and/
or prolonged MTT. Focal perfusion abnormalities due to
the primary hemorrhagic event and su rgical intervention,
as identified on the acquired images from the CTP data-
set, were not included as perfusion deficits related to DCI.
After reviewing the images independently, consensus ju-
dgment was determined.
Quantitative analysis was conducted using a standard-
ized method with contiguous regions-of-interest (ROI)
placement, measuring 157 mm2, sampling the cerebral
cortex. Each CTP slice had up to 24 ROIs distributed in
the following territories: approximately 6 ROIs in ACA,
12 ROIs in middle cerebral artery (MCA) and 6 ROIs in
posterior cerebral artery (PCA). CTP studies were ana-
lyzed blinded to all clinical a nd imaging data to li mit test
review bi a s.
2.3. Statistical Analysis
Only CTP exams performed at the diagnostic stage, prior
to treatment for DCI and prior to cerebral infarction,
were included in the analysis in order to minimize con-
founding bias as both treatment and infarction affect the
cerebral perfusion maps. The incidence of qualitative
CTP deficits in each treatment group was calculated.
CTP test characteristics (sensitivity, specificity, positive
and negative predictive values) were determined using 2
× 2 table analysis with 95% confidence intervals (CI).
Quantitative CTP data was analyzed by calculating the
mean CBF, CBV and MTT and its standard deviation
(SD) for the three treatment groups. For patients with
focal perfusion deficits, ROIs within the affected region
were isolated and arithmetic means were calculated. In
patients without focal deficits, all ROIs for all 4 slice
locations were included in the arith metic means. In order
to minimize the contribution of vascular pixels from
large vessels, CBF values >100 mL/100 gm/min were
excluded from the statistical analysis and not used in
calculating the me an CBF, CBV and MTT , as this method
has been published in the evaluation of ischemia [12].
The ROIs in the perfusion abnormalities due to the pri-
mary hemorrhagic event and/or surgical intervention,
were not included in the statistical analysis. Normality of
the distribution of continuous variables was assessed by
plotting histograms and the Shapiro Wilks test. Com-
parison between the treatment groups was performed
using ANOVA pairwise comparisons. Statistical signifi-
cance was accepted at p < 0.05. Receiver operator char-
acteristic (ROC) curves were generated for each CTP pa-
rameter and the area-under-the-curve (AUC) calculated
to quantify the overall accuracy. Maximum-likelihood
ROC models and standard error (SE) were fitted assum-
ing a binormal distribution for the underlying latent
variable. The threshold values for CBF, MTT and CBV
Copyright © 2013 SciRes. ACT
P. C. SANELLI ET AL.
Copyright © 2013 SciRes. ACT
7
were assessed using the northwest corner method, repre-
senting the point va lue on the ROC curve with the great-
est discrimination ability between treatment groups. The
statistical analysis was performed by a biostatistician
using Stata version 10 and R version 2.7.2 software.
3. Results
3.1. Study Population Characteristics
A total of 96 aneurysmal SAH patients were included in
the statistical analysis from the 104 patients enrolled in
the prospective clinical trial. Eight patients were ex-
cluded for the following reasons: CTP exams were not
performed prior to treatment for DCI (n = 4), CTP ac-
quired data was not retrievable from the archives for
post-processing in this study (n = 3), and post-processing
could not be performed due to severe motion degradation
(n = 1). The median age (range) was 49 years old (28 -
80 years) with a 73% (70/96) female predominance.
Ninety-two percent (88/96) of the aneurysms were lo-
cated in the anterior circulation. The treatment for aneu-
rysm repair in this study population was 54% (52/96)
surgical clipping and 46% (44/96) endovascular coiling
procedures. The clinical Hunt Hess grades on presenta-
tion were 48% (46/96) high grades 3, 4 and 5 and 52%
(50/96) l o w g r a des 1 and 2.
The study population was defined into three treatment
groups; 20% (19/96) of patients received HHH only,
34% (33/96) underwent IA-therapy and 46% (44/96) re-
ceived no treatment (close observation).
3.2. Qualitative CTP Analysis
The median day CTP was performed was day 7 after
aneurysm rupture. Qualitative CTP deficits were seen in
50% (48/96) of the study population, occurring in 95%
(38/40) of patients with DCI and 18% (10/56) without
DCI. These CTP deficits were seen in 94% (31/33) of
patients who underwent IA-therapy, 63% (12/19) who
received HHH, and 11% (5/44) who did not receive
treatment. The test characteristics (95% CI) for qualita-
tive CTP deficits were 83% (70% - 91%) sensitivity,
89% (76% - 95%) specificity, 90% (7 8% - 95%) positive
predictive value, and 81% (68% - 90%) negative predic-
tive value for determining patients requiring treatment.
3.3. Quantitative CTP Analysis
The mean quantitative values and standard deviation for
CBF, CBV and MTT for each treatment group are shown
in Table 1. There are statistically significant differences
in the CBF and MTT values amongst the three treatment
groups. Specifically, pairwise comparisons showed a sta-
tistically significant difference between the no treat-
ment and IA-therapy groups for the CBF (p < 0.0001),
CBV (p = 0.0343) an d MTT (p < 0.000 1) . Fur ther more, a
statistically significant difference was also seen between
the HHH and IA-therapy groups only for CBF (p =
0.0406).
ROC curve analysis comparing the treatment and no
treatment groups revealed that CBF and MTT had the
highest overall accuracy of 0.82 (SE 0.04) and 0.81 (SE
0.05), respectively (Figure 1(a)). A similar trend is seen
in the analysis comparing the HHH and IA-therapy
groups with the highest overall accuracy for CBF of 0.72
(SE 0.07) an d MTT of 0.69 ( SE 0 .08) (Figure 1(b)).
Threshold analysis was performed using the northwest
corner method to determine the CTP value with the grea-
test discrimination ability between the treatment groups
(Table 2).
3.4. Clinical Outcomes
DCI was diagnosed in 42% (40/96) of patients according
to the clinical and imaging criteria used in this study. In
the IA-therapy group, 97% (32/33) of patients were clas-
sified as DCI compared to 37% (7/19) in the HHH and
2% (1/44) in the no treatment groups. Since DCI was
determined retrospectively using defined criteria for the
purpose of this study, all treatment decisions were based
on the clinical and imaging data available at the time of
decision-making, with the exception of CTP.
Patient outcomes were evaluated using clinical and
imaging criteria at the time of discharge from the N-ICU
(Table 3). The IA-therapy group had the highest occur-
rence of permanent neurologic deficits and cerebral in-
farction, followed by the HHH and no treatment groups.
The discharge status was also evaluated as a surrogate
outcome measure (Table 4). A similar trend was also
observed in the IA-therapy group having the worst out-
comes with the highest mortality rate during hospitaliza-
tion and the highest occurrence of patients requiring
Table 1. Mean quantitative CTP values and standard deviation for each treatment group.
Mean (SD) No treatment HHH IA p-value
CBF (mL/100 gm/min) 40.6 (11.1) 33.2 (15.4) 24.4 (11.9) <0.0001
CBV (mL/100 gm) 2.01 (0.51) 1.99 (0.68) 1.71 (0.66) 0.0825
MTT (sec) 4.7 (1.7) 6.6 (4.3) 7.4 (2.7) 0.0001
P. C. SANELLI ET AL.
8
(a)
(b)
Figure 1. Receiver operator characteristic (ROC) curves of CBF, CBV and MTT for comparison of treatment groups.
Table 2. Threshold analysi s for treatment options; (a) Treat-
ment vs. no treatment; (b) HHH vs. IA-therapy.
(a)
Threshold Specificity/Sensitivity
CBF 30 %71%/89
MTT 5.1 %71%/75
CBV 1.7 %52%/75
(b)
Threshold Specificity/Sensitivity
CBF 26 %79%/74
MTT 6.4 %61%/74
CBV 1.5 %52%/84
Table 3. Clinical outcomes determined by clinical and im-
aging criteria.
Total
(n = 96)
No
treatment
(n = 44)
HHH
(n = 19) IA
(n = 33)
Functional
deficit/disability 28% (27/96) 11% (5/44) 26% (5/19) 52% (17/33)
Cerebral
infarction 14% (13/96) 0% 11% (2/19) 33% (11/33)
rehabilitative care following discharg e.
4. Discussion
DCI related to vasospasm is a complex entity involving
Table 4. Discharge status for treatment gr oups.
Discharge
status Total
(n = 96)
No
treatment
(n = 44)
HHH
(n = 19) IA (n = 33)
Home 52% (50/96)68% (30/44) 53% (10/19)30% (10/33)
Rehabilitative
care 43 % (41/96)32% (14/44) 42% (8/19)58% (19/33)
Acute
rehabilitation 33% (32/96)23% (10/44) 26% (5/19)52% (17/33)
Long-term
skilled 10% (9/96)9% (4/44) 16% (3/19)6% (2/33)
Death 5% (5/96)0% 5% (1/19) 12% (4/33)
delayed narrowing of the intracranial arteries that may
lead to clinical deterioration, cerebral infarction and
death. Current treatment options include medical man-
agement with HHH as the initial treatment to increase
systemic blood pressure and flow in order to globally
increase cerebral perfusion. Typically, if patients do not
adequately respond to HHH then more invasive tech-
niques, such as intra-arterial therapy with vasodilatory
medications and/or angioplasty, are used to improve re-
gional blood flow by selectively dilating individual cere-
bral arteries. Finally, close observation in the N-ICU may
also be sufficient in some patients given the life-threaten-
ing complications associated with both HHH and IA-
therapy. Therefore, more accurate patient selection for
treatment of DCI is critical in order to provide maximal
treatment benefit while minimizing exposure of patients
to serious risks.
Copyright © 2013 SciRes. ACT
P. C. SANELLI ET AL. 9
In current practice, patient selection for treatment of
D
limited due to few studies
pe
if there are qualitative
CI is based on clinical signs and symptoms coupled
with imaging information of arterial narrowing for vaso-
spasm. In recent years, CTP has also been used as a
complimentary diagnostic tool for evaluation of DCI
related to vasospasm. Specifically, qualitative CTP defi-
cits have a high sensitivity and specificity [1-3,5,13-15]
for vasospasm reported in 97% of patients with vaso-
spasm compared to 24% without vasospasm [5]. Fur-
thermore, Aralasmak et al. correlated CTP deficits and
the degree of vessel narrowing with CTP deficits occur-
ring in 83% of patients with severe vasospasm compared
to 26% with mild-moderate and 15% without vasospasm
[2]. Dankbaar et al. also demonstrated that the flow terri-
tory of the vessel with the most severe vasospasm corre-
sponded with the least perfused region on CTP [16].
More recently, investigations have focused on using quan-
titative CTP and determining a threshold value. Several
studies have reported CBF and MTT with the highest
diagnostic accuracy for DCI [3,5,16]. A CBF threshold
of 35 mL/100 gm/min (90% sensitivity, 68% specificity)
and MTT threshold of 5.5 sec (73% sensitivity, 79%
specificity) have been reported [5]. Similarly, Dankbaar
et al. described an MTT threshold of 5.9 sec for DCI [16].
Wintermark et al. also described the utility of CTP in the
diagnosis and management of vasospasm suggesting that
a CBF threshold of 39 .3 mL/100 gm/min repr esented the
most accurate (94.8%) indicator for endovascular therapy
[3]. These results support the possibility that CTP-based
criteria may be able to assist in differentiating patients
according to the severity of DCI in attempts to guide pa-
tient selection for treatment.
A review of the literature is
rformed in evaluating imaging based criteria for pa-
tient selection for treatment of DCI. In recent years, it is
becoming more apparent that image-based criteria may
have a role in patient selection for treatment of acute
stroke. Turk et al. reported similar rates of good func-
tional outcome and low rates of intracranial hemorrhage
when endovascular treatment was performed based on
CTP rather than time-guided selection [17,18]. This po-
tential for image-based criteria may also have a role in
aneurysmal SAH, particularly in patients with limited
clinical examination, uncertain clinical findings, or dis-
crepant clinical and imaging data. In the prospective ma-
nagement of patients, which perfusion deficits require
treatment with HHH and/or IA-therapy still remains un-
certain because not all perfusion deficits correspond to
symptoms of DCI or arterial narrowing on imaging stud-
ies indicating that not all perfusion deficits require treat-
ment (Figure 2). Thereby, further quantitative analysis of
CTP deficits is needed to differentiate treatment groups
in order to guide patient selection.
Our study focused on determining
(a)
(b)
(c)
Figure 2. 57-year-old status coil embolization of a right
infarction on follow-up CT imaging.
post
posterior communicating artery aneurysm. CT perfusion
was performed on day 7 for the purposes of the study pro-
tocol and shows a focal perfusion deficit with elevated MTT
(a) and reduced CBF (b) in the right MCAterritory in the
parietal region. Quantitative evaluation of the perfusion
deficit reveals a CBF of 37 mL/100 gm/min. The patient was
asymptomatic and noncontrast CT (c) reveals no corre-
sponding abnormality in this region. The patient did not
receive treatment and was discharged home with resump-
tion of normal daily activities. There was no evidence of a
permanent neurologic deficit on clinical exam or cerebral
Copyright © 2013 SciRes. ACT
P. C. SANELLI ET AL.
10
and/or quantitative differences in CTP deficits for dif-
ferent treatment groups of DCI. The presence of a CTP
deficit has a 90% positive predictive value for treatment.
CTP deficits occurred in 94% (31/33) of the IA-therapy
and 63% (12/19) of HHH groups compared to 11% (5/44)
of the no treatment group. Further quantitative analysis
revealed that CBF was the only perfusion parameter that
showed a statistically significant difference in the pair-
wise comparisons of all three treatment groups. In addi-
tion, ROC curve analyses supported that CBF has the
highest accuracy for determining the treatment group
(Figure 1). Using this data, threshold analysis can be
performed to help guide patien t selection by determining
the CBF value on the ROC curve with the greatest dis-
crimination ability between treatment groups. In this
study, a CBF threshold of 30 mL/100 gm/min can be
used as a guideline for a patient that should be carefully
considered for treatment of DCI. Furthermore, a CBF
threshold of 26 mL/100 gm/min can be used as a rough
guide for possibly considering patients who may also
require more invasive techniques with IA-therapy. Given
the proximity of these two threshold values, caution is
emphasized when using absolu te quantitative CTP values
for the diagnosis and management of patients in clinical
practice. The use of quantitative threshold values is lim-
ited in clinical practice due to differences in scanner
equipment, techniques and post-processing methods em-
ployed. Importantly, standardization and validation of
CTP methodology and post-processing techniques are
necessary for its widespread implementation in SAH pa-
tients.
In this study, CTP deficits in the IA-therapy group had
the most severely reduced CBF and prolonged MTT
(Figure 3). The IA-therapy group had 97% of patients
diagnosed with DCI, whereas the no treatment group had
only 2% of patients with DCI. As expected, the IA- the-
rapy group also had the worst outcomes with the highest
mortality rate (12%) and greatest percentage of patients
with functional disability (52%) and cerebral infarction
(33%). Whereas patients who had no treatment with
close observation, the mean CBF and MTT values were
within normal ranges. Improved outcomes were seen in
the no treatment group with the highest rate of patients
discharged home (68%), lowest incidence of functional
disability (11%) and no cerebral infarction on follow-up
CT/MR imaging. These findings support that there was
appropriate classification of aneurysmal SAH patients in
the different treatment groups.
We acknowledge several limitations in this study; in-
cluding the retrospective study design limiting the out-
comes data collection, specifically for clinical informa-
tion. In addition, CTP provides limited brain coverage
for evaluation of perfusion deficits. However, emerging
CT scanner technology will continue to improve and
(a)
(b)
(c)
Figure 3. 35 year-old status post surgical clipping of a right
posterior communicating a aneurysm and developed rtery
new left-sided upper extremity hemiparesis and pronator
drift on day 6. Noncontrast CT (a) demonstrates no new
hemorrhage or hydrocephalus to explain the patient’s sym-
ptoms. However, there is early hypodensity involving the
right basal ganglia. CT perfusion performed the same day
shows a large perfusion deficit in the right MCA territory
in the frontal and parietal regions and focal perfusion defi-
cit in the left ACA territory with elevated MTT (b) and
reduced CBF (c). Quantitative evaluation reveals a CBF of
18 mL/100 gm/ min in the right MCA and CBF of 17 mL/
100 gm/min in the left ACA perfusion deficits. The patient
received HHH therapy and also underw ent IA-therapy wi th
verapamil and angioplasty of the right MCA and left ACA.
Patient developed cerebral infarction in the right anterior
temporal lobe and basal ganglia.
Copyright © 2013 SciRes. ACT
P. C. SANELLI ET AL. 11
provide broader coverage for which this data may be
applicable. Another limitation is that the region of CTP
imaging was not coordinated with the location of the
arterial narrowing on DSA or region referable to symp-
toms. Therefore, it is conceivable that this region may
not have been imaged on the CTP or possibly averaged
with a larger region of normal perfusion, resulting in in-
creased false negatives and lower accuracy in our study.
This method was not used in order to reduce work-up
and observer bias by not having knowledge of the clini-
cal exam and DSA results prior to CTP scanning and in-
terpretation.
5. Conclusion
There is a clinical need to more accurately select aneu-
nts for treatment of DCI in order to
This publication was made possible by Grant Num
ational Institute of
[1] J. W. Dankbaar, N. K. de Rooij, B. K. Velthius, C. J.
Frijns, G. J. Rchaaf, “Diagnosing
Delayed Cerebrent CT Modalit
rysmal SAH patie
provide maximal treatment benefit while minimizing
patient exposure to serious complications. Critically ill
and comatose patients with limited clinical examinations,
uncertain clinical findings, and discrepant clinical and
imaging data remain challenging to assess for treatment.
CTP provides additional information regarding hemody-
namic disturbance in the brain. Qualitative CTP deficits
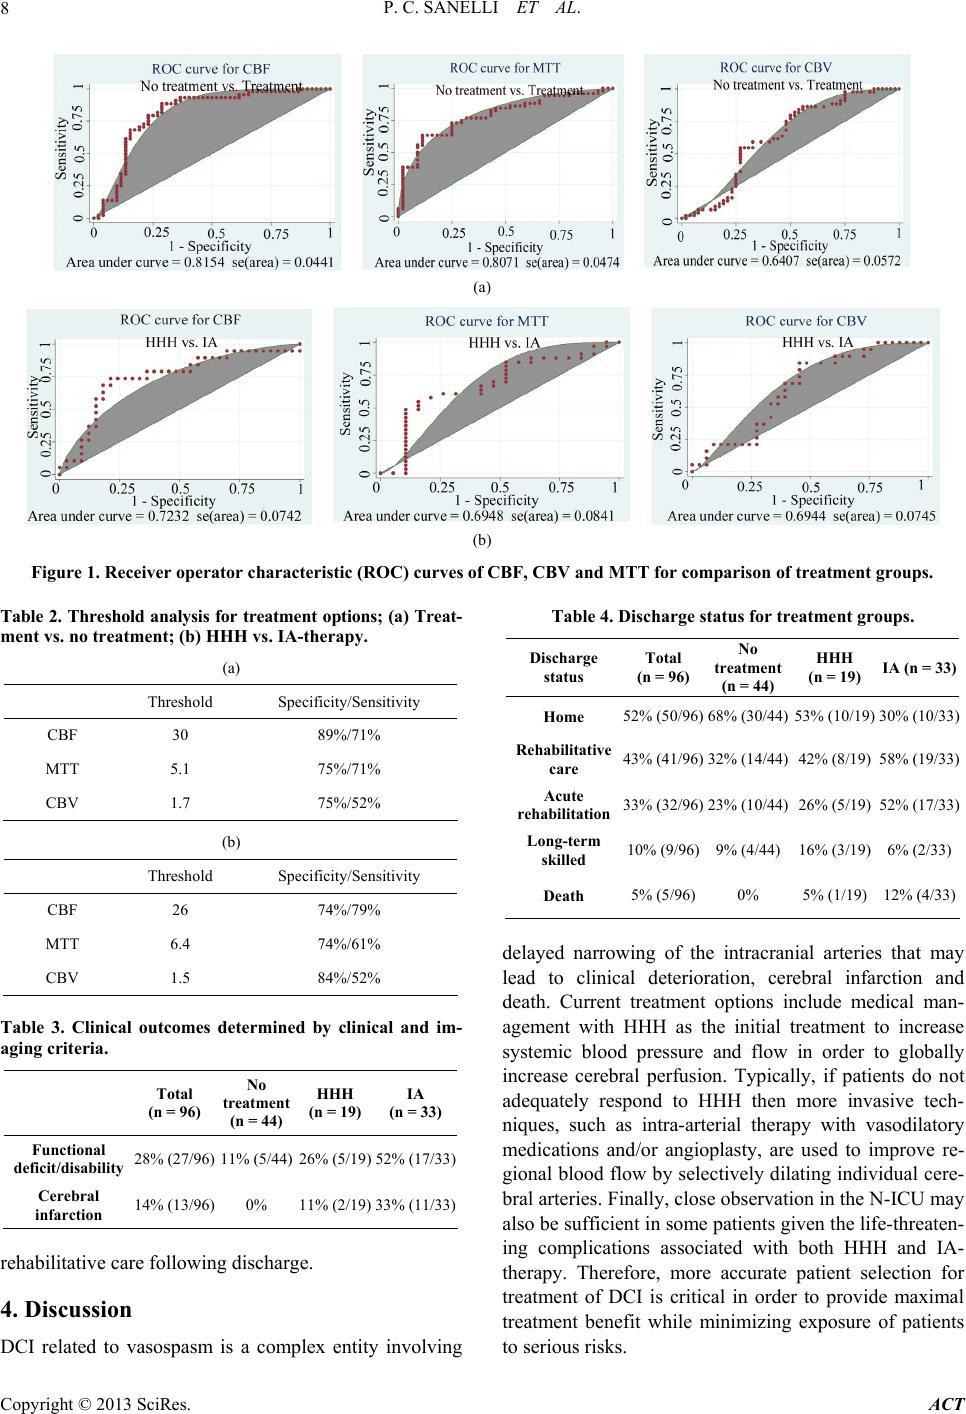
have a 90% positive predictive value for determining
patients who require treatment. Since it remains uncer-
tain which perfusion deficits require HHH and/or IA-
therapy, further evaluation with quantitative analysis is
needed to differentiate treatment groups. In this study,
CBF showed statistically significant differences for the
different treatment groups. CBF also had the highest ac-
curacy and discrimination ability on the ROC curve for
determining treatment groups using threshold analysis.
These preliminary findings support continued work in
this field with larger prospective clinical trials as CTP
may have a role in guiding patient selection for treatment
of DCI by its quantitative evaluation of perfusion defi-
cits.
6. Acknowledgements
ber
Neu- 5K23NS058387-02 from the N
rological Disorders and Stroke (NINDS), a component of
the National Institutes of Health (NIH). Its contents are
solely the responsibility of the authors and do not neces-
sarily represent the official view of NINDS or NIH.
REFERENCES
inkel and I. C. van der S
ral Ischemia with Diffe
ies
in Patients with Subarachnoid Hemorrhage with Clinical
Deterioration,” Stroke, Vol. 40, No. 11, 2009, pp. 3493-
3498. doi:10.1161/STROKEAHA.109.559013
[2] A. Aralasmak, M. Akyuz, C. Ozkaynak, T. Sindel and R.
Tuncer, “CT Angiography and Perfusion Imaging in Pa-
tients with Subarachnoid Hemorrhage: Correlation of Va-
sospasm to Perfusion Abnormality,” Neurora diology, Vol.
51, No. 2, 2009, pp. 85-93.
doi:10.1007/s00234-008-0466-7
[3] M. Wintermark, N. U. Ko, W. S. Smith, S. Liu, R. T.
Higashida and W. P. Dillon
chnoid Hemorrhage: Utility of Pe
, “Vasospasm after Subara-
rfusion CT and CT An-
Subarachnoid Haemorrhage,” Lancet Neurology,
giography on Diagnosis and Management,” AJNR Ameri-
can Journal of Neuroradiology, Vol. 27, No. 1, 2006, pp.
26-34.
[4] J. Sen, A. Belli, H. Albon, L. Morgan, A. Petzold and N.
Kitchen, “Triple-H Therapy in the Management of Aneu-
rysmal
Vol. 2, No. 10, 2003, pp. 614-621.
doi:10.1016/S1474-4422(03)00531-3
[5] P. C. Sanelli, I. Ugorec, C. E. Johnson, J. Tan, A. Z. Se-
gal, M. Fink, et al., “Using Quantita
Evaluation of Delayed Cerebral Is
tive CT Perfusion for
chemia Following
Aneurysmal Subarachnoid Hemorrhage,” AJNR American
Journal of Neuroradiology, Vol. 32, No. 11, 2011, pp.
2047-2053. doi:10.3174/ajnr.A2693
[6] M. D. I. Vergouwen, M. Vermeulen, J. van Gijn, G. J.
Rinkel, E. F. Wijdicks, J. P. Muizelaar, et al., “Definition
of Delayed Cerebral Ischemia After Aneurysmal Suba-
rachnoid Hemorrhage as an Outcome Event in Clinical
Trials and Observational Studies: Proposal of a Multidis-
ciplinary Research Group,” Stroke, Vol. 41, No. 10, 2010,
pp. 2391-2395. doi:10.1161/STROKEAHA.110.589275
[7] M. B. Reichman, E. D. Greenberg, R. L. Gold and P. C.
Sanelli, “Developing Patient-Centered Outcome Meas-
ures for Evaluating Vasospasm in Aneurysmal Subara-
chnoid Hemorrhage,” Academic Radiology, Vol. 16, No.
5, 2009, pp. 541-545. doi:10.1016/j.acra.2009.01.018
[8] J. A. Frontera, A. Fernandez, J. M. Schmidt, J. Claassen,
K. E. Wartenberg, N. Badjatia, et al., “Defining Vaso-
spasm after Subarachnoid Hemorrhage: What Is the Most
Clinically Relevant Definition?” Stroke, Vol. 40, No. 6,
2009, pp. 1963-1968.
doi:10.1161/STROKEAHA.108.544700
[9] M. Wintermark, P. Maeder, J. P. Thiran, P. Schnyder and
R. Meuli, “Quantitative
Flows by Perfusion CT Studies at Low In
Assessment of Regional Blood
jection Rates: A
Critical Review of the Underlying Theoretical Models,”
European Radiology, Vol. 11, No. 7, 2001, pp. 1220-
1230. doi:10.1007/s003300000707
[10] P. C. Sanelli, M. H. Lev, J. D. Eastwood, R. G. Gonzalez
and T. Y. Lee, “The Effect of Varying User-Selected In-
put Parameters on Quantitative Values in CT Perfusion
Maps,” Academic Radiology, Vol. 11, No. 10, 2004, pp.
1085-1092. doi:10.1016/j.acra.2004.07.002
[11] M. Wintermark, B. C. Lau, J. Chien and S. Arora, “The
Anterior Cerebral Artery Is an Appropriate Arterial Input
Function for Perfusion-CT Processing in Patients with
Acute Stroke,” Neuroradiology, Vol. 50, No. 3, 2008, pp.
227-236. doi:10.1007/s00234-007-0336-8
[12] B. D. Murphy, A. J. Fox, D. H. Lee, D. J. Sahlas, S. E.
Black, M. J. Hogan, et al., “Identification of Penumbra
Copyright © 2013 SciRes. ACT
P. C. SANELLI ET AL.
Copyright © 2013 SciRes. ACT
12
ing Computedand Infarct in Acute Ischemic Stroke Us
Tomography Perfusion-Derived Blood Flow and Blood
Volume Measurements,” Stroke, Vol. 37, No. 7, 2006, pp.
1771-1777. doi:10.1161/01.STR.0000227243.96808.53
[13] S. Binaghi, M. L. Colleoni, P. Maeder, A. Uske, L. Regli,
A. R. Dehdashti, et al., “CT Angiography and Perfusion
CT in Cerebral Vasospasm after Subarachnoid Hemor-
on CT Imaging: Comparisons
rhage,” AJNR American Journal Neuroradiology, Vol. 28,
No. 4, 2007, pp. 750-758.
[14] M. Wintermark, W. P. Dillon, W. S. Smith, B. C. Lau, S.
Chaudhary, S. Liu, et al., “Visual Grading System for Va-
sospasm Based on Perfusi
with Conventional Angiography and Quantitative Perfu-
sion CT,” Cerebrovascular Disease, Vol. 26, No. 2, 2008,
pp. 163-170. doi:10.1159/000139664
[15] J. W. Dankbaar, M. Rijsdijk, I. C. van der Schaaf, B. K.
Velthuis, M. J. Wermer and G. J. Rinkel, “Relationship
between Vasospasm, Cerebral Perfusion, and Delayed Ce-
rebral Ischemia after Aneurysmal Subarachnoid Hemor-
rhage,” Neuroradiology, Vol. 51, No. 12, 2009, pp. 813-
819. doi:10.1007/s00234-009-0575-y
[16] J. W. Dankbaar, N. K. de Rooij, M. Rijsdijk, B. K.
2
Velthuis, C. J. Frijns, G. J. Rinkel, et al., “Diagnostic
Threshold Values of Cerebral Perfusion Measured with
Computed Tomography for Delayed Cerebral Ischemia
after Aneurysmal Subarachnoid Hemorrhage,” Stroke,
Vol. 41, No. 9, 2010, pp. 1927-1932.
doi:10.1161/STROKEAHA.109.57439
. Turner, J. Ni-
bbreviations
ography perfusion
hemorrhage
ion hyperv ol emia
doppler ultrasound
MR: magnetic resonance
ACA: anterior cerebral artery
ry
nit
tic
val
[17] A. Turk, J. A. Magarik, I. Chaudry, R. D
cholas, C. A. Holmstedt, et al., “CT Perfusion-Guided Pa-
tient Selection for Endovascular Treatment of Acute Is-
chemic Stroke is Safe and Effective,” Journal of Neuro-
interventional Surgery, Vol. 4, No. 4, 2012, pp. 261-265.
[18] A. S. Turk, J. A. Magarik, D. Frei, K. M. Fargen, I. Chau-
dry, C. A. Hol mstedt, et al., “CT Perfusion-Guided Patient
Selection for Endovascular Recanalization in Acute Ische-
mic Stroke: A Multicenter Study,” Journal of Neuroin-
terventional Surgery, 2012, (Epub ahead of print) in
PubMed.
A
CTP: computed tom
SAH: subarachnoid
DCI: delayed cerebral ischemia
CBF: cerebral blood flow
CBV: cerebral blood volume
MTT: mean transit time
HHH: hypertension hemodilut
IA: intra-arterial
DSA: digital subtraction angiography
TCD: transcranial
CTA: computed tomography angiography
MCA: middle cerebral arte
PCA: posterior cerebral ar tery
N-ICU: ne ur o- i nt e nsi ve care u
ROI: region of interest
ROC: receiver operator characteris
AUC: area under curve
ANOVA: analysis of variance
SE: standard error
SD: standard deviation
CI: confidence inter