 J. Biomedical Science and Engineering, 2013, 6, 144-151 JBiSE http://dx.doi.org/10.4236/jbise.2013.62018 Published Online February 2013 (http://www.scirp.org/journal/jbise/) Heart and skeletal muscle insulin resistance but not myocardial blood flow reserve could be related to chronic use of thiazolidione in patients with type-2 diabetes* Ikuo Yokoyama1#, Toshiyuki Moritan2, Yusuke Inoue3 1Department of Cardiovascular Medicine, Clinical Research Center, Sanno Hospital and Sanno Medical Center, International Uni- versity of Health and Welfare, Tokyo, Japan 2Department of Clinical Engineering, Faculty of Medical Engineering, Suzuka University of Medical Science, Suzuka, Japan 3Department of Radiology, Graduate School of Medicine, Kitasato University, Sagamihara, Japan Email: #yokochan-tky@umin.ac.jp Received 3 November 2012; revised 2 December 2012; accepted 14 December 2012 ABSTRACT Heart and skeletal muscle insulin resistance and ab- normal myocardial flow reserve (MFR) occurs in pa- tients with type-II diabetes. Improvement of heart and skeletal muscle insulin resistance with rosiglita- zone use over 16 weeks have been reported. However, it is not clear whether chronic use of troglitazone can improve heart and skeletal muscle insulin resistance and MFR. Materials and Methods: To test the hypo- thesis whether effects of troglitazone on heart and skeletal muscle insulin resistance and MFR in pa- tients with type-II diabetes, rest and dipyridamole stress perfusion positron emission tomography (PET) with 13N-ammonia and heart and skeletal muscle 18FDG PET scans under insulin clamping were un-de r- taken before and 12 month after the initiation of tro- glitazone therapy (400 mg/day) in 23 patients with type-II diabetes. Twenty patients with type-II diabetes without CAD and without medications were served as controls. In controls, any medications were not added from the first PET study and 12 months after the second PET study. Results: Baseline myocardial bloo d flow (MBF) was comparable before and after the tro- glitazone group as was the controls. MBF during dipyridamole administration (0.56 mg/min/kg) was not significantly improved in troglitazone group and controls. MFR was not improved in tro glitazone gro u p and controls. In troglitazone group, whole body glu- cose disposal rate (GDR; µmole/min/kg) significantly improved (pre; 19.0 ± 9.55, post; 28.7 ± 15.3 , p < 0.05) as did the skeletal muscle glucose utilization rate (SMGU (µmole/min/kg); pre; 20.3 ± 12.0, post; 34.8 ± 10.6, p < 0.05) and the myocardial glucose utilization rate (MGU (µmole/min/kg); pre; 339.7 ± 105.2 vs. post; 410.0 ± 240.0, p < 0.05). GDR, SMGU and MGU were unchanged in controls. Conclusions: Troglita- zone can improve heart and skeletal muscle insulin resistance in patients with type-II diabetes but not MFR showing that co-existence of heart and skeletal mus cle insulin resistance is implicated in patients with type-II diabetes and impaired MFR is uncoupled with insulin resistance in the whole body and heart and skeletal muscle in patients with type-II diabetes. Keywords: Insulin Resistance; Myocardial Insu lin Resistance; Glucose; FDG; PET; Type-II Diabetes; Flow Reserve 1. INTRODUCTION Insulin resistance is defined as an impaired glucose utilization response to the stimulatory effect of insulin and has been recognized to have common essential role in a variety of metabolic diseases including type-II dia- betes mellitus [1]. Since insulin resistance is closely re- lated to metabolic syndrome and an occurrence of coro- nary artery disease (CAD) [2], investigation of the patho- physiology of and effects of certain drugs on insulin re- sistance is important for an early prevention of CAD. Positron emission tomography (PET) allows in vivo quantitative analysis of tissue glucose metabolism using [18F]2-fluoro-2-deoxy-D-glucose (18FDG) and myocar- dial blood flow (MBF) with 13N-ammonia or 15O-H2O. PET can be used to evaluate insulin resistance and myo- cardial perfusion abnormalities in subjects highly at risk for CAD. Reduced skeletal muscle glucose utilization (SMGU) under hyperinsulinemic euglycemic clamping, *This study finished on March 2000, be caus e tr oglita zone was forbidden to treat diabetes mellitus and was withd rawn from the market due to seri- ous side effects about liver function. Patients who were treated with troglitazone received no further treatment with troglitazone after March 2000. Therefore all data collection using troglitazone were finished before Marc h 1. #Corresponding author. OPEN ACCESS 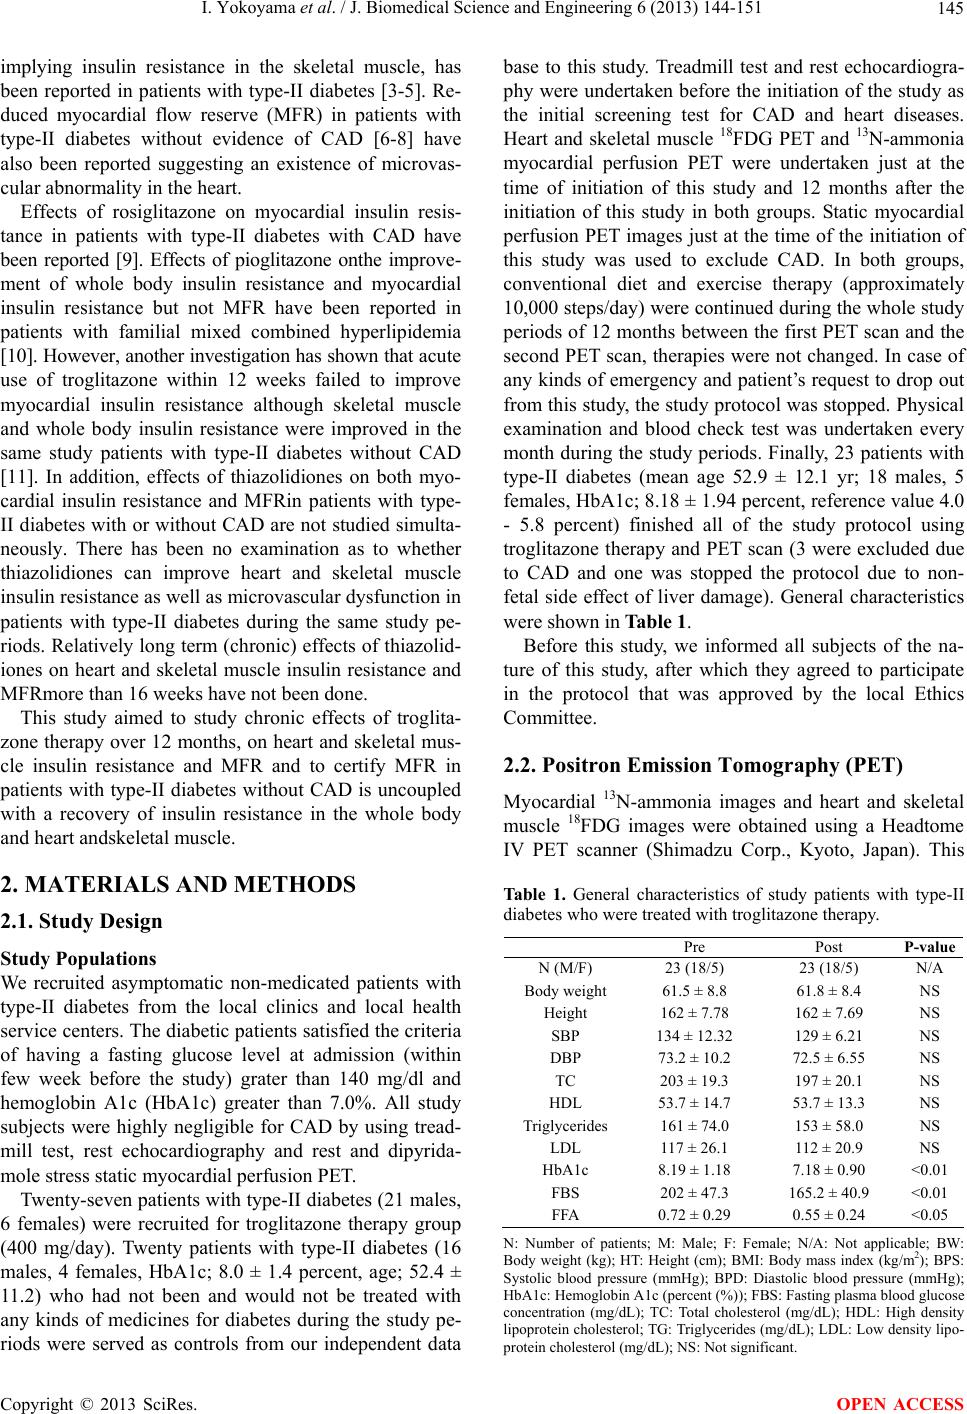 I. Yokoyama et al. / J. Biomedical Science and Engineering 6 (2013) 144-151 145 implying insulin resistance in the skeletal muscle, has been reported in patients with type-II diabetes [3-5]. Re- duced myocardial flow reserve (MFR) in patients with type-II diabetes without evidence of CAD [6-8] have also been reported suggesting an existence of microvas- cular abnormality in the heart. Effects of rosiglitazone on myocardial insulin resis- tance in patients with type-II diabetes with CAD have been reported [9]. Effects of pioglitazone onthe improve- ment of whole body insulin resistance and myocardial insulin resistance but not MFR have been reported in patients with familial mixed combined hyperlipidemia [10]. However, another investigation has shown that acu te use of troglitazone within 12 weeks failed to improve myocardial insulin resistance although skeletal muscle and whole body insulin resistance were improved in the same study patients with type-II diabetes without CAD [11]. In addition, effects of thiazolidiones on both myo- cardial insulin resistance and MFRin patients with type- II diabetes with or witho ut CAD are not studied simulta- neously. There has been no examination as to whether thiazolidiones can improve heart and skeletal muscle insulin resistance as well as microvascular dysfunction in patients with type-II diabetes during the same study pe- riods. Relatively long term (chronic) effects of thiazo lid- iones on heart and skeletal muscle insulin resistance and MFRmore than 16 weeks have not been done. This study aimed to study chronic effects of troglita- zone therapy over 12 months, on heart and skeletal mus- cle insulin resistance and MFR and to certify MFR in patients with type-II diabetes without CAD is uncoupled with a recovery of insulin resistance in the whole body and heart andskeletal muscle. 2. MATERIALS AND METHODS 2.1. Study Design Study Populations We recruited asymptomatic non-medicated patients with type-II diabetes from the local clinics and local health service centers. The diabetic patients satisfied the criteria of having a fasting glucose level at admission (within few week before the study) grater than 140 mg/dl and hemoglobin A1c (HbA1c) greater than 7.0%. All study subjects were highly negligible for CAD by using tread- mill test, rest echocardiography and rest and dipyrida- mole stress static myocardial perfusion PET. Twenty-seven patients with type-II diabetes (21 males, 6 females) were recruited for troglitazone therapy group (400 mg/day). Twenty patients with type-II diabetes (16 males, 4 females, HbA1c; 8.0 ± 1.4 percent, age; 52.4 ± 11.2) who had not been and would not be treated with any kinds of medicines for diabetes during the study pe- riods were served as controls from our independent data base to this study. Treadmill test and rest echocardiogra- phy were undertaken before the initiation of the study as the initial screening test for CAD and heart diseases. Heart and skeletal muscle 18FDG PET and 13N-ammonia myocardial perfusion PET were undertaken just at the time of initiation of this study and 12 months after the initiation of this study in both groups. Static myocardial perfusion PET images just at the time of the initiation of this study was used to exclude CAD. In both groups, conventional diet and exercise therapy (approximately 10,000 steps/day) wer e continued during the who le study periods of 12 months between the first PET scan and the second PET scan, therapies were not changed. In case of any kinds of emergency and patient’s request to drop out from this study, the study protocol was stopped. Physical examination and blood check test was undertaken every month during the study periods. Finally, 23 patients with type-II diabetes (mean age 52.9 ± 12.1 yr; 18 males, 5 females, HbA1c; 8.18 ± 1.94 percent, reference value 4.0 - 5.8 percent) finished all of the study protocol using troglitazone therapy and PET scan (3 were excluded due to CAD and one was stopped the protocol due to non- fetal side effect of liver damage). General characteristics were shown in Table 1. Before this study, we informed all subjects of the na- ture of this study, after which they agreed to participate in the protocol that was approved by the local Ethics Committee. 2.2. Positron Emission Tomography (PET) Myocardial 13N-ammonia images and heart and skeletal muscle 18FDG images were obtained using a Headtome IV PET scanner (Shimadzu Corp., Kyoto, Japan). This Table 1. General characteristics of study patients with type-II diabetes who were treated with troglitazone therapy. Pre Post P-value N (M/F) 23 (18/5) 23 (18/5) N/A Body weight 61.5 ± 8.8 61.8 ± 8.4 NS Height 162 ± 7.78 162 ± 7.69 NS SBP 134 ± 12.32 129 ± 6.21 NS DBP 73.2 ± 10.2 72.5 ± 6.55 NS TC 203 ± 19.3 197 ± 20 .1 NS HDL 53.7 ± 14.7 53.7 ± 13.3 NS Triglycerid es 161 ± 74.0 153 ± 5 8 .0 NS LDL 117 ± 26.1 112 ± 20.9 NS HbA1c 8.19 ± 1.18 7.18 ± 0.90 <0.01 FBS 202 ± 47.3 165.2 ± 40.9 <0.01 FFA 0.72 ± 0.29 0.55 ± 0.24 <0.05 N: Number of patients; M: Male; F: Female; N/A: Not applicable; BW: Body weight (kg); HT: Height (cm); BMI: Body mass index (kg/m2); BPS: Systolic blood pressure (mmHg); BPD: Diastolic blood pressure (mmHg); HbA1c: Hemoglobin A1c (percent (%)); FBS: Fasting plasma blood glucose concentration (mg/dL); TC: Total cholesterol (mg/dL); HDL: High density lipoprotein cholesterol; TG: Triglycerides (mg/dL); LDL: Low density lipo- protein cho l esterol (mg/dL); NS: Not s ignificant. Copyright © 2013 SciRes. OPEN ACCESS 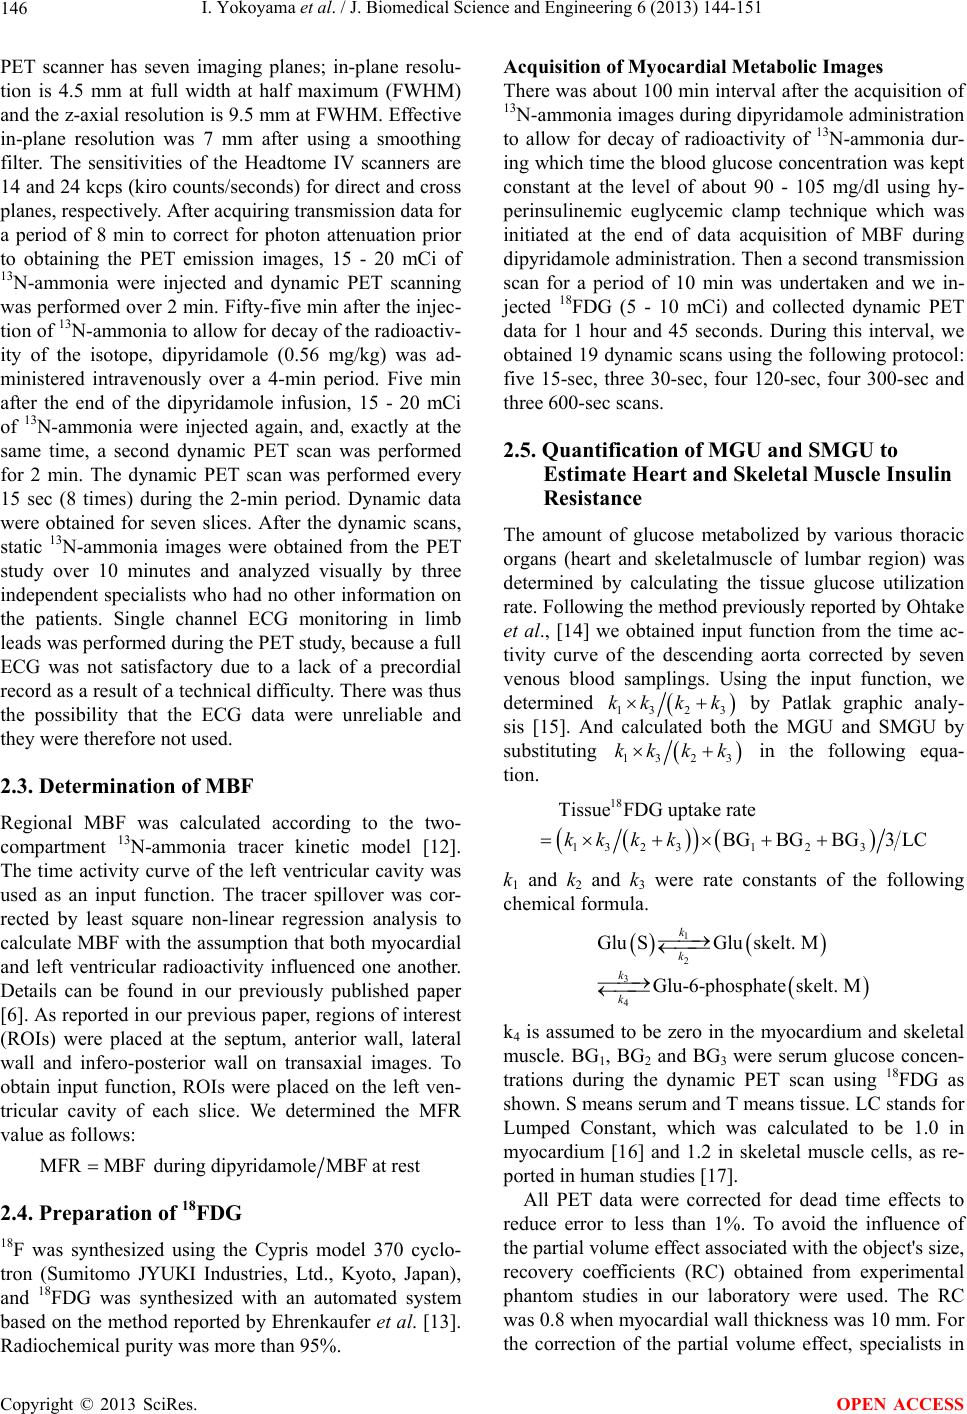 I. Yokoyama et al. / J. Biomedical Science and Engineering 6 (2013) 144-151 146 PET scanner has seven imaging planes; in-plane resolu- tion is 4.5 mm at full width at half maximum (FWHM) and the z-axial resolu tion is 9.5 mm at FWHM. Effective in-plane resolution was 7 mm after using a smoothing filter. The sensitivities of the Headtome IV scanners are 14 and 24 kcps (kiro counts/seco nds) for direct and cross planes, respectively. After acquiring transmission data for a period of 8 min to correct for photon attenuation prior to obtaining the PET emission images, 15 - 20 mCi of 13N-ammonia were injected and dynamic PET scanning was performed over 2 min. Fifty-five min after the injec- tion of 13N-ammonia to allow for decay of the radioactiv- ity of the isotope, dipyridamole (0.56 mg/kg) was ad- ministered intravenously over a 4-min period. Five min after the end of the dipyridamole infusion, 15 - 20 mCi of 13N-ammonia were injected again, and, exactly at the same time, a second dynamic PET scan was performed for 2 min. The dynamic PET scan was performed every 15 sec (8 times) during the 2-min period. Dynamic data were obtained for seven slices. After the dynamic scans, static 13N-ammonia images were obtained from the PET study over 10 minutes and analyzed visually by three independent specialists who had no other information on the patients. Single channel ECG monitoring in limb leads was performed during the PET study, because a full ECG was not satisfactory due to a lack of a precordial record as a result of a technical difficulty. There was thus the possibility that the ECG data were unreliable and they were therefore not used. 2.3. Determination of MBF Regional MBF was calculated according to the two- compartment 13N-ammonia tracer kinetic model [12]. The time activity curve of the left ventricular cavity was used as an input function. The tracer spillover was cor- rected by least square non-linear regression analysis to calculate MBF with the assumption that both myocardial and left ventricular radioactivity influenced one another. Details can be found in our previously published paper [6]. As reported in our previous paper, regions of interest (ROIs) were placed at the septum, anterior wall, lateral wall and infero-posterior wall on transaxial images. To obtain input function, ROIs were placed on the left ven- tricular cavity of each slice. We determined the MFR value as follows: MFRMBF during dipyridamoleMBFat rest 2.4. Preparation of 18FDG 18F was synthesized using the Cypris model 370 cyclo- tron (Sumitomo JYUKI Industries, Ltd., Kyoto, Japan), and 18FDG was synthesized with an automated system based on the method reported by Ehrenkaufer et al. [13]. Radiochemical purity was more than 95%. Acquisition of Myocardial Me tabolic Images There was about 100 min interval after the acquisition of 13N-ammonia images during dipyridamole administration to allow for decay of radioactivity of 13N-ammonia dur- ing which time the blood glucose concentration was kept constant at the level of about 90 - 105 mg/dl using hy- perinsulinemic euglycemic clamp technique which was initiated at the end of data acquisition of MBF during dipyridamole administration. Then a second transmission scan for a period of 10 min was undertaken and we in- jected 18FDG (5 - 10 mCi) and collected dynamic PET data for 1 hour and 45 seconds. During this interval, we obtained 19 dynamic scans using the following protocol: five 15-sec, three 30-sec, four 120-sec, four 300-sec and three 600-sec scans. 2.5. Quantification of MGU and SMGU to Estimate Heart and Skeletal Muscle Insulin Resistance The amount of glucose metabolized by various thoracic organs (heart and skeletalmuscle of lumbar region) was determined by calculating the tissue glucose utilization rate. Following the method previously reported by Ohta ke et al., [14] we obtained input function from the time ac- tivity curve of the descending aorta corrected by seven venous blood samplings. Using the input function, we determined 13 2 3 kk kk by Patlak graphic analy- sis [15]. And calculated both the MGU and SMGU by substituting 13 2 3 kk kk in the following equa- tion. 18 13 2 3123 TissueFDG uptake rate BGBGBG3 LCkk kk k1 and k2 and k3 were rate constants of the following chemical formula. 1 2 3 4 GluSGluskelt. M Glu- 6-phosphateskelt. M k k k k k4 is assumed to be zero in the myocardium and skeletal muscle. BG1, BG2 and BG3 were serum glucose concen- trations during the dynamic PET scan using 18FDG as shown. S means serum and T means tissue. LC stands for Lumped Constant, which was calculated to be 1.0 in myocardium [16] and 1.2 in skeletal muscle cells, as re- ported in human studies [17]. All PET data were corrected for dead time effects to reduce error to less than 1%. To avoid the influence of the partial volume effect associated with the object's size, recovery coefficients (RC) obtained from experimental phantom studies in our laboratory were used. The RC was 0.8 when myocardial wall thickness was 10 mm. For the correction of the partial volume effect, specialists in Copyright © 2013 SciRes. OPEN ACCESS 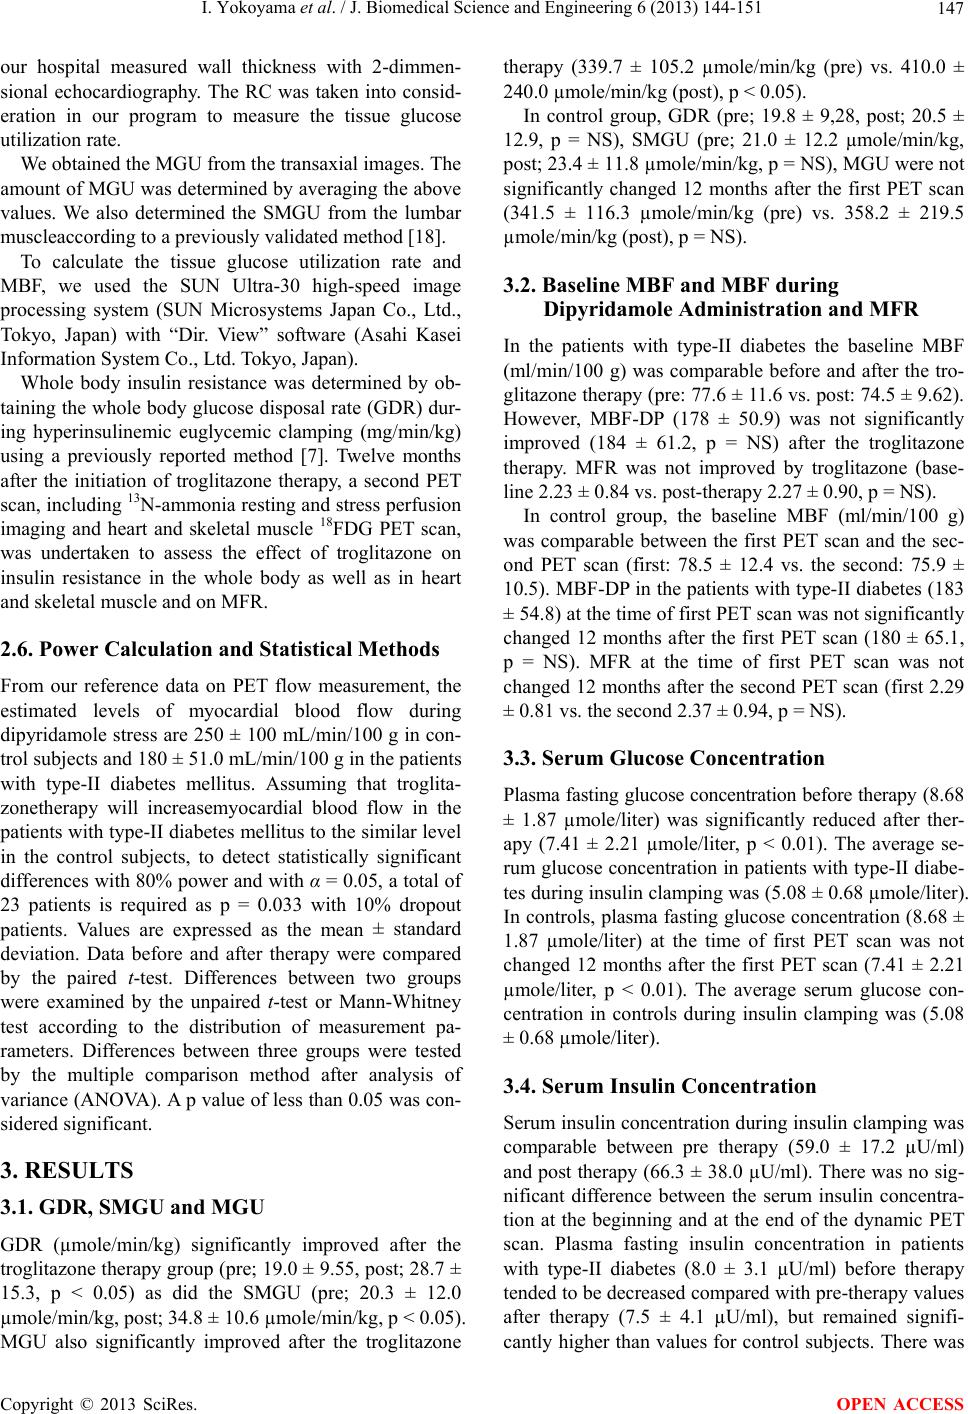 I. Yokoyama et al. / J. Biomedical Science and Engineering 6 (2013) 144-151 147 our hospital measured wall thickness with 2-dimmen- sional echocardiography. The RC was taken into consid- eration in our program to measure the tissue glucose utilization rate. We obtained the MGU from the transaxial images. The amount of MGU was determined by averaging the above values. We also determined the SMGU from the lumbar muscleaccording to a previously validated method [18]. To calculate the tissue glucose utilization rate and MBF, we used the SUN Ultra-30 high-speed image processing system (SUN Microsystems Japan Co., Ltd., Tokyo, Japan) with “Dir. View” software (Asahi Kasei Information System Co., Ltd. Tokyo, Japan). Whole body insulin resistance was determined by ob- taining the whole body glucose disposal rate (GDR) dur- ing hyperinsulinemic euglycemic clamping (mg/min/kg) using a previously reported method [7]. Twelve months after the initiation of troglitazone therapy, a second PET scan, including 13N-ammonia resting and stress perfusion imaging and heart and skeletal muscle 18FDG PET scan, was undertaken to assess the effect of troglitazone on insulin resistance in the whole body as well as in heart and skeletal muscle and on MFR. 2.6. Power Calculation and Statistical Methods From our reference data on PET flow measurement, the estimated levels of myocardial blood flow during dipyridamole stress are 250 ± 100 mL/min/100 g in con- trol subjects and 180 ± 51.0 mL/min/100 g in the patients with type-II diabetes mellitus. Assuming that troglita- zonetherapy will increasemyocardial blood flow in the patients with type-II diabetes mellitus to the similar leve l in the control subjects, to detect statistically significant differences with 80% power and with α = 0.05, a total of 23 patients is required as p = 0.033 with 10% dropout patients. Values are expressed as the mean ± standard deviation. Data before and after therapy were compared by the paired t-test. Differences between two groups were examined by the unpaired t-test or Mann-Whitney test according to the distribution of measurement pa- rameters. Differences between three groups were tested by the multiple comparison method after analysis of variance (ANOVA). A p value of less than 0.05 was con- sidered significant. 3. RESULTS 3.1. GDR, SMGU and MGU GDR (µmole/min/kg) significantly improved after the troglitazone ther apy group (pr e; 19.0 ± 9.55, post; 28.7 ± 15.3, p < 0.05) as did the SMGU (pre; 20.3 ± 12.0 µmole/min/kg, post; 34.8 ± 10.6 µmole/min/kg, p < 0.05). MGU also significantly improved after the troglitazone therapy (339.7 ± 105.2 µmole/min/kg (pre) vs. 410.0 ± 240.0 µmole/min/kg (post), p < 0.05). In control group, GDR (pre; 19.8 ± 9,28, post; 20.5 ± 12.9, p = NS), SMGU (pre; 21.0 ± 12.2 µmole/min/kg, post; 23.4 ± 11.8 µmole/min/kg, p = NS), MGU were not significantly changed 12 months after the first PET scan (341.5 ± 116.3 µmole/min/kg (pre) vs. 358.2 ± 219.5 µmole/min/kg (p ost), p = NS). 3.2. Baseline MBF and MBF during Dipyridamole Administration and MFR In the patients with type-II diabetes the baseline MBF (ml/min/100 g) was comparable before and after the tro- glitazone ther apy (pre: 77.6 ± 11.6 vs. post: 74.5 ± 9.62). However, MBF-DP (178 ± 50.9) was not significantly improved (184 ± 61.2, p = NS) after the troglitazone therapy. MFR was not improved by troglitazone (base- line 2.23 ± 0.84 vs. p ost-therapy 2.27 ± 0. 9 0, p = NS). In control group, the baseline MBF (ml/min/100 g) was comparable between the first PET scan and the sec- ond PET scan (first: 78.5 ± 12.4 vs. the second: 75.9 ± 10.5). MBF-DP in the patients with type-II diabetes (183 ± 54.8) at the time of first PET scan was not significantly changed 12 months after the first PET scan (180 ± 65.1, p = NS). MFR at the time of first PET scan was not changed 12 months after the second PET scan (first 2.29 ± 0.81 vs. the secon d 2.37 ± 0.94, p = NS). 3.3. Serum Glucose Concentration Plasma fasting glucose concentration before therapy (8 .68 ± 1.87 µmole/liter) was significantly reduced after ther- apy (7.41 ± 2.21 µmole/liter, p < 0.01). The average se- rum glucose concentration in patients with type-II diabe- tes during insulin clamping was (5.0 8 ± 0.68 µmole/liter). In controls, plasma fasting glucose concentration (8.68 ± 1.87 µmole/liter) at the time of first PET scan was not changed 12 months after the first PET scan (7.41 ± 2.21 µmole/liter, p < 0.01). The average serum glucose con- centration in controls during insulin clamping was (5.08 ± 0.68 µmole/lite r ). 3.4. Serum Insulin Concentration Serum insulin co ncentration d uring in sulin clamping was comparable between pre therapy (59.0 ± 17.2 µU/ml) and post therap y (66.3 ± 38.0 µU/ml). There was no sig- nificant difference between the serum insulin concentra- tion at the beginning and at the end of the dynamic PET scan. Plasma fasting insulin concentration in patients with type-II diabetes (8.0 ± 3.1 µU/ml) before therapy tended to be decreased compared with pre-therapy values after therapy (7.5 ± 4.1 µU/ml), but remained signifi- cantly higher than values for control subjects. There was Copyright © 2013 SciRes. OPEN ACCESS  I. Yokoyama et al. / J. Biomedical Science and Engineering 6 (2013) 144-151 148 no significant relationship between MGU and plasma insulin concentration in th e patients with type-II diabetes, as well as between SMGU and plasma insulin concentra- tion. 3.5. Serum Free Fatty Acid Concentration (FFA) In the patients with type-II diabetes with troglitazone therapy, serum FFA concentration during insulin clamp- ing (0.72 ± 0.29 mEq/liter) was significantly reduced after therapy (0.55 ± 0.24 mEq/liter, p < 0.05). In control group, serum FFA concentration during in- sulin clamping was not changed after the therapy (pre; 0.78 ± 0.29 mEq/liter post; 0.75 ± 0.35 mEq/liter, p = NS). 4. DISCUSSION 4.1. General Discussion of Whole Results This study investigated effects of chronic use of troglita- zone on heart and skeletal muscle and whole body insu- lin resistance and myocardial perfusion in patients with type-II diabetes without CAD during the same study pe- riods for the first time. Data were compared with those who were non-medicated type-II diabetes without CAD. SMGU and GDR were significantly improved 12 months after the troglitazone therapy in patients with type-II diabetes without CAD. These resultsare consistent with those in vitro findings [19] and our previous study of relatively short-term therapy over 3 months in vivo [20]. On the other hand, in control group,SMGU and GDR were not changed 12 months after the first PET scan. These results showed that chronic troglitazone therapy could also preserve effect to improve the insulin resis- tance in the skeletal muscle and whole body in patients with type-II diabetes without CAD. In addition, MGU was also improved significantly i n t he troglit azone therapy group but such improvement was not seen in control group. These results highly suggest that chronic use of troglitazone can improve insulin resistance in both the heart and skeletal muscle and whole body in patients with type-II diabetes without CAD. Similar investigation has been done in patients with type-II diabetes with CAD using rosiglitazone [9]. In the report, effects of rosiglita- zone on the heart and skeletal muscle insulin resistance have been investigated over 16 weeks (relatively short term periods of therapy comparing with our present study) in patients with type-II diabetes with CAD [9]. Naoumova et al. reported that pioglitazone improved heart and whole body insulin resistance but not MFR in patients with familial combined hyperlipidemia but not type-II diabetes [10]. Whereas Yokoyama et al. reported that troglitazone therapy within 12 weeks improved ske- letal muscle and whole body insulin resistance nut bot in myocardial insulin resistance [11]. Therefore, it takes long time to improve myocardial insulin resistance with troglitazone in type-II diabetes. 4.2. Influence of a Co-Existence of CAD on Myocardial Insulin Resistance in Type-II Diabetes No significant difference in MGU has been observed between normal remote myocardial segments in patients with CAD and type-II diabetes and normal remote myo- cardial segments in patients with CAD without type-II diabetes [21]. So it should be needed to negate the influ- ence of a co-existence of CAD on the thiazolidione’s response to myocardial insulin resistance. Whereas, it has not been clear whether myocardial insulin resistance could be altered by aco-existence of CAD in patients with type-II diabetes. Therefore, effects of thiazolidione s on heart and skeletal muscle insulin resistance in patien ts with type II-diabetes without CAD has been remain un- certain. In add ition, effects of any kinds of thiazo lidiones over relatively long-term therapy periods (12 months) on heart and skeletal muscle and whole body insulin resis- tance in patients with type-II diabetes without CAD have not been studied. As results of this study, relatively long term therapy of troglitazone can improve both whole body insulin resistance and myocardial insulin resistance significantly in patients with type-II diabetes without CAD. Since troglitazone is one of thiazolidionenes which act as an insulin sensitizer, our results strongly support that both heart and skeletal muscle and whole body insu- lin resistance coexists in patients with type-II diabetes without CAD. Furthermore, our results support such re- ports that showed an existence of myocardial insulin resistance in patients with type-II diabetes who also had skeletal muscle and whole body insulin resistance [3-5]. The plasma FFA concentration was reported to be re- lated to insulin resistance in patients with type-II diabe- tes [22,23]. Enhancement of insulin stimulated suppres- sive effect to decrease FFA via PPAR-gamma agonists has been reported [24]. In our current study, the plasma FFA concentration during insulin clamping was signifi- cantly decreased 12 months after the troglitazone therapy and both heart and skeletal muscle glucose utilization and GDR weresignificantly increased in the troglitazone therapy group however no changes were seen in the con- trol group. These results indicate that the FFA con centra- tion is a factor in the improvement of insulin resistance in both the whole body and the heart and skeletal muscle after the administration of troglitazone. An existence of glucose-FFA cycle (so-called Randle’s cycle) has been reported in human heart and skeletal muscle [25]. Our current results suggest that troglitazone improves insulin resistance in the heart and skeletal muscle and the whole Copyright © 2013 SciRes. OPEN ACCESS  I. Yokoyama et al. / J. Biomedical Science and Engineering 6 (2013) 144-151 149 body inpatients with type-IIdiabetes withou t CAD via an enhancement of the Randle’s cycle. Another possible mechanisms to increase SMGU, MGU and GDR by troglitazone use over 12 months could be thought as follo ws. An activation of the pero xisome pro- liferator-activated receptor (PPAR-γ) in adipocytes [26], an increase in the number of small adipocytes and inac- tivation of tumor necrotizing factor-a (TNF-α) via the activation of PPAR-γ in adipocytes [26] can be factors. Up-regulation of gene expression of PPAR-γ in skeletal muscle cells by troglitazone may be another mechanism for the improvement of SMGU in patients with type-II diabetes. However, since adipocytes scarcely exist in the heart, this discussion would not be applied to mecha- nisms of improvement in MGU with troglitazone. Fur- therinvestigation shou ld be required to improv e heart and skeletal muscle insulin resistance in patien ts with type-II diabetes without CAD after troglitazone therapy. 4.3. Troglitazone Did Not Improve MFR in Patients with Type-II Diabetes without CAD In this study, MFR was not improved in troglitazone therapy group, contrasting to the results of an improve- ment of insulin resistance in the whole body and heart and skeletal muscle. In addition, MFR, MGU, SMGU and GDR were not improved in the control group. Those findings led to the expectation that the recovery of MFR would not be related to the improvement of insulin resis- tance not only in the whole body but also in heart and skeletal muscle after troglitazone in patients with type-II diabetes.On the other hand, glycemic control has been implicated to be related to the reduced MFR in patients with type II diabetes [6-8], but not to the whole body insulin resistance [7,8]. Therefore, our current results that troglitazone did not improve MFR in patients with type-II diabetes but improved only insulin resistance in the whole body highly support above studies. Moreover, our present results have shown that the improvement of heart or skeletal muscle insulin resistance does not lead to recovery of MFR in patients with type-II diabetes. In general, a reduced MFR is thought to be principally due to a structural alteration in the microvascular bed surface area due to micro embolism and/or atherosclerosis or both. Contrary to anti-hyperlipidemic therapies which have been reported to improve MFR in patients with hy- perlipidemia without CAD [27-29] and those with CAD, [30,31] anti-diabetic therap ies do not cure hyperglycemia and/or insulin resistance completely and the deleterious effects of diabetes on vessels might progress gradually day by day. These factors can be a reason in our result as to the no effect of troglitazone therapy on the r ecovery of MFR in type-II diabetes. In patients with CAD and hy- per-LDL cholesterolemia,delayed response of improve- ment of MFRin response to lipid-lowering therapy with fluvastatinhas been reported [31]. It has also been re- ported that reduced MFR in patients with hypercholes- terolemiaand CAD was improved by simvastatin but not by pravastatin [29]. Therefore, kinds of drugs and dura- tion of therapy can also be factors for the improvement of MFR. Our current results support the knowledge that abnormal coronary microvascular function is mainly related to glycemic control in patients with type-II dia- betes but not to insulin resistance [7,8]. These results suggested that much stronger and stable effects on hy- perglycemia and much longer therapeutic periods should be required to improve MFR in patients with type-II dia- betes rather than modest improvements in glycemic con- trol and insulin resistance. It has been reported that ab- normal microvascular function in patients with type-II diabetes should be un-resolved important question to answer [32]. Much stronger evidence should be required how to treat abnormal microvascular dysfunction in pa- tients with type-II diabetes. 4.4. Quantitative Analysis of Heart and Skeletal Muscle Glucose Utilization Using PET and 18FDG The significant improvement of both SMGU and GDR indicates the validity of the PET quantitative method to measure SMGU. However, previous animal experimental studies suggested that the myocardial Lumped Constant, which strands for the difference between glucose and 18FDG, is not constant [33,34]. Hariharan et al. only showed that the bolus injection of insulin (but not insulin clamping) did not increase myocardial 18FDG uptake, whereas myocardial glucose uptake was increased spon- taneously when a resected beating mouse heart was per- fused by Krebs Henselite buffer [33]. However, clinical myocardial 18FDG PET studies have shown that insulin clamping effectively increased myocardial 18FDG uptake in both normal contro ls and patients with type II diab etes [3-5]. The method used in the animal studies [33,34] cannot be applied to human studies. Furthermore, Ng et al. have revealed that 18FDG uptake quite linearly corre- lated with myocardial glucose uptake [34]. Therefore, these animal experimental findings can only suggest that MGU cannot be measured by PET and 18FDG after bolus injection of insulin but they did not determine if MGU can be measured byPET and 18FDG under hyperinsu- linemic euglycemic clamping. In this study, we determined SMGU from the lumber muscle, because with this approach both MGU and SMGU can be measured just at the same timewith nearly the same accuracy as that of thigh muscle [18]. In the manuscript of this method, a significant positive rela- tionship between thigh muscle SMGU and lumbar mus- Copyright © 2013 SciRes. OPEN ACCESS  I. Yokoyama et al. / J. Biomedical Science and Engineering 6 (2013) 144-151 150 cle SMGU and no significant difference in SMGU value between thigh muscle and lumbar muscle have been shown [18]. Therefore, determination of SMGU from the lumbar muscle can be considered to be reliable. Orienta- tion of lumber muscle can be determined with static 18FDG images after the dynamic study by changing the color scale appropriately, so there is no problem as to the placement of ROI. Even when orientation of lumbar muscle is difficult to determine only by PET, X-ray CT is very helpful to the ROI placement. Several reports cite measurement of SMGU from the femoral muscle. [4,5, 11,25,35] However, this approach requires additional data acquisition time over 22 - 30 min after the PET scan of thoracic region, including frequent arterial or arterial- ized or venous blood samplings to obtain input function and dynamic data of femoral muscle 18FD G u pt ake. 4.5. Study Limitation Since this study is open trial and not a placebo-control double blind study, grade of evidences obtained from this study would be under estimated. Because of serious liver damage of troglitazone, we did not make such strict trial and disappeared from the market. These are the l imit atio n of this study. 5. CONCLUSION Chronic troglitazone use can improve heart and skeletal muscle insulin resistance similarly but not MFR in pa- tients with type-II diabetes. These results lead an idea that myocardial insulin resistance co-exists with skeletal muscle and whole body insulin resistance in patients with type-II diabetes without CAD. No change of MFR after troglitazone therapy indicated that MFR was un- coupled with the recovery of insulin resistance in the whole body and heart and skeletal muscle in patients with type-II diabetes without CAD. REFERENCES [1] DeFronzo, R.A., Gunnarsson, R. Bjorkman, O., et al. (1985) Effect of insulin on peripheral and splanchnic glucose metabolism in non-insulin dependent (type II) diabetes mellitus. The Journal of Clinical Investigation, 76, 149-155. doi:10.1172/JCI111938 [2] DeFronzo, R.A. (1992) Insulin resistance, hyperinsuline- mia, and coronary artery disease: A complex metabolic web. Journal of Cardiovascular Pharmacology, 20, S1- S16. doi:10.1097/00005344-199200111-00002 [3] Voipio-Pulkki, L.M., Nuutila, P., Knuuti, J.M., et al. (1993) Heart and skeletal muscle glucose disposal in type 2 dia- betic patients as determined by positron emission tomo- graphy. Journal of Nuclear Medicine, 34, 2064-2067. [4] Yokoyama, I., Ohtake, T., Momomura, S., et al. (1998) Organ specific insulin resistance in patients with non-in- sulin dependent diabetes mellitus and hypertension. Jour- nal of Nuclear Medicine, 39, 884-889. [5] Yokoyama, I., Yonekura, K., Ohtake, T., et al. (2000) Effect of insulin resistance on heart and skeletal muscle FDG uptake in type II diabetics. Journal of Nuclear Car- diology, 7, 242-248. doi:10.1016/S1071-3581(00)70013-4 [6] Yokoyama, I., Ohtake, T., Momomura, S., et al. (1997) Reduced myocardial flow reserve in patients with non- insulin dependent diabetes mellitus. Journal of the Ameri- can College of Cardiology, 30, 1472-1477. doi:10.1016/S0735-1097(97)00327-6 [7] Yokoyama, I., Ohtake, T., Momomura, S., et al. (1998) Hyperglycemia rather than insulin resistance is related to coronary flow reserve in patients with non-insulin depen- dent diabetes mellitus. Diabetes, 47, 119-124. doi:10.2337/diabetes.47.1.119 [8] Yokoyama, I., Yonekura, K., Ohtake, T., et al. (2000) Myocardial flow reserve in angiographically normal co- ronary arteries in non-insulin-dependent diabetics was re- lated to glycemic control and was more prominently re- duced in those with microvascular angina than in those with coronary artery disease. Journal of Nuclear Cardi- ology, 41, 978-985. [9] Lautamaki, R., Airaksinen, K.E., Seppanen, M., et al. (2005) Rosiglitazone improves myocardial glucose up- take in patients with type 2 diabetes and coronary artery disease: A 16-week randomized, double-blind, placebo- controlled study. Diabetes, 54, 2787-2794. doi:10.2337/diabetes.54.9.2787 [10] Naoumova, R.P., Kindler, H., Leccisotti, L., et al. (2007) Pioglitazone improves myocardial blood flow and glu- cose utilization in nondiabetic patients with combined hyperlipidemia. A randomized, double-blind, placebo- controlled study. Journal of the American College of Car- diology, 50, 2051-2058. doi:10.1016/j.jacc.2007.07.070 [11] Yokoyama, I., Moritan, T. and Inoue, Y. (2012) Heart and skeletal muscle insulin resistance during troglitazone the- rapy in type-2 diabetes. Journal of Biomedical Science and Engineering, 512A, 829-835. doi:10.4236/jbise.2012.512A105 [12] Krivokapitch, J., Smith, G.T., Huang, S.C., et al. (1989) 13N-ammonia myocardial imaging at rest and with exer- cise in normal volunteers. Circulation, 80, 1328-1337. doi:10.1161/01.CIR.80.5.1328 [13] Ehrenkaufer, R.E., Potocki, J.F. and Jewett, D.M. (1989) Simple synthesis of F-18 labeled 2-fluoro-2-deoxy-D-glu- cose. Journal of Nuclear Medicine , 25, 333-337. [14] Ohtake, T., Kosaka , N., Watanabe, T., et al. (1991) Non- invasive method to obtain input function for measuring tissue glucose utilization of thoracic and abdominal or- gans. Journal of Nuclear Medic i ne, 32, 1432-1438. [15] Patlak, C.S., Bla sberg, R. G. and Fenster macher, J. D. (19 83) Graphical evaluation of blood-to-brain transfer constants from multiple-time uptake data. Journal of Cerebral Blood Flow & Metabolism, 3, 1-7. doi:10.1038/jcbfm.1983.1 [16] Ng, C.K., Soufer, R. and McNulty, P.H. (1998) Effect of hyperinsulinemia on myocardial fluorine-18-FDG uptake. Copyright © 2013 SciRes. OPEN ACCESS  I. Yokoyama et al. / J. Biomedical Science and Engineering 6 (2013) 144-151 Copyright © 2013 SciRes. 151 OPEN ACCESS Journal of Nuclear Medicine, 39, 379-383. [17] Utriainen, T., Lovisatti, S., Mäkimattila, S., et al. (2000) Direct measurement of the lumped constant for 2-deoxy- [1-14C]glucose in vivo in human skeletal muscle. Ameri- can Journal of Physiolofy: Endocrinology and Metabo- lism, 279, E228-E233. [18] Yokoyama, I., Moritan, T. and Inoue, Y. (2013) Meas- urement of lumbar muscle glucose utilization rate can be as useful in estimating skeletal muscle Insulin resistance as that of thigh muscle. Journal of Biomedical Sciences and Engineering, 6, 201-208. (in press) doi:10.4236/jbise.2013.62024 [19] Park, K.S., Claraldi, T.P., Abramas-Carter, L., et al. (1998) Troglitazone regulation of glucose metabolism in human skeletal muscle cultures from obese type II diabetic sub- jects. The Journal of Clinical Endocrinology & Metabo- lism, 83, 1636-1643. doi:10.1210/jc.83.5.1636 [20] Yokoyama, I., Yonekura, K., Moritan, T., et al. (2001) Troglitazone improves whole-body insulin resistance and skeletal muscle glucose use in type II diabetic patients. Journal of Nuclear Medicine, 42, 1005-1010. [21] Jagnasia, D., Whiting, J.M., Concato, J., Pfau, S. and McNulty, P.M. (2001) Effects of non-insulin dependent diabetes mellitus on myocardial insulin responsiveness in patients with ischemic heart isease. Circulation, 103, 1734- 1739. doi:10.1161/01.CIR.103.13.1734 [22] Kim, J.K., Wi, J.K. and Youn, J.H. (1996) Plasma free fatty acids decrease insulin-stimulated skeletal muscle glucose uptake by suppressing glycolysis in conscious rats. Diabetes, 45, 446-453. doi:10.2337/diabetes.45.4.446 [23] Boden, G., Chen, X., Ruiz, J., et al. (1994) Mechanisms of fatty acid-induced inhibition of glucose uptake. Jour- nal of Clinical Investigation, 93, 2438-2446. doi:10.1172/JCI117252 [24] Racete, S.B., Davis, A.O., McGill , J.B. and Klein, S. (2002) Thiazolidiones enhance insulin-mediated suppression of fatty acid flux in type 2 diabetes mellitus. Metabolism, 51, 169-174. doi:10.1053/meta.2002.29981 [25] Nuutila, P., Koivisto, V.A., Knuuti, J., et al. (1992) The glucose free fatty acid cycle operates in human heart and skeletal muscle in vivo. Journal of Clinical Investigation, 89, 1767-1744. doi:10.1172/JCI115780 [26] Okuno, A., Tamemoto, H., Tobe, K., et al. (1998) Tro- glitazone increases the number of small adipocytes with- out the change of white adipose tissue mass in obese Zucker rats. Journal of Clinical Investigation, 101, 1354- 1361. doi:10.1172/JCI1235 [27] Yokoyama, I., Momomura, S., Ohtake, T., et al. (1999) Improvement of myocardial vasodilatation in hypelipi- demics due to diffuse coronary arterosclerosis after lipid lowering therapy. Circulation, 100, 117-122. doi:10.1161/01.CIR.100.2.117 [28] Yokoyama, I., Yonekura, K., Inoue, Y., Ohtomo, K. and Nagai, R. (2001) Long-term effect of simvastatin on the improvement of impaired myocardial flow reserve in pa- tients with familial hypercholesterolemia without gender variance. Journal of Nuclear Cardiology, 8, 445-451. doi:10.1067/mnc.2001.115517 [29] Yokoyama, I., Inoue, Y., Moritan, T., Ohtomo, K. and Nagai, R. (2004) Impaired myocardial vasodilatation dur- ing hyperaemic stress is improved by simvastatin but not by pravastatin in patients with hypercholesterolaemia. European Heart Journal, 25, 671-679. doi:10.1016/j.ehj.2004.02.017 [30] Guethlin, M., Kasel, A.M., Coppenrath, K., Ziegler, S., Delius, W. and Schwaiger, M. (1999) Delayed response of myocardial flow reserve to lipid-lowering therapy with fluvastatin. Circulation, 99, 475-481. doi:10.1161/01.CIR.99.4.475 [31] Baller, D., Notoha miprodjo, G., Gleichmann, U., Ho l z i n ge r , J., Weise, R. and Lehmann, J. (1999) Improvement in coronary flow reserve determined by positron emission tomography after 6 months of cholesterol-lowering ther- apy in patients with early stages of coronary atheroscle- rosis. Circulation, 99, 2871-2875. doi:10.1161/01.CIR.99.22.2871 [32] Camici, P.G. and Crea, F. (2007) Coronary microvascular dysfunction. New England Journal of Medicine, 356, 830- 840. doi:10.1056/NEJMra061889 [33] Hariharan, R., Bray, M., Ganim, R., Doenst, T., Goodwin, G.W. and Taegtmeyer, H. (1995) Foundamental limita- tion of 18F2-deoxy -2-fluoro-D-glucose for assessing my o- cardial glucose uptake. Circulation, 91, 2435-2444. doi:10.1161/01.CIR.91.9.2435 [34] Ng, C.K., Holden, J.E., Degrado, T.R., et al. (1991) Sen- sitivity of myocardial fluorodeoxyglucose lumped con- stant to glucose and in sulin. The American Journal of Phy- siology, 260, H593-H603. [35] Yokoyama, I., Ohtake, T., Momomuram, S., et al. (1999) Insulin action on Heart and skeletal muscle FDG uptake in patients with hypertriglyceridemia. Journal of Nuclear Medicine, 40, 1116-1121.
|