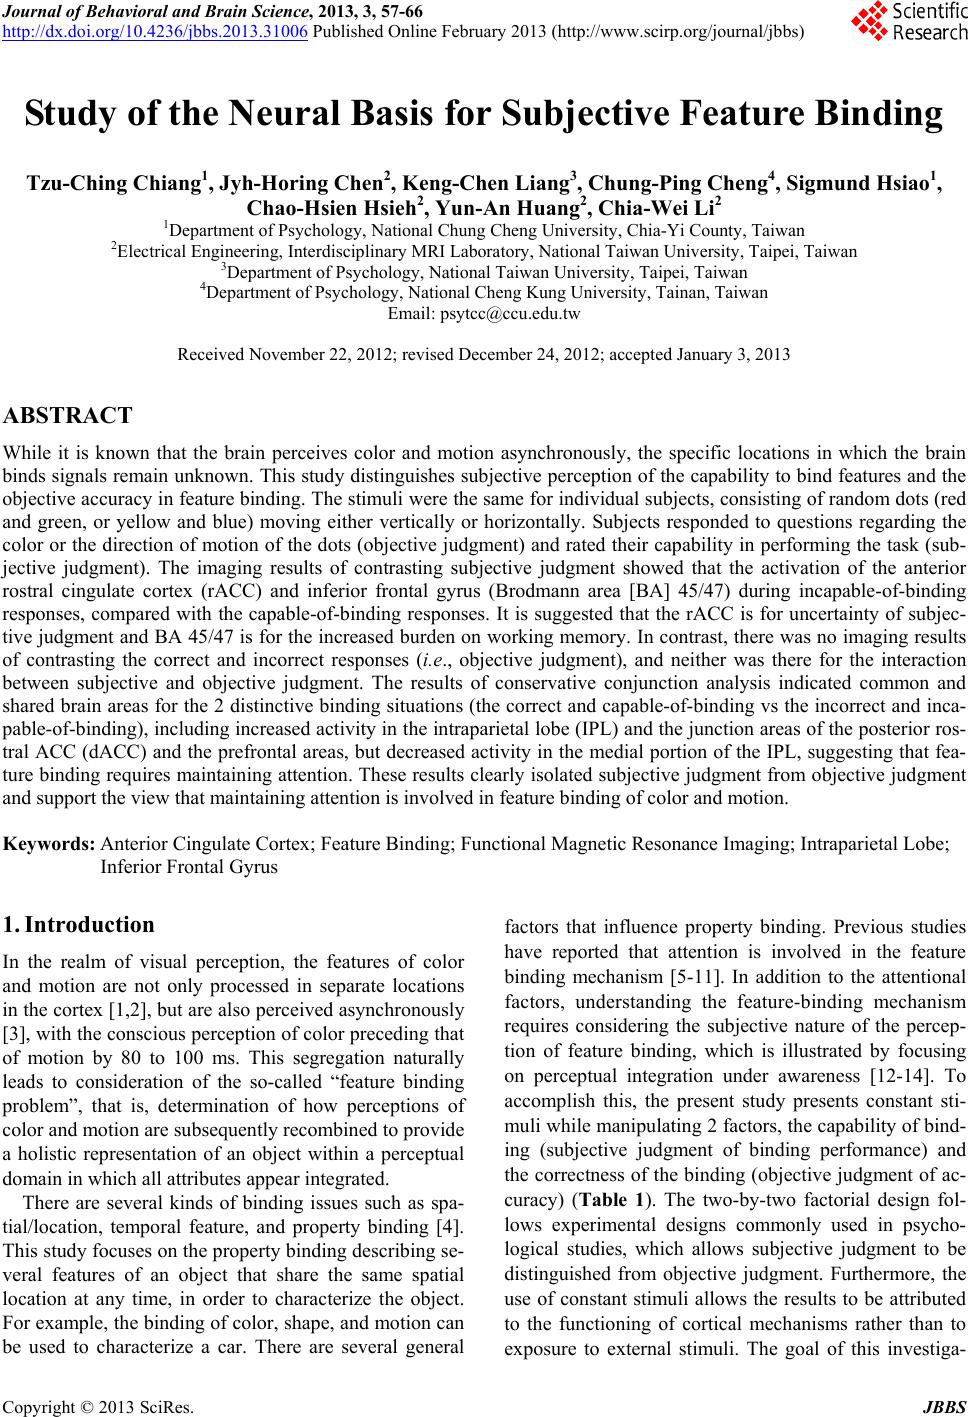
 Journal of Behavioral and Brain Science, 2013, 3, 57-66 http://dx.doi.org/10.4236/jbbs.2013.31006 Published Online February 2013 (http://www.scirp.org/journal/jbbs) Study of the Neural Basis for Subjective Feature Binding Tzu-Ching Chiang1, Jyh-Horing Chen2, Keng-Chen Liang3, Chung-Ping Cheng4, Sigmund Hsiao1, Chao-Hsien Hsieh2, Yun-An Huang2, Chia-Wei Li2 1Department of Psychology, National Chung Cheng University, Chia-Yi County, Taiwan 2Electrical Engineering, Interdisciplinary MRI Laboratory, National Taiwan University, Taipei, Taiwan 3Department of Psychology, National Taiwan University, Taipei, Taiwan 4Department of Psychology, National Cheng Kung University, Tainan, Taiwan Email: psytcc@ccu.edu.tw Received November 22, 2012; revised December 24, 2012; accepted January 3, 2013 ABSTRACT While it is known that the brain perceives color and motion asynchronously, the specific locations in which the brain binds signals remain unknown. This study distinguishes subjective perception of the capability to bind features and the objective accuracy in feature binding. The stimuli were the same for individual subjects, consisting of random dots (red and green, or yellow and blue) moving either vertically or horizontally. Subjects responded to questions regarding the color or the direction of motion of the dots (objective judgment) and rated their capability in performing the task (sub- jective judgment). The imaging results of contrasting subjective judgment showed that the activation of the anterior rostral cingulate cortex (rACC) and inferior frontal gyrus (Brodmann area [BA] 45/47) during incapable-of-binding responses, compared with the capable-of-binding responses. It is suggested that the rACC is for uncertainty of subjec- tive judgment and BA 45/47 is for the increased burden on working memory. In contrast, there was no imaging results of contrasting the correct and incorrect responses (i.e., objective judgment), and neither was there for the interaction between subjective and objective judgment. The results of conservative conjunction analysis indicated common and shared brain areas for the 2 distinctive binding situations (the correct and capable-of-binding vs the incorrect and inca- pable-of-binding), including increased activity in the intraparietal lobe (IPL) and the junction areas of the posterior ros- tral ACC (dACC) and the prefrontal areas, but decreased activity in the medial portion of the IPL, suggesting that fea- ture binding requires maintaining attention. These results clearly isolated subjective judgment from objective judgment and support the view that maintaining attention is involved in feature binding of color and motion. Keywords: Anterior Cingulate Cortex; Feature Binding; Functional Magnetic Resonance Imaging; Intraparietal Lobe; Inferior Frontal Gyrus 1. Introduction In the realm of visual perception, the features of color and motion are not only processed in separate locations in the cortex [1,2], but are also perceived asynchronously [3], with the conscious perception of color preceding that of motion by 80 to 100 ms. This segregation naturally leads to consideration of the so-called “feature binding problem”, that is, determination of how perceptions of color and motion are subsequently recombined to provide a holistic representation of an object within a perceptual domain in which all attributes appear integrated. There are several kinds of binding issues such as spa- tial/location, temporal feature, and property binding [4]. This study focuses on the property binding describing se- veral features of an object that share the same spatial location at any time, in order to characterize the object. For example, the binding of color, shape, and motion can be used to characterize a car. There are several general factors that influence property binding. Previous studies have reported that attention is involved in the feature binding mechanism [5-11]. In addition to the attentional factors, understanding the feature-binding mechanism requires considering the subjective nature of the percep- tion of feature binding, which is illustrated by focusing on perceptual integration under awareness [12-14]. To accomplish this, the present study presents constant sti- muli while manipulating 2 factors, the capability of bind- ing (subjective judgment of binding performance) and the correctness of the binding (objective judgment of ac- curacy) (Table 1). The two-by-two factorial design fol- lows experimental designs commonly used in psycho- logical studies, which allows subjective judgment to be distinguished from objective judgment. Furthermore, the use of constant stimuli allows the results to be attributed to the functioning of cortical mechanisms rather than to exposure to external stimuli. The goal of this investiga- C opyright © 2013 SciRes. JBBS  T.-C. CHIANG ET AL. 58 tion is to provide greater elucidation and understanding of the differences between subjective and objective judg- ment within the feature binding mechanism. 2. Methods 2.1. Experimental Setup and Stimuli While wearing functional magnetic resonance imaging (fMRI)-compatible goggles (14.25˚ × 10.71˚ in width and height, VisuaStim XGA; Resonance Technology Inc., Northridge, California, USA), the 21 study participants were placed in an fMRI scanner and exposed to visual stimuli. The stimuli consisted of either 50 green and 50 red dots or 50 yellow and 50 blue dots on a black back- ground (Figure 1). Half of the dots of each color moved in opposite directions along either a horizontal or vertical axis at a speed of 4.30˚/s, not in a straight line but at variable angles within a range of 0.14˚ perpendicular to the original movement direction. The other half of the dots of each color flashed at random locations in order to increase task difficulty. Equiluminance of different col- ors was separately established for each subject by flicker photometry [15] before testing. All visual stimuli were constructed using COGENT Graphics (available at www.vislab.ucl.ac.uk) run in MATLAB (Mathworks Inc.). The subjects were instructed that their task was to identify which color was moving in which direction, us- ing a keypad to answer 1 of 2 questions that randomly appeared after presentation of the stimulus. One question asked, “Which color of dots was moving direction?” with the word directio n replaced by up, down, left, or right, as appropriate, and one question asked, “In which direction were the color dots moving?” with the word color re- placed by green, red, yellow, or blue, as appropriate. The questions were relevant to the stimuli. For instance, if the subjects were shown red and green dots, they were not asked about the directions of blue or yellow dots but that of red and green dots. If they were shown dots moving only horizontally, they were not asked the color of the dots moving vertically but horizontally either to the left or right. The combination of stimuli and the related ques- tions were balanced in a pseudorandom sequence, such that each stimulus type was followed by each of the pos- sible questions in turn within a block of 32 trials. Each subject’s response was objectively categorized as either correct or incorrect, based on accuracy. In addition, each subject subjectively judged himself/herself either capable or incapable of binding the features. The sub ject’s judgment was a binary response, with “capable” indicat- Figure 1. Schematic diagram depicting the study task. The examples shown here are the stimuli consisting of red and green dots moving horizontally for a specific duration. A question then appeared to which the subject responded using the keypad and the response immediately showed up on the relevant grey bar. The question shown here was related to the direction of movement of the green dots, and the subject could provide the same response in the capable-of-binding (on the bottom left) or ncapable-of-binding (on the bottom right) condition. i Copyright © 2013 SciRes. JBBS  T.-C. CHIANG ET AL. 59 ing the subject felt that s/he could bind features success- fully and “incapable” indicating the subject felt that s/he could not do it. No further questions were asked for the subjective assessment. Instead, subjects answered the co- lor/motion question and automatically marked their an- swer as “capable” or “incapable” at the same time. Scores A, B, C, and D in Table 1 each correspond to the number of times that a subject’s responses fell into a particular category. Score A corresponds to the number of times that a subject responded correctly and reported that he or she was able to bind the features; Score B, the number of times that a subject responded correctly, but reported that he or she was unable to bind the features; Score C, the number of times that a subject responded incorrectly, but reported that he or she was able to bind the features; Score D, the number of times that a subject responded incorrectly and reported that he or she was not able to bind the features. The only way to confirm the subjective declaration of capability or incapability of fea- ture binding was to compare the subjective assessment against the objective accuracy data. If an individual’s subjective assessment of their capa- bility of feature binding was accurate, the comparison of their subjective assessment against the objective data would be expected to yield results significantly greater than those obtained by chance alone (i.e., A/(A + C) ≥ 68%), based on the reasoning that the minimum prob- ability of obtaining a value significantly higher than 50% is 0.6732 when the α-value is set to 0.05. Setting the thre- shold of 0.6732 for the positive binding condition did not affect the incapable binding trials (i.e., B + D), in which a 50% threshold was used, because the accuracy in these trials is expected to be no greater than chance (0.5). These criteria were applied to individual subjects. Sub- jects whose data did not meet these criteria (2 of the 21 subjects) were excluded from the study. 2.2. Subjects Twenty-one healthy subjects (8 males and 13 females) between 19 and 30 years of age (mean ± SD, 22.7 ± 2.7) participated in the fMRI experiment. All subjects were Table 1. Response categories. Responses were categorized according to the assessment of the capability of binding fea- tures (subjective judgment) and accuracy (objective judg- ment) in binding. Capable binding was represented as the combination of Cell A and Cell C, if and only if A/(A + C) ≥ 0.68, while incapable binding was represented as the com- bination of Cell B and Cell D, if and only if B/(B + D) ≈ 0.5. Capability of Binding Capable Incapable Correct A B Response Incorrect C D right-handed and had normal or corrected-to-normal vi- sion. Written informed consent was obtained from all subjects. The study was approved by institutional review board of the Department of Psychology, National Chung Cheng University, Taiwan. Each subject received 1000 Taiwan Dollars as compensation for his/her time and travel costs. 2.3. fMRI Scanning Methods All functional scanning was performed with a 3-T Bruker 30/90 Medspec fMRI scanner fitted with a standard bird- cage head coil (Bruker BioSpin MRI GmbH; Ettlingen, Germany). An echo-planar imaging (EPI) sequence was applied for functional scans measuring blood oxygen le- vel dependent (BOLD) signals (echo time (TE) = 30 ms; repeat time (TR) = 3 seconds). Each brain image was ac- quired in an interleaved sequence from the bottom of the brain to the top, comprising 80 volumes of 35 axial slices; each slice was 3.75-mm thick with no gap between the slices, had a resolution of 3.75 × 3.75 × 3.75 mm, and covered nearly the entire brain. The first 7 volumes of each scanning session were discarded to allow for T1- equilibrium effects. T1-weighted axial anatomical scan- ning was performed after functional scanning to obtain high-resolution structural images comprising 35 axial slices, each with a resolution of 0.9375 × 0.9375 × 3.75 mm with no gap between the slices (TE = 39.4 ms, TR = 614.2 ms, flip angle = 90˚, field of view [FOV] = 240 mm). 2.4. Procedure Before initiating functional scanning, the duration of sti- mulus presentation for each subject was determined us- ing the method of limits. Using this method, the subject was first provided with the longest duration (2 seconds) of stimulus presentation with which to perform feature binding, to ensure that the subject was capable of feature binding within this duration. The subject was then pro- vided with succeeding durations each reduced by half until the subject reported that he or she could not bind the features. Next, the subject was provided with the shortest duration (32 ms) with which to perform feature binding, to ensure that the subject could not perform feature binding within this duration. The subject was then pro- vided with succeeding durations that each increased by two-fold until the subject reported that he or she could now bind the features. The descending and ascending order of duration was repeated 3 times per subject while varying the longest and shortest durations. After comple- tion of this process, a constant duration was chosen and tested for 64 trials (2 blocks of 32 trials) to ensure that the subject could meet the accuracy criteria defined above. If a subject failed to meet the performance criteria, an- Copyright © 2013 SciRes. JBBS  T.-C. CHIANG ET AL. 60 other duration was selected with which to repeat testing until the performance criteria had been fulfilled. The op- timal stimulus duration among the subjects ranged from 53.5 ms to 401.1 ms (mean = 155.5 ms, SD = 107.9 ms). The variation of duration did not affect performance. Each subject underwent 2 scanning sessions consisting of a total of 64 trials. Each trial consisted of a single pres- entation of the visual stimuli for a specific duration, after which a question appeared at the bottom of the screen for a 6 seconds (=2 × TR) period. During this period, the subjects indicated their response to the question and re- ported their capability of binding the features of color and motion. The next trial automatically began after 6 s had passed. 2.5. Behavioral Data Analysis The aim of behavioral data analysis was to confirm that the selected duration for individual subjects was appro- priate and to confirm accuracy of the subjective respon- ses. The measurement of accuracy was calculated and categorized according to whether the subject was capable or incapable of performing feature binding. As the accu- racy data were used as indices, the response for each trial was considered a sample of binomial data. The non-lin- ear mixed effect (NLMX) regression model was used to analyze the binomial data [16,17]. To conduct NLMX analysis, the accuracy of the fMRI experiment was mod- eled using the following equation: 011px ε =+∗+ , ε 2 pp (1) where p was the accuracy of either the capable-of-bind- ing or incapable-of-binding trials. Dummy coding was used in the regression model: x1 = 0 represented incapa- ble-of-binding trials and x1 = 1 represented capable-of- binding trials. The error among subjects,was assumed to fit the standard normalized distribution. According to the dummy coding, the estimate of p0 was the mean ac- curacy of the incapable-of-binding trials and the estimate of p1 was the difference in accuracy between the capa- ble-of-binding and incapable-of-binding trials. 2.6. fMRI Data Analysis The fMRI data were first preprocessed using the SPM8 software (Wellcome Trust Centre for Neuroimaging, Lon- don, UK, http://www.fil.ion.ucl.ac.uk/spm). Each func- tional scan of individual subjects was realigned to the average of all volumes obtained (i.e., the 73 volumes that remained after deleting the first 7 volumes for the T1- equilibrium effect) without unwarping and was re-sliced for the time correction. Next, each subject’s structural image was translated to match the first EPI volume for co-registration between the anatomic and functional scans. The structural image was then segmented into grey and white matter with an East Asian brain as the spatial tem- plate for the Affine regularization. The realigned and re- sliced images were then spatially normalized to the ca- nonical template provided by the SPM8 software and spatially smoothed with a Gaussian kernel of 8 mm full width at half maximum (FWHM). The pre-processed data were then subjected to first-level analysis using a voxel-wise general linear model (GLM) that included re- gressors defining stimulus onsets for each of the 4 facto- rial conditions (see Table 1). The number of button pres- ses and motion correction parameters were treated as ef- fects of non-interest. Appropriate regressors were con- volved with the default SPM hemodynamic response function (HRF) with 2 additional derivatives of a time derivative and a spatial dispersion. The default HRF function parameters described the BOLD intensity sig- nals since the onset of stimuli. For example, the length of the kernel was 32 s; the delay of peak BOLD responses was 6 s relative to onset; the delay of post-stimuli under- shoot was 16 s. Restricted maximum likelihood (ReML) inference was used to estimate the model parameters. The estimated parameters were applied to create contrasts in the facto- rial design, which were then employed to perform ran- dom-effects analysis between subjects (second-level ana- lysis) using one-sample t-testing with classical inference (ReML). The final outcome of these analyses was a group analysis, resulting from the pooling of data across the subjects. The statistical results were based on the un- corrected p-value (p = 0.001) and used to choose clusters (voxel number ≥ 5 in a cluster) that passed the criterion of multiple comparisons with a family-wise error (FWE) corrected p-value of 0.05 at the cluster level. The coor- dinates of all activation sites were based on the reference brain provided by the Montreal Neurological Institute (MNI). Conservative conjunction analysis was performed in the statistical parametric mapping (SPM) module to identify the common and shared areas between distinc- tive contrasts [18,19], such as Cell A and Cell D in Table 1. Two-sample t-testing coupled with classical inference (ReML) estimation was performed at the 2nd level of analysis to conduct group conjunction analysis. The re- sults were illustrated with an xjView toolbox (http://www.alivelearn.net/xjview). 3. Results Based on the duration selection procedure described above, the average number of trials in Cells A, B, C, and D were 40.2 (SD 6.7), 5.7 (SD 3.4), 10.2 (SD 4.3), and 7.7 (SD 4.7), respectively. The unbalanced number of trials (1 = 7.08, p < 0.01) was the result of >70% accuracy in the capable-of-binding trials and only 50% accuracy for in- capable-of-binding trials. Figure 2 shows the mean ac- Copyright © 2013 SciRes. JBBS 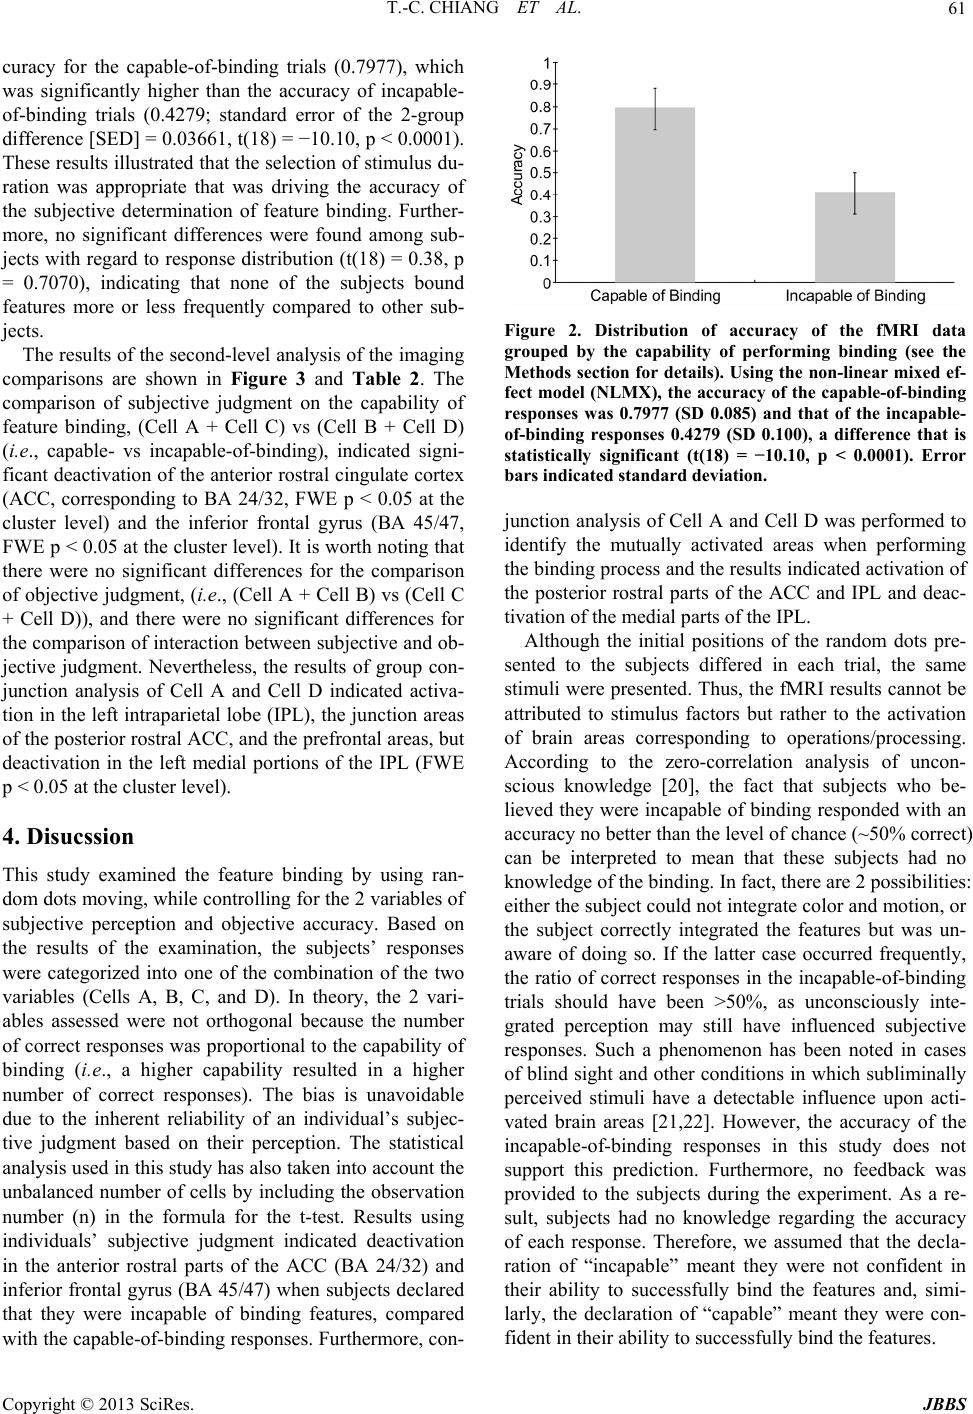 T.-C. CHIANG ET AL. 61 curacy for the capable-of-binding trials (0.7977), which was significantly higher than the accuracy of incapable- of-binding trials (0.4279; standard error of the 2-group difference [SED] = 0.03661, t(18) = −10.10, p < 0.0001). These results illustrated that the selection of stimulus du- ration was appropriate that was driving the accuracy of the subjective determination of feature binding. Further- more, no significant differences were found among sub- jects with regard to response distribution (t(18) = 0.38, p = 0.7070), indicating that none of the subjects bound features more or less frequently compared to other sub- jects. The results of the second-level analysis of the imaging comparisons are shown in Figure 3 and Table 2. The comparison of subjective judgment on the capability of feature binding, (Cell A + Cell C) vs (Cell B + Cell D) (i.e., capable- vs incapable-of-binding), indicated signi- ficant deactivation of the anterior rostral cingulate cortex (ACC, corresponding to BA 24/32, FWE p < 0.05 at the cluster level) and the inferior frontal gyrus (BA 45/47, FWE p < 0.05 at the cluster level). It is worth noting that there were no significant differences for the comparison of objective judgment, (i.e., (Cell A + Cell B) vs (Cell C + Cell D)), and there were no significant differences for the comparison of interaction between subjective and ob- jective judgment. Nevertheless, the results of group con- junction analysis of Cell A and Cell D indicated activa- tion in the left intraparietal lobe (IPL), the junction areas of the posterior rostral ACC, and the prefrontal areas, but deactivation in the left medial portions of the IPL (FWE p < 0.05 at the cluster level). 4. Disucssion This study examined the feature binding by using ran- dom dots moving, while controlling for the 2 variables of subjective perception and objective accuracy. Based on the results of the examination, the subjects’ responses were categorized into one of the combination of the two variables (Cells A, B, C, and D). In theory, the 2 vari- ables assessed were not orthogonal because the number of correct responses was proportional to the capability of binding (i.e., a higher capability resulted in a higher number of correct responses). The bias is unavoidable due to the inherent reliability of an individual’s subjec- tive judgment based on their perception. The statistical analysis used in this study has also taken into account the unbalanced number of cells by including the observation number (n) in the formula for the t-test. Results using individuals’ subjective judgment indicated deactivation in the anterior rostral parts of the ACC (BA 24/32) and inferior frontal gyrus (BA 45/47) when subjects declared that they were incapable of binding features, compared with the capable-of-binding responses. Furthermore, con- Figure 2. Distribution of accuracy of the fMRI data grouped by the capability of performing binding (see the Methods section for details). Using the non-linear mixed ef- fect model (NLMX), the accuracy of the capable-of-binding responses was 0.7977 (SD 0.085) and that of the incapable- of-binding responses 0.4279 (SD 0.100), a difference that is statistically significant (t(18) = −10.10, p < 0.0001). Error bars indicated standard deviation. junction analysis of Cell A and Cell D was performed to identify the mutually activated areas when performing the binding process and the results indicated activation of the posterior rostral parts of the ACC and IPL and deac- tivation of the medial parts of the IPL. Although the initial positions of the random dots pre- sented to the subjects differed in each trial, the same stimuli were presented. Thus, the fMRI results cannot be attributed to stimulus factors but rather to the activation of brain areas corresponding to operations/processing. According to the zero-correlation analysis of uncon- scious knowledge [20], the fact that subjects who be- lieved they were incapable of binding responded with an accuracy no better than the level of chance (~50% correct) can be interpreted to mean that these subjects had no knowledge of the binding. In fact, there are 2 possibilities: either the subject could not integrate color and motion, or the subject correctly integrated the features but was un- aware of doing so. If the latter case occurred frequently, the ratio of correct responses in the incapable-of-binding trials should have been >50%, as unconsciously inte- grated perception may still have influenced subjective responses. Such a phenomenon has been noted in cases of blind sight and other conditions in which subliminally perceived stimuli have a detectable influence upon acti- vated brain areas [21,22]. However, the accuracy of the incapable-of-binding responses in this study does not support this prediction. Furthermore, no feedback was provided to the subjects during the experiment. As a re- sult, subjects had no knowledge regarding the accuracy of each response. Therefore, we assumed that the decla- ration of “incapable” meant they were not confident in their ability to successfully bind the features and, simi- larly, the declaration of “capable” meant they were con- fident in their ability to successfully bind the features. Copyright © 2013 SciRes. JBBS 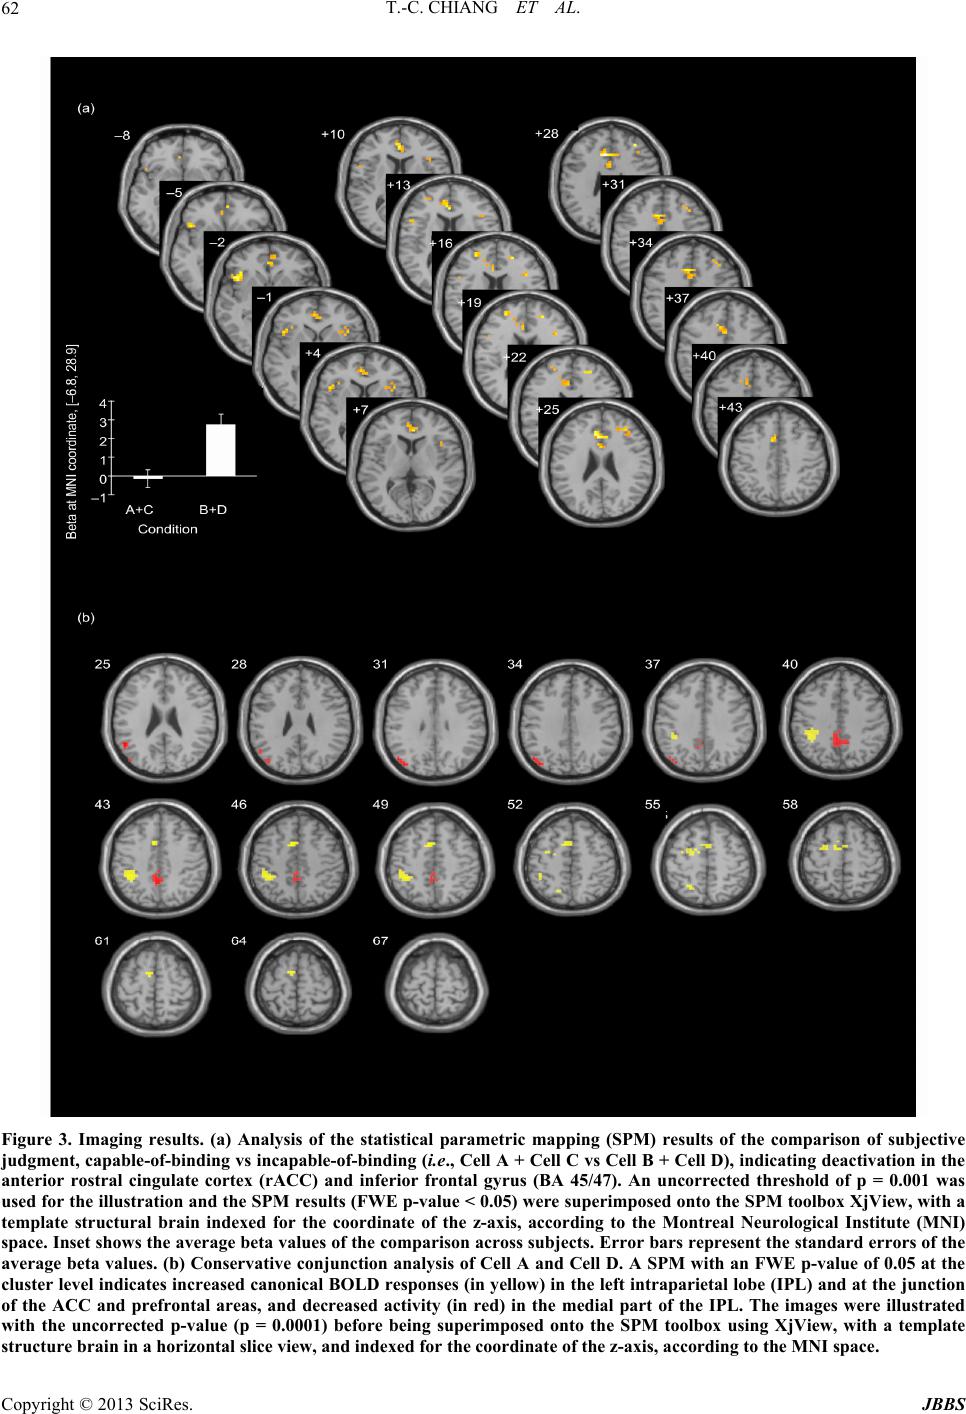 T.-C. CHIANG ET AL. Copyright © 2013 SciRes. JBBS 62 Figure 3. Imaging results. (a) Analysis of the statistical parametric mapping (SPM) results of the comparison of subjective judgment, capable-of-binding vs incapable-of-binding (i.e., Cell A + Cell C vs Cell B + Cell D), indicating deactivation in the anterior rostral cingulate cortex (rACC) and inferior frontal gyrus (BA 45/47). An uncorrected threshold of p = 0.001 was used for the illustration and the SPM results (FWE p-value < 0.05) were superimposed onto the SPM toolbox XjView, with a template structural brain indexed for the coordinate of the z-axis, according to the Montreal Neurological Institute (MNI) space. Inset shows the average beta values of the comparison across subjects. Error bars represent the standard errors of the average beta values. (b) Conservative conjunction analysis of Cell A and Cell D. A SPM with an FWE p-value of 0.05 at the cluster level indicates increased canonical BOLD responses (in yellow) in the left intraparietal lobe (IPL) and at the junction of the ACC and prefrontal areas, and decreased activity (in red) in the medial part of the IPL. The images were illustrated with the uncorrected p-value (p = 0.0001) before being superimposed onto the SPM toolbox using XjView, with a template structure brain in a horizontal slice view, and indexed for the coordinate of the z-axis, according to the MNI space. 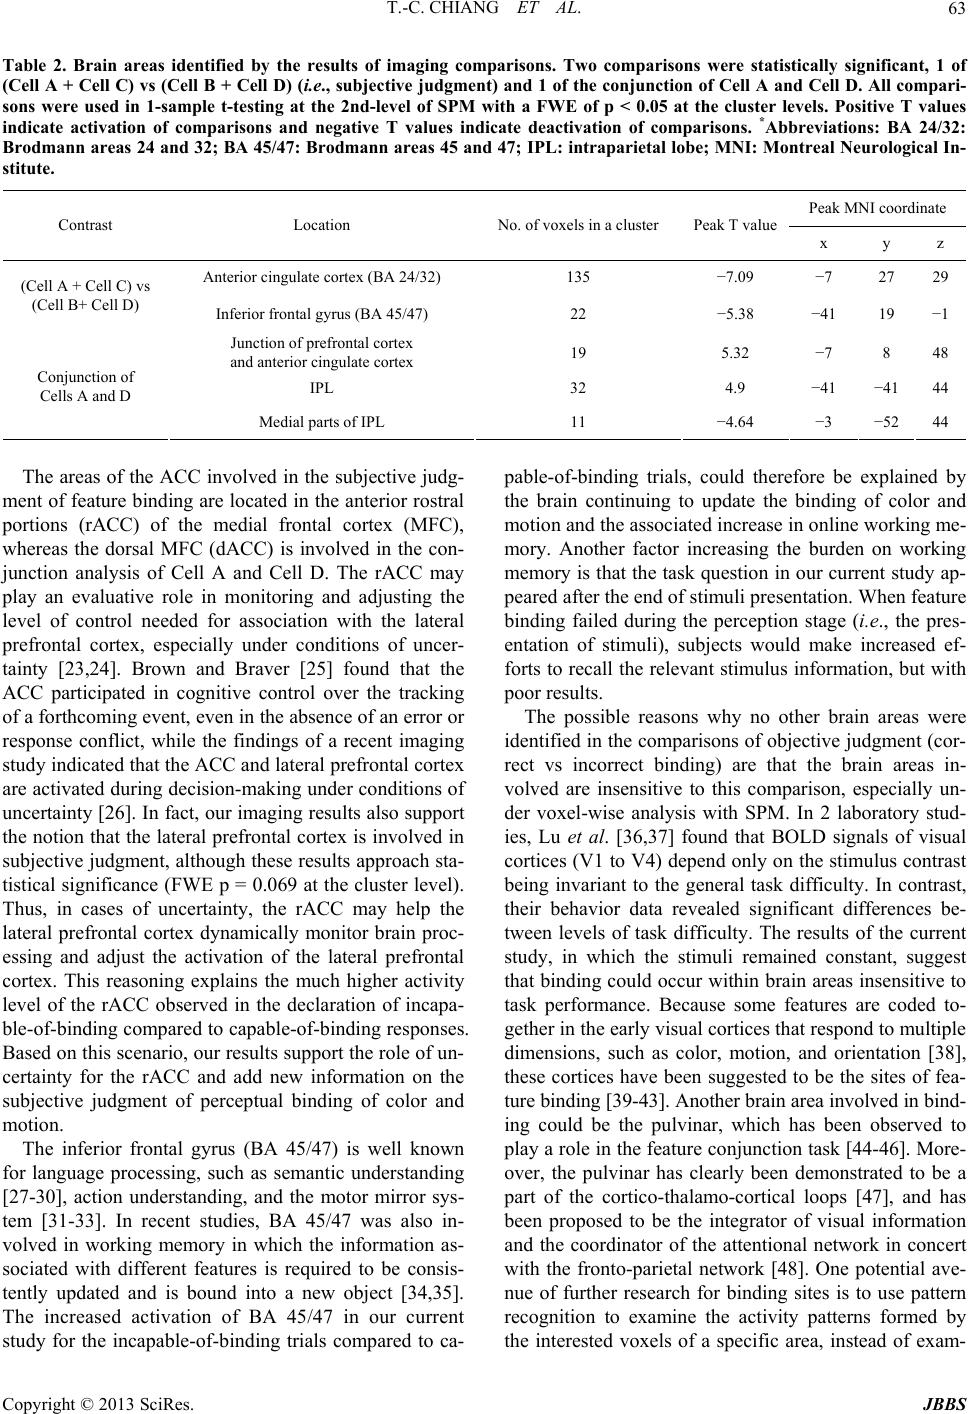 T.-C. CHIANG ET AL. 63 Table 2. Brain areas identified by the results of imaging comparisons. Two comparisons were statistically significant, 1 of (Cell A + Cell C) vs (Cell B + Cell D) (i.e., subjective judgment) and 1 of the conjunction of Cell A and Cell D. All compari- sons were used in 1-sample t-testing at the 2nd-level of SPM with a FWE of p < 0.05 at the cluster levels. Positive T values indicate activation of comparisons and negative T values indicate deactivation of comparisons. *Abbreviations: BA 24/32: Brodmann areas 24 and 32; BA 45/47: Brodmann areas 45 and 47; IPL: intraparietal lobe; MNI: Montreal Neurological In- stitute. Peak MNI coordinate Contrast Location No. of voxels in a cluster Peak T value x y z Anterior cingulate cortex (BA 24/32) 135 −7.09 −7 27 29 (Cell A + Cell C) vs (Cell B+ Cell D) Inferior frontal gyrus (BA 45/47) 22 −5.38 −41 19 −1 Junction of prefrontal cortex and anterior cingulate cortex 19 5.32 −7 8 48 IPL 32 4.9 −41 −4144 Conjunction of Cells A and D Medial parts of IPL 11 −4.64 −3 −5244 The areas of the ACC involved in the subjective judg- ment of feature binding are located in the anterior rostral portions (rACC) of the medial frontal cortex (MFC), whereas the dorsal MFC (dACC) is involved in the con- junction analysis of Cell A and Cell D. The rACC may play an evaluative role in monitoring and adjusting the level of control needed for association with the lateral prefrontal cortex, especially under conditions of uncer- tainty [23,24]. Brown and Braver [25] found that the ACC participated in cognitive control over the tracking of a forthcoming event, even in the absence of an error or response conflict, while the findings of a recent imaging study indicated that the ACC and lateral prefrontal cortex are activated during decision-making under conditions of uncertainty [26]. In fact, our imaging results also support the notion that the lateral prefrontal cortex is involved in subjective judgment, although these results approach sta- tistical significance (FWE p = 0.069 at the cluster level). Thus, in cases of uncertainty, the rACC may help the lateral prefrontal cortex dynamically monitor brain proc- essing and adjust the activation of the lateral prefrontal cortex. This reasoning explains the much higher activity level of the rACC observed in the declaration of incapa- ble-of-binding compared to capable-of-binding responses. Based on this scenario, our results support the role of un- certainty for the rACC and add new information on the subjective judgment of perceptual binding of color and motion. The inferior frontal gyrus (BA 45/47) is well known for language processing, such as semantic understanding [27-30], action understanding, and the motor mirror sys- tem [31-33]. In recent studies, BA 45/47 was also in- volved in working memory in which the information as- sociated with different features is required to be consis- tently updated and is bound into a new object [34,35]. The increased activation of BA 45/47 in our current study for the incapable-of-binding trials compared to ca- pable-of-binding trials, could therefore be explained by the brain continuing to update the binding of color and motion and the associated increase in online working me- mory. Another factor increasing the burden on working memory is that the task question in our current study ap- peared after the end of stimuli presentation. When feature binding failed during the perception stage (i.e., the pres- entation of stimuli), subjects would make increased ef- forts to recall the relevant stimulus information, but with poor results. The possible reasons why no other brain areas were identified in the comparisons of objective judgment (cor- rect vs incorrect binding) are that the brain areas in- volved are insensitive to this comparison, especially un- der voxel-wise analysis with SPM. In 2 laboratory stud- ies, Lu et al. [36,37] found that BOLD signals of visual cortices (V1 to V4) depend only on the stimulus contrast being invariant to the general task difficulty. In contrast, their behavior data revealed significant differences be- tween levels of task difficulty. The results of the current study, in which the stimuli remained constant, suggest that binding could occur within brain areas insensitive to task performance. Because some features are coded to- gether in the early visual cortices that respond to multiple dimensions, such as color, motion, and orientation [38], these cortices have been suggested to be the sites of fea- ture binding [39-43]. Another brain area involved in bind- ing could be the pulvinar, which has been observed to play a role in the feature conjunction task [44-46]. More- over, the pulvinar has clearly been demonstrated to be a part of the cortico-thalamo-cortical loops [47], and has been proposed to be the integrator of visual information and the coordinator of the attentional network in concert with the fronto-parietal network [48]. One potential ave- nue of further research for binding sites is to use pattern recognition to examine the activity patterns formed by the interested voxels of a specific area, instead of exam- Copyright © 2013 SciRes. JBBS  T.-C. CHIANG ET AL. 64 ining the activity of individual voxels adopted by SPM. In order to further explore the binding mechanism and reveal common processing sites, conjunction analysis of Cell A and Cell D was performed. Cell D rather than Cell B + Cell D was selected for analysis because Cell A and Cell B already shared a fixed component, i.e., the correct responses made by subjects. In other words, if conjunc- tion analysis of Cell A and Cell B + Cell D had been per- formed, the results would have been confounded by the brain areas corresponding to the correct responses. In contrast, Cell A and Cell D contained the different com- ponents of correctness and capability of binding. The re- sults indicated activation of the lateral parts of the intra- parietal lobe (IPL) and deactivation of the medial parts of the IPL, a finding compatible with the previous finding that the parietal lobe is necessary for feature binding [6,8, 10]. However, different parts of the parietal lobe assume different roles in visual attention. The intraparietal sulcus (IPS) has been clearly demonstrated to exhibit enhanced activities during the voluntary and stimulus-driven shifts of spatial attention [49-52], while the superior parietal lobe (SPL) has been shown to play a role in maintaining and tracking the current locus of attention, especially in the peripheral visual field [53]. In contrast, the medial area of the parietal lobe has been related to transient shift-related signals [52], as it is domain-independent and is associated with shifts in attention [54,55]. Consideration of these findings, together with the in- crease in IPL activity observed in this study, suggests that completing the study task (in both Cells A and D) required initiating and maintaining spatial attention in the peripheral visual field. In addition, the decrease in activ- ity observed in the medial part of the IPL suggests that the shifts in attention that occurred during task comple- tion may have been irrelevant and therefore inhibited. It is worth noting that the task did not manipulate the atten- tional focus on color or motion, as well as the fact that it would have been difficult for the subjects to shift atten- tional focus between color and motion because the dura- tion of stimulus exposure was relatively brief. According to the Boolean map theory [56-58], if the subjects had adopted a strategy of shifting attention from 1 color to another color or from 1 motion to another motion, they would have had to expend extra time or cost to perform the attentional shift, leaving them with little time for fea- ture binding after attentional shifting and thus leading to binding failure. As the Boolean map of the task con- tained and simultaneously presented the dimensions of color and its moving direction, the subjects could only at- tentionally access one Boolean map at a time. The con- tent of the Boolean map is detected/processed in a paral- lel way. As a result, the color and its moving direction, or the moving direction and its color were within a Boolean map in which the act of detection was so rapid that it did not require the expenditure of extra time or cost. There- fore, the best strategy for successful feature binding is maintaining attention on one Boolean map (i.e., on one color and its moving direction, or one direction in which the dots are moving and their color). 5. Conclusion This study examined the mechanism underlying the bind- ing of color and motion by performing conjunction ana- lysis and comparing subjective and objective judgment using the same stimuli to exclude the possibility of sti- mulus attributions to imaging results. The imaging re- sults indicate that the rACC and BA 45/47 are negatively correlated with the capable-of-binding responses (Cell A + Cell C) as opposed to incapable-of-binding responses (Cell B + Cell D). This suggests the uncertainty of inca- pability-to-bind features and also that working memory is involved in feature binding. However, the binding site may not be sensitive to BOLD signals, especially in the visual cortices. The results of conjunction analysis of the 2 binding conditions (Cell A and Cell D) revealed the mutually activated brain areas to be the lateral and me- dial parts of IPL, suggesting that the maintenance of at- tention on stimuli is necessary for performing feature binding processing. 6. Acknowledgements We thank the interdisciplinary MRI/MRS laboratory and C.-H. Hsieh and J.-H. Chen of the Instrumentation Cen- tre, National Taiwan University for assistance with the MRI experiments. This work was supported by the Na- tional Science Council, Taiwan (NSC-97-2410-H-194- 112). REFERENCES [1] M. Livingstone and D. Hubel, “Segregation of Form, Color, Movement, and Depth: Anatomy, Physiology, and Perception,” Science, Vol. 240, No. 4853, 1988, pp. 740- 749. doi:10.1126/science.3283936 [2] S. Zeki, “Functional Specialisation in the Visual Cortex of the Rhesus Monkey,” Nature, Vol. 274, No. 5670, 1978, pp. 423-428. doi:10.1038/274423a0 [3] K. Moutoussis and S. Zeki, “A Direct Demonstration of Perceptual Asynchrony in Vision,” Proceedings of Bio- logical Sciences, Vol. 264, No. 1380, 1997, pp. 393-399. doi:10.1098/rspb.1997.0056 [4] A. Treisman, “The Binding Problem,” Current Opinion in Neurobiology, Vol. 6, No. 2, 1996, pp. 171-178. doi:10.1016/S0959-4388(96)80070-5 [5] E. Ashbridge, V. Walsh and A. Cowey, “Temporal As- pects of Visual Search Studied by Transcranial Magnetic Stimulation,” Neuropsychologia, Vol. 35, No. 8, 1997, pp. 1121-1131. doi:10.1016/S0028-3932(97)00003-1 Copyright © 2013 SciRes. JBBS  T.-C. CHIANG ET AL. 65 [6] M. Corbetta, et al., “Superior Parietal Cortex Activation during Spatial Attention Shifts and Visual Feature Con- junction,” Science, Vol. 270, No. 5237, 1995, pp. 802- 805. doi:10.1126/science.270.5237.802 [7] M. Corbetta, C. M. Sylvester and G. L. HShulman, “The Frontoparietal Attention Network,” In: The Cognitive Neu- rosciences, MIT Press, Cambridge, 2009, pp. 219-233. [8] S. R. Friedman-Hill, L. C. Robertson and A. Treisman, “Parietal Contributions to Visual Feature Binding: Evi- dence from a Patient with Bilateral Lesions,” Science, Vol. 269, No. 5225, 1995, pp. 853-835. doi:10.1126/science.7638604 [9] S. Kastner, S. A. McMains and D. Beck, “Mechanisms of Selective Attention in the Human Visual System: Evi- dence from Neuroimaging,” In: The Cognitive Neurosci- ences, MIT Press, Cambridge, 2009, pp. 205-217. [10] M. Oliveri, et al., “Facilitation of Bottom-Up Feature De- tection Following rTMS-Interference of the Right Parietal Cortex,” Neuropsychologia, Vol. 48, No. 4, 2010, pp. 1003-1010. doi:10.1016/j.neuropsychologia.2009.11.024 [11] A. Treisman and G. Gelade, “A Feature-Integration The- ory of Attention,” Cognitive Psychology, Vol. 12, No. 1, 1980, pp. 97-136. doi:10.1016/0010-0285(80)90005-5 [12] S. M. Fleming and R. J. Dolan, “The Neural Basis of Metacognitive Ability,” Philosophical Transactions of the Royal Society B-Biological Sciences, Vol. 367, No. 1594, 2012, pp. 1338-1349. doi:10.1098/rstb.2011.0417 [13] H. C. Lau and R. E. Passingham, “Relative Blindsight in Normal Observers and the Neural Correlate of Visual Con- sciousness,” Proceedings of the National Academy of Sciences, Vol. 103, No. 49, 2006, pp. 18763-18768. doi:10.1073/pnas.0607716103 [14] D. Rosenthal, “Higher-Order Awareness, Misrepresenta- tion and Function,” Philosophical Transactions of the Ro- yal Society B-Biological Sciences, Vol. 367, No. 1594, 2012, pp. 1424-1438. doi:10.1098/rstb.2011.0353 [15] P. K. Kaiser, “Flicker as a Function of Wavelength and Heterochromatic Flicker Photometry,” In: Vision and Dys- function, Basingstoke, MacMilliap, 1991, pp. 171-190. [16] N. E. Breslow and D. G. Clayton, “Approximate Infer- ence in Generalized Linear Mixed Models,” Journal of Computational and Graphical Statistics, Vol. 88, No. 421, 1993, pp. 9-25. [17] T. F. Jaeger, “Categorical Data Analysis: Away from ANOVAs (Transformation or Not) and towards Logit Mixed Models,” Journal of Memory and Language, Vol. 59, No. 4, 2008, pp. 434-446. doi:10.1016/j.jml.2007.11.007 [18] K. J. Friston, W. D. Penny and D. E. Glaser, “Conjunc- tion Revisited,” Neuroimage, Vol. 25, No. 3, 2005, pp. 661-667. doi:10.1016/j.neuroimage.2005.01.013 [19] T. Nichols, et al., “Valid Conjunction Inference with the Minimum Statistic,” Neuroimage, Vol. 25, No. 3, 2005, pp. 653-660. doi:10.1016/j.neuroimage.2004.12.005 [20] Z. Dienes, “Subjective Measures of Unconscious Knowl- edge,” Progress in Brain Research, Vol. 168, 2007, pp. 49-64. [21] H. C. Lau and R. E. Passingham, “Unconscious Activa- tion of the Cognitive Control System in the Human Pre- frontal Cortex,” Journal of Neuroscience, Vol. 27, No. 21, 2007, pp. 5805-5811. doi:10.1523/JNEUROSCI.4335-06.2007 [22] A. Sahraie, et al., “Pattern of Neuronal Activity Associ- ated with Conscious and Unconscious Processing of Vis- ual Signals,” Proceedings of the National Academy of Sciences, Vol. 94, No. 17, 1997, pp. 9406-9411. doi:10.1073/pnas.94.17.9406 [23] M. M. Botvinick, “Conflict Monitoring and Decision Making: Reconciling Two Perspectives on Anterior Cin- gulate Function,” Cognitive, Affective, & Behavioral Neu- roscience, Vol. 7, No. 4, 2007, pp. 356-366. doi:10.3758/CABN.7.4.356 [24] M. F. Rushworth and T. E. Behrens, “Choice, Uncertainty and Value in Prefrontal and Cingulate Cortex,” Nature Neuroscience, Vol. 11, No. 4, 2008, pp. 389-397. doi:10.1038/nn2066 [25] J. W. Brown and T. S. Braver, “Learned Predictions of Error Likelihood in the Anterior Cingulate Cortex,” Sci- ence, Vol. 307, No. 5712, 2005, pp. 1118-1121. doi:10.1126/science.1105783 [26] H. Ohira, et al., “Brain and Autonomic Association Ac- companying Stochastic Decision-Making,” Neuroimage, Vol. 49, No. 1, 2010, pp. 1024-1037. doi:10.1016/j.neuroimage.2009.07.060 [27] M. H. Davis, et al., “Dissociating Speech Perception and Comprehension at Reduced Levels of Awareness,” Pro- ceedings of the National Academy of Sciences, Vol. 104, No. 41, 2007, pp. 16032-16037. doi:10.1073/pnas.0701309104 [28] K. Hoenig and L. Scheef, “Mediotemporal Contributions to Semantic Processing: fMRI Evidence from Ambiguity Processing during Semantic Context Verification,” Hip- pocampus, Vol. 15, No. 5, 2005, pp. 597-609. doi:10.1002/hipo.20080 [29] J. M. Rodd, M. H. Davis and I. S. Johnsrude, “The Neural Mechanisms of Speech Comprehension: fMRI Studies of Semantic Ambiguity,” Cereb Cortex, Vol. 15, No. 8, 2005, pp. 1261-1269. doi:10.1093/cercor/bhi009 [30] M. Z. Zempleni, et al., “Semantic Ambiguity Processing in Sentence Context: Evidence from Event-Related fMRI,” Neuroimage, Vol. 34, No. 3, 2007, pp. 1270-1279. doi:10.1016/j.neuroimage.2006.09.048 [31] A. F. Hamilton and S. T. Grafton, “Action Outcomes Are Represented in Human Inferior Frontoparietal Cortex,” Cereb Cortex, Vol. 18, No. 5, 2008, pp. 1160-1168. doi:10.1093/cercor/bhm150 [32] M. Iacoboni, et al., “Grasping the Intentions of Others with One’s Own Mirror Neuron System,” PLoS Biology, Vol. 3, No. 3, 2005, p. e79. doi:10.1371/journal.pbio.0030079 [33] G. Rizzolati, L. Fogassi and V. Gallese, “The Mirror Neu- ron System: A Motor-Based Mechanism for Action and Intention Understanding,” In: The Cognitive Neurosci- ence, The MIT Press, Cambridge, 2009, pp. 625-640. [34] N. Gorgoraptis, et al., “Dynamic Updating of Working Copyright © 2013 SciRes. JBBS  T.-C. CHIANG ET AL. Copyright © 2013 SciRes. JBBS 66 Memory Resources for Visual Objects,” Journal of Neu- roscience, Vol. 31, No. 23, 2011, pp. 8502-8511. doi:10.1523/JNEUROSCI.0208-11.2011 [35] S. Takahama, S. Miyauchi and J. Saiki, “Neural Basis for Dynamic Updating of Object Representation in Visual Working Memory,” Neuroimage, Vol. 49, No. 4, 2010, pp. 3394-3403. doi:10.1016/j.neuroimage.2009.11.029 [36] X. Li, et al., “Blood Oxygenation Level-Dependent Con- trast Response Functions Identify Mechanisms of Covert Attention in Early Visual Areas,” Proceedings of the Na- tional Academy of Sciences, Vol. 105, No. 16, 2008, pp. 6202-6207. doi:10.1073/pnas.0801390105 [37] Z. L. Lu, et al., “Attention Extracts Signal in External Noise: A Bold fMRI Study,” Journal of Cognitive Neu- roscience, Vol. 23, No. 5, 2011, pp. 1148-1159. doi:10.1162/jocn.2010.21511 [38] A. G. Leventhal, et al., “Concomitant Sensitivity to Ori- entation, Direction, and Color of Cells in Layers 2, 3, and 4 of Monkey Striate Cortex,” Journal of Neuroscience, Vol. 15, No. 3, 1995, pp. 1808-1818. [39] E. Blaser, T. Papathomas and Z. Vidnyanszky, “Binding of Motion and Colour Is Early and Automatic,” European Journal of Neuroscience, Vol. 21, No. 7, 2005, pp. 2040- 2044. doi:10.1111/j.1460-9568.2005.04032.x [40] A. O. Holcombe and P. Cavanagh, “Early Binding of Fea- ture Pairs for Visual Perception,” Nature Neuroscience, Vol. 4, No. 2, 2001, pp. 127-128. doi:10.1038/83945 [41] K. Seymour, et al., “The Coding of Color, Motion, and Their Conjunction in the Human Visual Cortex,” Current Biology, Vol. 19, No. 3, 2009, pp. 177-183. doi:10.1016/j.cub.2008.12.050 [42] O. J. Hulme, L. Whiteley and S. Shipp, “Spatially Dis- tributed Encoding of Covert Attentional Shifts in Human Thalamus,” Journal of Neurophysiology, Vol. 104, No. 6, 2010, pp. 3644-3656. [43] S. Shipp, et al., “Feature Binding in the Feedback Layers of Area V2,” Cereb Cortex, Vol. 19, No. 10, 2009, pp. 2230-2239. doi:10.1093/cercor/bhn243 [44] A. Treisman and H. Schmidt, “Illusory Conjunctions in the Perception of Objects,” Cognitive Psychology, Vol. 14, No. 1, 1982, pp. 107-141. doi:10.1016/0010-0285(82)90006-8 [45] R. Ward, et al., “Deficits in Spatial Coding and Feature Binding Following Damage to Spatiotopic Maps in the Human Pulvinar,” Nature Neuroscience, Vol. 5, No. 2, 2002, pp. 99-100. [46] G. Wolford and K. H. Shum, “Evidence for Feature Per- turbations,” Percept Psychophys, Vol. 27, No. 5, 1980, pp. 409-420. doi:10.3758/BF03204459 [47] C. Casanova, “The Visual Functions of the Pulvinar,” In: The Visual Neurosciences, MIT Press, Cambridge, 2004. [48] S. Kastner and M. A. Pinsk, “Visual Attention as a Mul- tilevel Selection Process,” Cognitive, Affective, & Behav- ioral Neuroscience, Vol. 4, No. 4, 2004, pp. 483-500. doi:10.3758/CABN.4.4.483 [49] M. Corbetta and G. L. Shulman, “Control of Goal-Directed and Stimulus-Driven Attention in the Brain,” Nature Re- views Neuroscience, Vol. 3, 2002, pp. 201-215. [50] J. Hopfinger, M. H. Buonocore and G. R. Mangun, “The Neural Mechanisms of Top-Down Attentional Control,” Nature Neuroscience, Vol. 3, 2000, pp. 284-291. [51] S. Kastner, et al., “Increased Activity in Human Visual Cortex during Directed Attention in the Absence of Vis- ual Stimulation,” Neuron, Vol. 22, No. 4, 1999, pp. 751- 761. doi:10.1016/S0896-6273(00)80734-5 [52] T. Liu, et al., “Cortical Mechanisms of Feature-Based Attentional Control,” Cereb Cortex, Vol. 13, 2003, pp. 1334-1343. [53] T. A. Kelley, et al., “Cortical Mechanisms for Shifting and Holding Visuospatial Attention,” Cereb Cortex, Vol. 18, No. 1, 2008, pp. 114-125. doi:10.1093/cercor/bhm036 [54] J. T. Serences and S. Yantis, “Spatially Selective Repre- sentations of Voluntary and Stimulus-Driven Attentional Priority in Human Occipital, Parietal, and Frontal Cor- tex,” Cereb Cortex, Vol. 17, No. 2, 2007, pp. 284-293. doi:10.1093/cercor/bhj146 [55] R. Vandenberghe, et al., “Functional Specificity of Supe- rior Parietal Mediation of Spatial Shifting,” Neuroimage, Vol. 14, 2001, pp. 661-673. [56] L. Huang, A. Treisman and H. Pashler, “Characterizing the Limits of Human Visual Awareness,” Science, Vol. 317, No. 5839, 2007, pp. 823-825. doi:10.1126/science.1143515 [57] L. Huang and H. Pashler, “A Boolean Map Theory of Vis- ual Attention,” Psychological Review, Vol. 114, 2007, pp. 599-631. [58] L. Huang, “What Is the Unit of Visual Attention? Object for Selection, but Boolean Map for Access,” Journal of Experimental Psychology: General, Vol. 139, 2010, pp. 162-179.
|