Paper Menu >>
Journal Menu >>
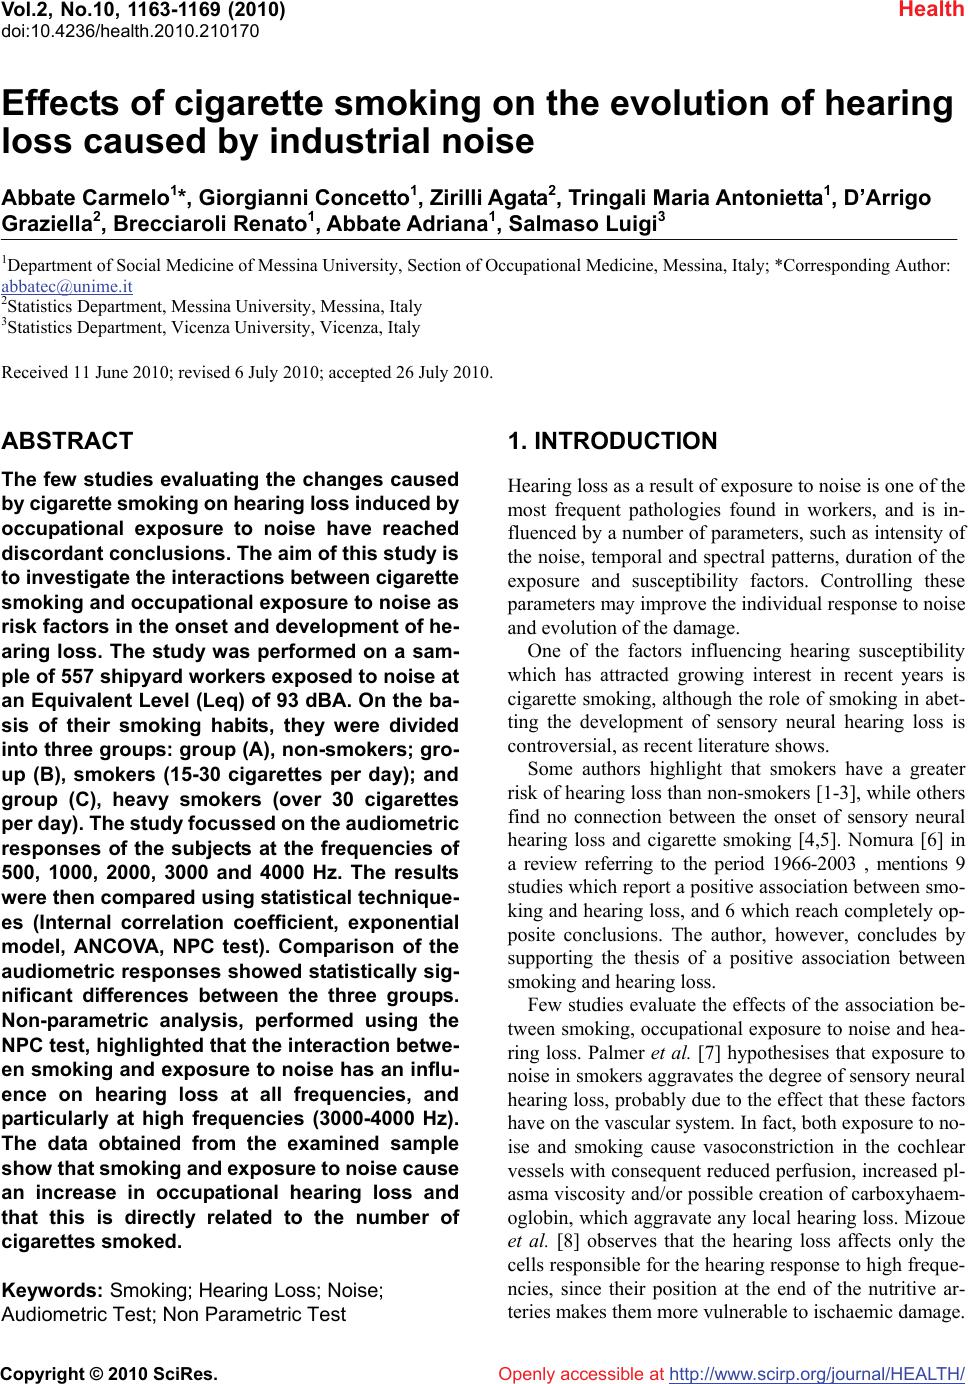 Vol.2, No.10, 1163-1169 (2010) Health doi:10.4236/health.2010.210170 Copyright © 2010 SciRes. Openly accessible at http://www.scirp.org/journal/HEALTH/ Effects of cigarette smoking on the evolution of hearing loss caused by industrial noise Abbate Carmelo1*, Giorgianni Concetto1, Zirilli Agata2, Tringali Maria Antonietta1, D’Arrigo Graziella2, Brecciaroli Renato1, Abbate Adriana1, Salmaso Luigi3 1Department of Social Medicine of Messina University, Section of Occupational Medicine, Messina, Italy; *Corresponding Author: abbatec@unime.it 2Statistics Department, Messina University, Messina, Italy 3Statistics Department, Vicenza University, Vicenza, Italy Received 11 June 2010; revised 6 July 2010; accepted 26 July 2010. ABSTRACT The few studies evaluating the changes caused by cigarette smoking on hearing loss induced by occupational exposure to noise have reached discordant conclusions. The aim of this study is to investigate the interactions between cigarette smoking and occupational exposure to noise as risk factors in the onset and development of he- aring loss. The study was performed on a sam- ple of 557 shipyard workers exposed to noise at an Equivalent Level (Leq) of 93 dBA. On the ba- sis of their smoking habits, they were divided into three groups: group (A), non-smokers; gro- up (B), smokers (15-30 cigarettes per day); and group (C), heavy smokers (over 30 cigarettes per day). The study focussed on the audiometric responses of the subjects at the frequencies of 500, 1000, 2000, 3000 and 4000 Hz. The results were then compared using statistical technique- es (Internal correlation coefficient, exponential model, ANCOVA, NPC test). Comparison of the audiometric responses showed statistically sig- nificant differences between the three groups. Non-parametric analysis, performed using the NPC test, highlighted that the interaction betwe- en smoking and exposure to noise has an influ- ence on hearing loss at all frequencies, and particularly at high frequencies (3000-4000 Hz). The data obtained from the examined sample show that smoking and exposure to noise cause an increase in occupational hearing loss and that this is directly related to the number of cigarettes smoked. Keywords: Smoking; Hearing Loss; Noise; Audiometric Test; Non Parametric Test 1. INTRODUCTION Hearing loss as a result of exposure to noise is one of the most frequent pathologies found in workers, and is in- fluenced by a number of parameters, such as intensity of the noise, temporal and spectral patterns, duration of the exposure and susceptibility factors. Controlling these parameters may improve the individual response to noise and evolution of the damage. One of the factors influencing hearing susceptibility which has attracted growing interest in recent years is cigarette smoking, although the role of smoking in abet- ting the development of sensory neural hearing loss is controversial, as recent literature shows. Some authors highlight that smokers have a greater risk of hearing loss than non-smokers [1-3], while others find no connection between the onset of sensory neural hearing loss and cigarette smoking [4,5]. Nomura [6] in a review referring to the period 1966-2003 , mentions 9 studies which report a positive association between smo- king and hearing loss, and 6 which reach completely op- posite conclusions. The author, however, concludes by supporting the thesis of a positive association between smoking and hearing loss. Few studies evaluate the effects of the association be- tween smoking, occupational exposure to noise and hea- ring loss. Palmer et al. [7] hypothesises that exposure to noise in smokers aggravates the degree of sensory neural hearing loss, probably due to the effect that these factors have on the vascular system. In fact, both exposure to no- ise and smoking cause vasoconstriction in the cochlear vessels with consequent reduced perfusion, increased pl- asma viscosity and/or possible creation of carboxyhaem- oglobin, which aggravate any local hearing loss. Mizoue et al. [8] observes that the hearing loss affects only the cells responsible for the hearing response to high freque- ncies, since their position at the end of the nutritive ar- teries makes them more vulnerable to ischaemic damage.  Abbate C. et al. / Health 2 (2010) 1163-1169 Copyright © 2010 SciRes. Openly accessible at http://www.scirp.org/journal/HEALTH/ 1164 Dengerink et al. [9], in an experimental study on tempo- rary threshold shifts (TTS) in man, highlights how ciga- rette smoking modifies the response of hearing to noise exposure, and attributes this effect to carbon monoxide (CO) and nicotine. Ferrite et al. (2005) confirm a syner- gic effect between cigarette smoking, exposure to noise and age on hearing loss caused by industrial noise. No- mura [10], in a cross-sectional study, carried out on 397 Japanese workers exposed to noise, finds a positive as- sociation between smoking, exposure to noise and hear- ing loss, even if this is often masked by atherosclerotic factors. Jaruchinda [11] asserts that cigarette smoking influ- ences noise injury in helicopter pilots and aircraft mech- anics. Uclide asserts that the combined effects of noise and smoking is not interactive but additive. Recently, Pouryaghoub [12] concludes that smoking can accelerate noise induced hearing loss, but more research is needed to understand the underlying mechanism Other authors reach opposite conclusions. Pyykko et al. [13] observe that smoking does not affect the incidence of noise-induced hearing loss in 199 forestry workers. Nakashima et al. [14], in a case-control study conducted on 109 subjects, reports that hearing loss is not affected by smoking. Since the interactions between industrial noise, cigar- ette smoking and hearing loss are uncertain, this study aims to clarify the relationship between such variables by trying to evaluate the effects of external factors on he- aring loss. This information is particularly useful when drawing up prevention programs aimed at protecting workers’ hearing. As far as regards smoking, and in the absence of specific studies, the possible effect of the nu- mber of cigarettes smoked per day is also taken into con- sideration. 2. METHODS The study was carried out on male subjects, who had only ever had one job, as shipwrights at a large shipyard for the construction of high-speed boats in southern Italy. The enrolled sample was composed of the entire work- force of 900 men. Noise measurement, performed in November 2003 ac- cording to European directives 89/391/EEC and 86/188/ EEC, showed that all the subjects were exposed to a dai- ly personal exposure level (LEP,d) of 93 ± 2 dBA of eq- uivalent level. The exposure value reported did not disp- lay significant variations compared to the controls prev- iously performed by the company every three years from 1992 onwards, as provided for by Italian legislation re- garding occupational exposure to noise. This lays down that the noise risk in working environments and the LEP, d for each individual worker must be assessed. The subjects enrolled for the study were selected by applying the following exclusion criteria: 1) previous exposure to neurotoxic drugs 2) frequent use of ototoxic drugs 3) metabolism diseases 4) haematological or neurological diseases 5) acute and chronic ear, nose and throat conditions 6) residence since birth in a Council district other than that in which the subject works 7) alcoholism 8) former smokers, those who had been smoking for under 10 years and subjects whose smoking habits had si- gnificantly changed over the years 9) hobbies such as hunting, underwater fishing, frequ- ent visits to discos (> once per week) 10) work experience with other companies 11) length of service < 10 years. All the subjects normally used individual hearing pro- tection devices supplied by the company (earphones and earplugs). The sample thus selected was composed of 557 subj- ects, who were divided into three groups on the basis of their smoking habits. The first was composed of non-sm- okers since birth (Group A), the second (Group B) of smokers (15-30 cigarettes per day for at least 10 years), and the third (Group C) of heavy smokers (over 30 ciga- rettes per day for at least 10 years). People smoke lass than 14 sigarettes a day have not been taken in conside- ration because the data is not significant. The entire sample was given a general medical exam- ination, routine blood tests, otoscopic examination, and a tonal audiometric test after at least 16 hours without ex- posure to occupational noise. For the purposes of tonal audiometric assessment, the study took into consideration hearing threshold values at the frequencies of 500, 1000, 2000, 3000 and 4000 Hz. The study was based on the values recorded by the tonal audiometric traces. Table 1 shows the sample size, average age and years of service of the subjects, by group: Table 1. Sample size of the groups and mean values for age and length of service. GroupSample sizeAge ± σ Length of service ± σ A 215 41.45 ± 7.81 21.36 ± 7.57 B 194 40.77 ± 8.83 20.15 ± 8.34 C 148 40.12 ± 8.77 20.25 ± 8.35 ABC 557 40.98 ± 8.52 20.77 ± 8.15 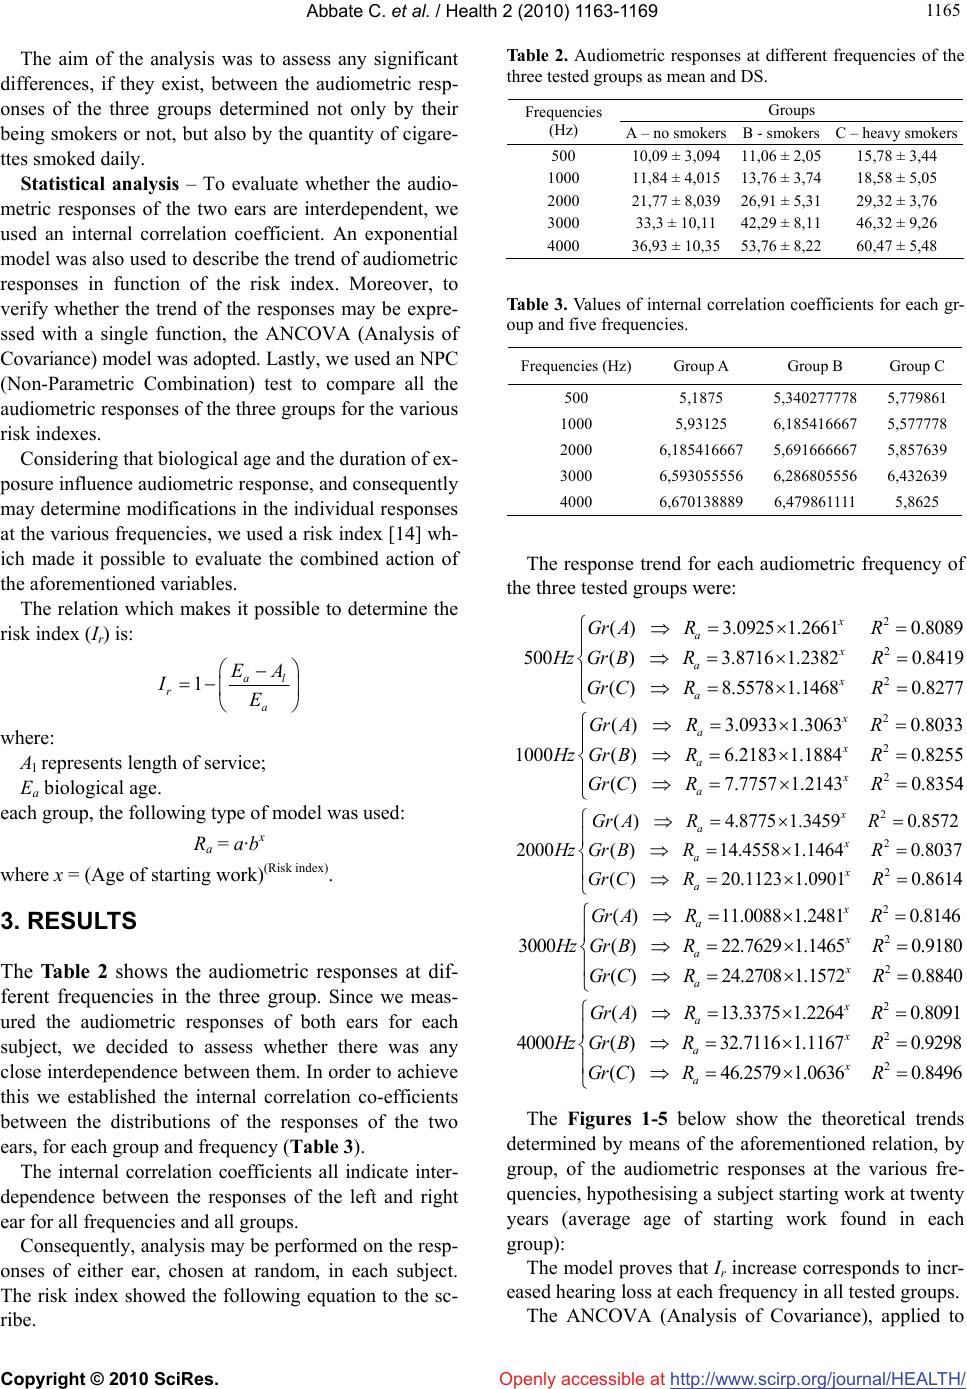 Abbate C. et al. / Health 2 (2010) 1163-1169 Copyright © 2010 SciRes. Openly accessible at http://www.scirp.org/journal/HEALTH/ 116 1165 The aim of the analysis was to assess any significant differences, if they exist, between the audiometric resp- onses of the three groups determined not only by their being smokers or not, but also by the quantity of cigare- ttes smoked daily. Statistical analysis – To evaluate whether the audio- metric responses of the two ears are interdependent, we used an internal correlation coefficient. An exponential model was also used to describe the trend of audiometric responses in function of the risk index. Moreover, to verify whether the trend of the responses may be expre- ssed with a single function, the ANCOVA (Analysis of Covariance) model was adopted. Lastly, we used an NPC (Non-Parametric Combination) test to compare all the audiometric responses of the three groups for the various risk indexes. Considering that biological age and the duration of ex- posure influence audiometric response, and consequently may determine modifications in the individual responses at the various frequencies, we used a risk index [14] wh- ich made it possible to evaluate the combined action of the aforementioned variables. The relation which makes it possible to determine the risk index (Ir) is: 1al r a EA IE where: Al represents length of service; Ea biological age. each group, the following type of model was used: Ra = a·bx where x = (Age of starting work)(Risk index). 3. RESULTS The Table 2 shows the audiometric responses at dif- ferent frequencies in the three group. Since we meas- ured the audiometric responses of both ears for each subject, we decided to assess whether there was any close interdependence between them. In order to achieve this we established the internal correlation co-efficients between the distributions of the responses of the two ears, for each group and frequency (Table 3). The internal correlation coefficients all indicate inter- dependence between the responses of the left and right ear for all frequencies and all groups. Consequently, analysis may be performed on the resp- onses of either ear, chosen at random, in each subject. The risk index showed the following equation to the sc- ribe. Table 2. Audiometric responses at different frequencies of the three tested groups as mean and DS. Groups Frequencies (Hz) A – no smokersB - smokers C – heavy smokers 500 10,09 ± 3,09411,06 ± 2,05 15,78 ± 3,44 1000 11,84 ± 4,01513,76 ± 3,74 18,58 ± 5,05 2000 21,77 ± 8,03926,91 ± 5,31 29,32 ± 3,76 3000 33,3 ± 10,11 42,29 ± 8,11 46,32 ± 9,26 4000 36,93 ± 10,3553,76 ± 8,22 60,47 ± 5,48 Table 3. Values of internal correlation coefficients for each gr- oup and five frequencies. Frequencies (Hz)Group A Group B Group C 500 5,1875 5,340277778 5,779861 1000 5,93125 6,185416667 5,577778 2000 6,185416667 5,691666667 5,857639 3000 6,593055556 6,286805556 6,432639 4000 6,670138889 6,479861111 5,8625 The response trend for each audiometric frequency of the three tested groups were: 2 2 2 ()3.0925 1.26610.8089 500( )3.8716 1.23820.8419 ()8.5578 1.14680.8277 x a x a x a GrA R R HzGrB R R GrC R R 2 2 2 ( )3.09331.30630.8033 1000( )6.2183 1.18840.8255 ()7.7757 1.21430.8354 x a x a x a GrA R R HzGrB R R GrC R R 2 2 2 ( )4.87751.34590.8572 2000( )14.4558 1.14640.8037 ()20.1123 1.09010.8614 x a x a x a GrA R R HzGrB R R GrC R R 2 2 2 ()11.0088 1.24810.8146 3000( )22.7629 1.14650.9180 ()24.2708 1.15720.8840 x a x a x a GrA R R HzGrB R R GrC R R 2 2 2 ()13.3375 1.22640.8091 4000()32.7116 1.11670.9298 ()46.2579 1.06360.8496 x a x a x a GrA R R HzGrB R R GrC R R The Figures 1-5 below show the theoretical trends determined by means of the aforementioned relation, by group, of the audiometric responses at the various fre- quencies, hypothesising a subject starting work at twenty years (average age of starting work found in each group): The model proves that Ir increase corresponds to incr- eased hearing loss at each frequency in all tested groups. The ANCOVA (Analysis of Covariance), applied to 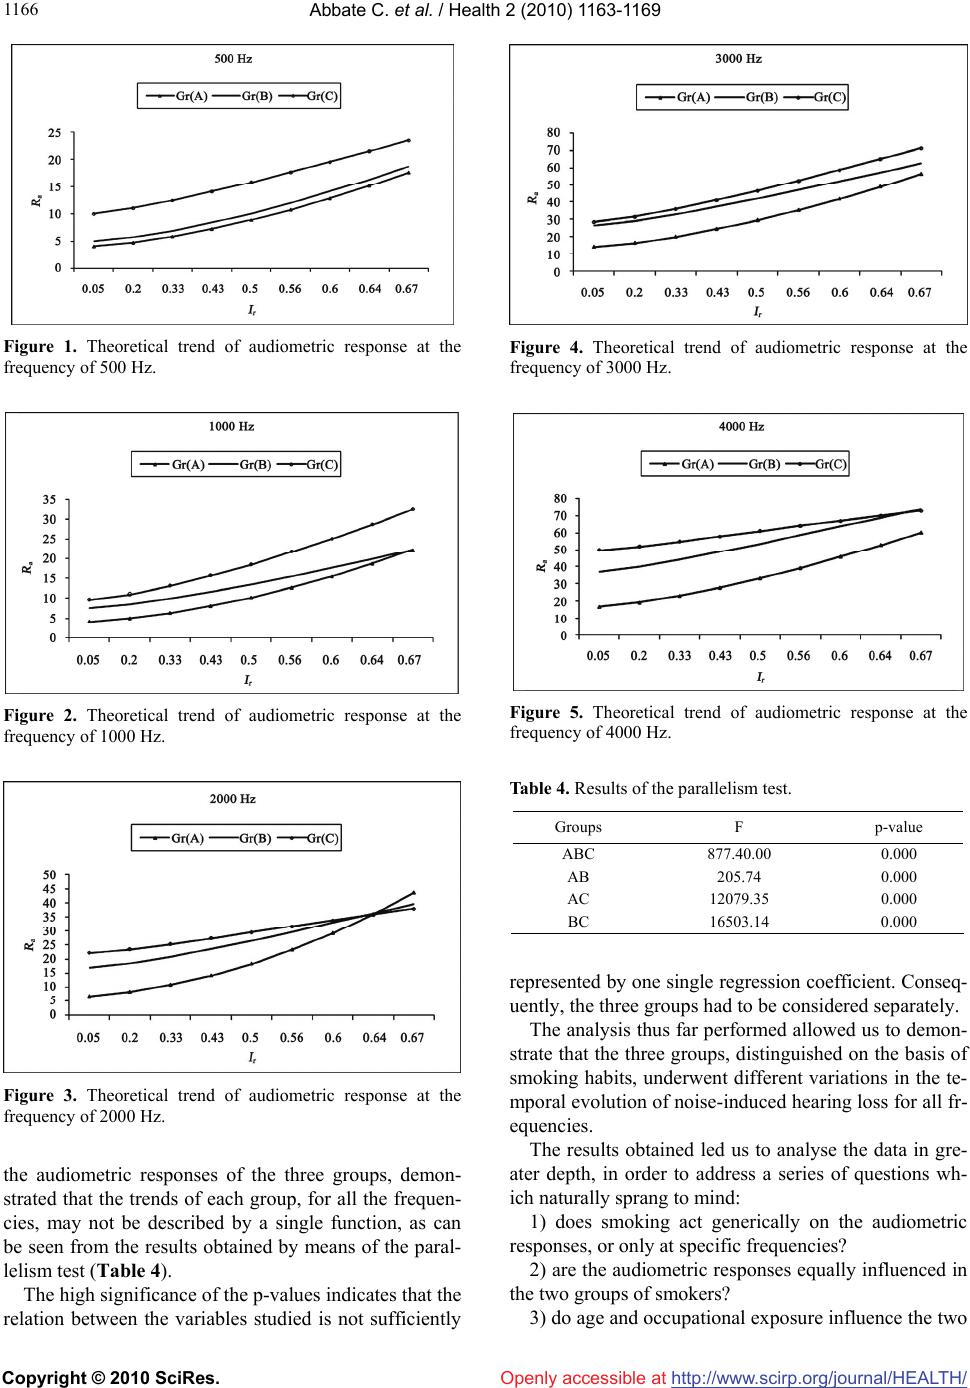 Abbate C. et al. / Health 2 (2010) 1163-1169 Copyright © 2010 SciRes. Openly accessible at http://www.scirp.org/journal/HEALTH/ 1166 Figure 1. Theoretical trend of audiometric response at the frequency of 500 Hz. Figure 2. Theoretical trend of audiometric response at the frequency of 1000 Hz. Figure 3. Theoretical trend of audiometric response at the frequency of 2000 Hz. the audiometric responses of the three groups, demon- strated that the trends of each group, for all the frequen- cies, may not be described by a single function, as can be seen from the results obtained by means of the paral- lelism test (Table 4). The high significance of the p-values indicates that the relation between the variables studied is not sufficiently Figure 4. Theoretical trend of audiometric response at the frequency of 3000 Hz. Figure 5. Theoretical trend of audiometric response at the frequency of 4000 Hz. Table 4. Results of the parallelism test. Groups F p-value ABC 877.40.00 0.000 AB 205.74 0.000 AC 12079.35 0.000 BC 16503.14 0.000 represented by one single regression coefficient. Conseq- uently, the three groups had to be considered separately. The analysis thus far performed allowed us to demon- strate that the three groups, distinguished on the basis of smoking habits, underwent different variations in the te- mporal evolution of noise-induced hearing loss for all fr- equencies. The results obtained led us to analyse the data in gre- ater depth, in order to address a series of questions wh- ich naturally sprang to mind: 1) does smoking act generically on the audiometric responses, or only at specific frequencies? 2) are the audiometric responses equally influenced in the two groups of smokers? 3) do age and occupational exposure influence the two 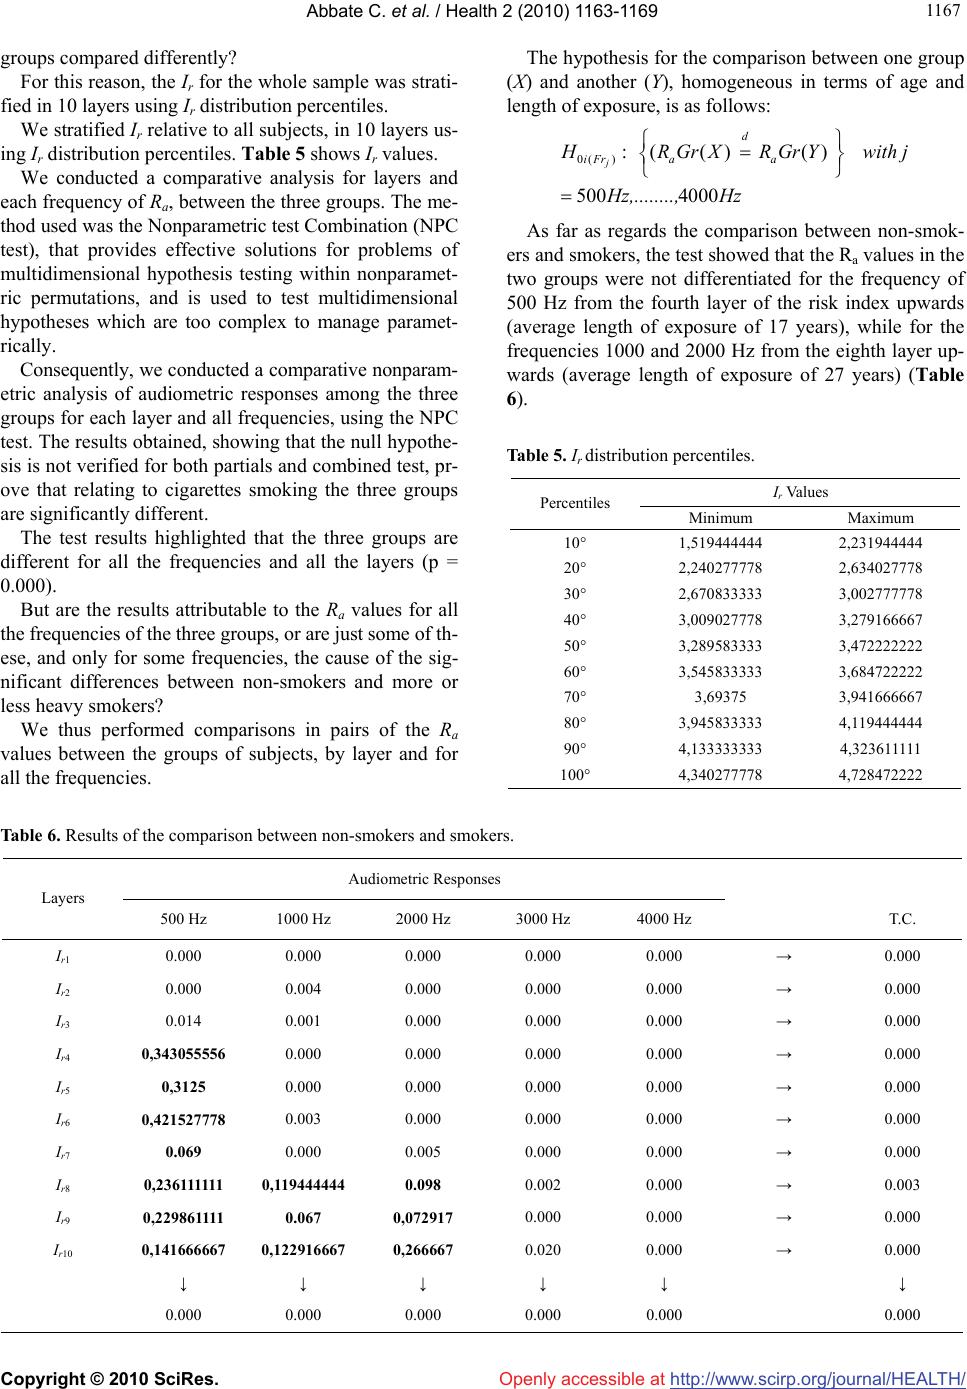 Abbate C. et al. / Health 2 (2010) 1163-1169 Copyright © 2010 SciRes. Openly accessible at http://www.scirp.org/journal/HEALTH/ 116 1167 groups compared differently? For this reason, the Ir for the whole sample was strati- fied in 10 layers using Ir distribution percentiles. We stratified Ir relative to all subjects, in 10 layers us- ing Ir distribution percentiles. Table 5 shows Ir values. We conducted a comparative analysis for layers and each frequency of Ra, between the three groups. The me- thod used was the Nonparametric test Combination (NPC test), that provides effective solutions for problems of multidimensional hypothesis testing within nonparamet- ric permutations, and is used to test multidimensional hypotheses which are too complex to manage paramet- rically. Consequently, we conducted a comparative nonparam- etric analysis of audiometric responses among the three groups for each layer and all frequencies, using the NPC test. The results obtained, showing that the null hypothe- sis is not verified for both partials and combined test, pr- ove that relating to cigarettes smoking the three groups are significantly different. The test results highlighted that the three groups are different for all the frequencies and all the layers (p = 0.000). But are the results attributable to the Ra values for all the frequencies of the three groups, or are just some of th- ese, and only for some frequencies, the cause of the sig- nificant differences between non-smokers and more or less heavy smokers? We thus performed comparisons in pairs of the Ra values between the groups of subjects, by layer and for all the frequencies. The hypothesis for the comparison between one group (X) and another (Y), homogeneous in terms of age and length of exposure, is as follows: 0( ):( ()() 500 4000 j d iFr aa H RGrX RGrY with j Hz,........,Hz As far as regards the comparison between non-smok- ers and smokers, the test showed that the Ra values in the two groups were not differentiated for the frequency of 500 Hz from the fourth layer of the risk index upwards (average length of exposure of 17 years), while for the frequencies 1000 and 2000 Hz from the eighth layer up- wards (average length of exposure of 27 years) (Table 6). Table 5. Ir distribution percentiles. Ir Values Percentiles Minimum Maximum 10° 1,519444444 2,231944444 20° 2,240277778 2,634027778 30° 2,670833333 3,002777778 40° 3,009027778 3,279166667 50° 3,289583333 3,472222222 60° 3,545833333 3,684722222 70° 3,69375 3,941666667 80° 3,945833333 4,119444444 90° 4,133333333 4,323611111 100° 4,340277778 4,728472222 Table 6. Results of the comparison between non-smokers and smokers. Audiometric Responses Layers 500 Hz 1000 Hz 2000 Hz 3000 Hz 4000 Hz T.C. Ir1 0.000 0.000 0.000 0.000 0.000 → 0.000 Ir2 0.000 0.004 0.000 0.000 0.000 → 0.000 Ir3 0.014 0.001 0.000 0.000 0.000 → 0.000 Ir4 0,343055556 0.000 0.000 0.000 0.000 → 0.000 Ir5 0,3125 0.000 0.000 0.000 0.000 → 0.000 Ir6 0,421527778 0.003 0.000 0.000 0.000 → 0.000 Ir7 0.069 0.000 0.005 0.000 0.000 → 0.000 Ir8 0,236111111 0,119444444 0.098 0.002 0.000 → 0.003 Ir9 0,229861111 0.067 0,072917 0.000 0.000 → 0.000 Ir10 0,141666667 0,122916667 0,266667 0.020 0.000 → 0.000 ↓ ↓ ↓ ↓ ↓ ↓ 0.000 0.000 0.000 0.000 0.000 0.000  Abbate C. et al. / Health 2 (2010) 1163-1169 Copyright © 2010 SciRes. Openly accessible at http://www.scirp.org/journal/HEALTH/ 1168 4. DISCUSSION The data obtained from the sample under study demonst- rated that cigarette smoking interferes with the onset and development of hearing loss caused by industrial noise. The results of the statistical study applied to the audio- metric responses displayed statistically significant differ- ences between non-smokers, smokers and heavy smok- ers. This demonstrates that smoking has an influence on noise-induced hearing loss and that this effect is corre- lated to the quantity of cigarettes smoked daily. The theoretical model applied for each frequency on the distribution trend of the values of Ra highlighted that, with increased age and length of service, the audiometric responses for all frequencies increase in all three groups, albeit in a differentiated manner. Furthermore, the ANCOVA(Analysis of Covariance) results show that the trends of the Ra values for the three groups may not be described using a model with the sa- me parameters. The results of the non-parametric analysis demonstr- ated that the three groups examined are differentiated, in relation to the audiometric responses for all the frequen- cies and for each layer. In particular it was found that the risk factor influen- ces all frequencies, and especially those at the higher end of the spectrum. These observations are in accordance with the findings of Mizoue et al. [8] who, in a study on 4624 steel work- ers exposed to noise, highlighted an increase in noise- induced damage mainly at high frequencies, in relation to the quantity of cigarettes smoked. Our result agree with Wild’s ones [15] that showed noise-inducted hypoacusis increase at 3000-4000 Hz, in a group of long time smokers compared with no smokers with similar occupational history. Our data show effects at low frequencies, not found by Mizoue et al. [8], and this observation is due to the dif- ferent sensitivity of the statistical techniques used, and in particular in the use of the NPC test. Regarding the comparison between smokers and hea- vy smokers, the statistical study, which highlighted sign- ificantly different behaviour for all the frequencies, con- firmed, as reported by the studies of Nakanishi et al. [16] and Mizoue et al. [8], that the effects of cigarette smok- ing have an effect on noise-induced hearing loss which depends on the quantity of cigarettes smoked per day. The pathogenetic mechanisms involved may be identi- fied as: 1) the ototoxic effect performed by nicotine, which stimulates the nicotine receptors of the acoustic cells as described by Evans [17] and by Blachet et al. [18]. 2) the mechanisms correlated to ischaemic damage caused by decreased blood flow. In fact, the physiopath- ology of hearing loss involves a reduction in cochlear blood flow and gaseous exchange, and contemporaneous increased levels of circulating CO caused by chronic ex- posure to cigarette smoking further reduces the quantity of oxygen to the cochlear cells, thus contributing to sen- sory neural damage. This hypothesis, suggested by Mat- schke [19] in acute noise-induced damage, was subse- quently confirmed by the studies of Fechter et al. [20-22], Rao et al. [23] and Shahbaz Hassan et al. [24] for chro- nic noise-induced damage. Rao et al. [23], in an experi- mental study, highlighted that the simultaneous exposure to noise and CO increases noise-induced hearing loss. Fechter et al. [22], in an experimental study on labora- tory animals, demonstrates that CO increases noise-in- duced hearing loss. Shahbaz Hassan et al. [24] reaches the same conclusions, claiming that CO increases noise- induced hearing loss. 5. CONCLUSIONS Our data confirm the aforementioned hypotheses also in conditions of chronic exposure. In conclusion, the observations deriving from the study show that cigarette smoking acts in synergy with exposure to industrial noise on hearing loss, and that this effect is correlated to the amount of cigarettes smoked. Thus, we feel it is necessary to encourage workers occ- upationally exposed to high levels of noise to limit ciga- rette smoking. REFERENCES [1] Cruickshanks, K.J., Klein, R., Klein, B.E., Wiley, T.L., Nondahl, D.M. and Tweed, T.S. (1998) Cigarette smok- ing and hearing loss: The epidemiology of hearing loss study. Journal of the American Medical Association, 279(21), 1715-1719. [2] Starck, J., Toppila, E. and Pyykko, I. (1999) Smoking as a risk factor in sensory neural hearing loss among work- ers exposed to occupational noise. Acta Otolaryngology, 119(3), 302-305. [3] Itoh, A., Nakashima, T., Arao, H., Wakai, K., Tamokoshi, A., Kawamura, T. and Ohno, Y. (2001) Smoking and drinking habits as risk factors for hearing loss in the eld- erly: Epidemiological study of subjects undergoing rou- tine health checks. Aichi Japan Public Health, 115(3), 192-196. [4] Linke, R. and Matschke, R.G. (1998) Is there a corre- lation between sudden deafness and smoking? Laryngor- hinootologie, 77(1), 48-51. [5] Sharabi, Y., Reshef-Haran, I., Burstein, M. and Eldav, A. (2002) Cigarette smoking and hearing loss: Lessons from the young adult periodic examinations in Israel (YAPEIS) database. Israel Medical Association Journal, 4(12),  Abbate C. et al. / Health 2 (2010) 1163-1169 Copyright © 2010 SciRes. Openly accessible at http://www.scirp.org/journal/HEALTH/ 116 1169 1118-1120. [6] Nomura, K., Nakao, M. and Morimoto, T. (2005) Effect of smoking on hearing loss: Quality assessment and meta-analysis. Preventive Medicine, 40(2), 138-144. [7] Palmer, K.T., Griffin, M.J., Syddall, H.E. and Coggon, D. (2004) Cigarette smoking, occupational exposure to noise, and self reported hearing difficulties. Occupational and Environmental Medicine, 61(3), 340-344. [8] Mizoue, T., Miyamoto, T. and Shimizu, T. (2003) Com- bined effect of smoking and occupational exposure to noise on hearing loss in steel factory workers. Occupa- tional and Environmental Medicine, 60(1), 56-59. [9] Dengerink, H.A., Lindgren, F.L. and Axelsson, A. (1992) The interaction of smoking and noise on temporary threshold shifts. Acta Otolaryngology, 112(6), 932-938. [10] Nomura, K., Nakao, M. and Yano, E. (2005) Hearing loss associated with smoking and occupational noise exposure in a Japanese metal working company. International Ar- chives of Occupational and Environmental Health, 78(3), 178-184. [11] Jaruchinda, P., Thongdeetae, T., Panichkul, S. and Han- chumpol, P. (2005) Prevalence and analysis of noise in- duced hearing loss in army helicopter pilots and aircraft mechanisms. Journal of the Medical Association of Thai- land, 88(Suppl. 3), 232-239. [12] Pouryaghoub, G., Mehrdad, R. and Mohammadi, S. (2007) Interaction of smoking and occupational noise exposure on hearing loss: A cross-sectional study. BMC Public Health, 7, 137-143. [13] Pyykko, I., Koskimies, K., Starck, J., Pekkarinen, J., Farkkila, M. and Inaba, R. (1989) Risk factors in the genesis of sensory neural hearing loss in Finnish forestry workers. British Journal of Industrial Medicine, 46(7), 439-446. [14] Nakashima, T., Tanabe, T., Yanagiha, N., Wakai, K. and Ohno, Y. (1997) Risk factors for sudden deafness: A case control study. The International Journal Auris Nasus Larynx, 24(4), 265-270. [15] Wild, D.C., Brewster, M.J. and Banerjee, A.R. (2005) Noise induced hearing loss in exacerbated by long-term smoking. Clinical Otolaryngology, 30(6), 517-520. [16] Nakanishi, N., Okamoto, M., Nakamura, K., et al. (2000) Cigarette smoking and risk for hearing impairment: A longitudinal study in Japanese male office workers. Oc- cupational and Environmental Medicine, 42(11), 1045- 1049. [17] Evans MG (1996) Acetylcholine activates two currents in guinea-pig outer hair cells. Journal of Physiology, 1(491), 563-578. [18] Blachet, C., Erostegui, C., Sugasawa, M. and Dulon, D. (1996) Acetylcholine-induced potassium current of guin- ea pig outer hair cells: Its dependence on a calcium influx through nicotinic-like rereptors. Neurosciences, 16(8), 2574-2584. [19] Matschke, R.G. (1990) Smoking habits in patients with sudden hearing loss. Preliminary results. Acta Otolaryn- gology, 476(Suppl.), 69-73. [20] Fechter, L.D., Chen, G.D., Rao, D., et al. (2000) Predict- ing exposure conditions that facilitate the potentietion of noise – induced hearing loss by carbon monoxide. Toxi- cology Sciences, 58(2), 315-323. [21] Fechter, L.D., Chen, G.D. and Rao, D. (2002) Chemical asphyxiants and noise. Noise Health, 4(14), 49-61. [22] Fechter, L.D., Cheng, G.D. and Rao, D. (2003) Charac- terising conditions that favour potentiation of noise in- duced hearing loss by chemical asphyxiants. Noise Health, 3(9), 11-21. [23] Rao, D.B. and Fechter, L.D. (2000) Increased noise se- verity limits potentiation of noise induced hearing loss by carbon monoxide. Hearing Research, 150(1-2), 206-214. [24] Shahbaz Hassan, M., Ray, J. and Wilson, F. (2003) Car- bon monoxide poisoning and sensorineural hearing loss. Journal of Laryngology & Otology, 117(2), 134-137. |