Paper Menu >>
Journal Menu >>
 Vol.2, No.10, 1142-1149 (2010) Health doi:10.4236/health.2010.210167 Copyright © 2010 SciRes. Openly accessible at http://www.scirp.org/journal/HEALTH/ Physical activity, weight status and diet in adolescents: are children meeting the guidelines? Spencer E. Boyle, Georgina L. Jones, Stephen J. Walters* Medical Statistics Group, School of Health and Related Research, University of Sheffield, Sheffield, UK; *Corresponding Author: s.j.walters@sheffield.ac.uk Received 20 May 2010; revised 1 June 2010; accepted 10 June 2010. ABSTRACT Childhood obesity is on the increase and main- taining regular physical activity and consuming a healthy diet have become essential tools to combat the condition. The United Kingdom go- vernment has recommended guidelines for op- timal levels of diet and activity in children. The aim of this paper is to describe and compare self-reported physical activity levels, diet, and Body Mass Indices (BMI) amongst adolescent children, aged 11-15, in the South West (SW) and North West (NW) regions of England and to see if these children were meeting the current targets for optimal levels of: physical activity; fruit/vegetable consumption; fat consumption and BMI. We report the results of a cross-sec- tional survey of four secondary schools and 1,869 children using the self-reported Western Australian Child and Adolescent Physical Activ- ity and Nutrition Survey (CAPANS) physical ac- tivity instrument and a food intake screener qu- estionnaire, in summer and winter. We found that 25% (469/1869) 95% CI: 23% to 27%, of chil- dren engaged in 60 minutes of moderate to vi- gorous physical activity per day; 53% (995/1866) 95% CI: 51% to 56%, took 5 portions of fruit and vegetables per day; while 22% (407/1861) 95% CI: 20% to 24% consumed recommended amount of fats, and 23.7% (276/1164) 95% CI: 21% to 26%, of pupils were obese or overweight as classified by their BMI. Self reported physical activity in young people regardless of area is lower than previously reported and the lack of students engaging in 60 minutes moderate to vigorous activity could have serious public health con- sequences. If sustained, this could lead to more overweight adults, and more ill health. Keywords: Physical Activity; Diet; Exercise; Adolescents; Guidelines 1. INTRODUCTION There is considerable evidence that adult health varies ac- cording to the region in England in which they live [1-5]. Life expectancy throughout England differs markedly between regions [6]. The health consequences of being overweight or obese in adulthood are now well establish- ed [7]. A systematic review of the short and long-term of consequences of childhood obesity reported short term clinical effects of obesity on children such as increased incidence of asthma and diabetes but also long term con- sequences of increased risk of cardiovascular disease into adulthood [8]. Childhood obesity is now becoming more prevalent: the latest figures for England, in 2006, show 23.7% of 11-15 year old males and 26.2% females are now classed as obese [9]. Taking regular exercise and maintaining a healthy weight through diet are thought to be essential factors in combating this trend [10]. The United Kingdom (UK) government has recognis- ed the public health consequences for the rising trend in obesity in the population and has set targets for healthy Body Mass Index (BMI), physical activity and diet in children [11]. The current guidelines recommend 60 minutes of moderate to vigorous activity per day [11]. However, the number of secondary school children ach- ieving this level of activity of varies from 41% (ages 11 to 15) [12] to 80% (age 11) [13]. Dietary guidelines also recommend the consumption of at least five portions of a variety of fruit and vegetables per day and that less than 35% of daily dietary calorific intake should be made up of fats [14]. Fat intake in a national diet survey [15], in young people age 4-18 years, was 36.9%, around the re- commend level but fruit and vegetable consumption was mixed. However, another later health survey [13] show- ed that only 13% of children aged 5-15 years had eaten the recommended five or more portions of fruit and ve- getables in the previous day.  S. E. Boyle et al. / Health 2 (2010) 1142-1149 Copyright © 2010 SciRes. Openly accessible at http://www.scirp.org/journal/HEALTH/ 114 1143 This cross sectional self report survey aimed to des- cribe and compare self-reported physical activity levels, diet, weight and height amongst adolescent children, aged 11-15, in the South West (SW) and North West (NW) regions of England and to see if these children were meeting the current targets for optimal levels of: physical activity; fruit/vegetable consumption; fat con- sumption and BMI. 2. METHODS 2.1. Design and Setting Four comprehensive secondary schools were matched according to characteristics described in Office for Stan- dards in Education (Ofsted) reports; two were in the northwest of England, two in the southwest. The schools were selected on the basis of a close match in: examina- tion results, percentage of children on free school meals (FSM), and percentage of children with special educa- tional needs (SEN). Questionnaires were completed in class in the presence of a teacher and the same question- nnaires were completed twice, once in the summer term and once in the winter term. University of Sheffield research ethics committee ap- proval was obtained for this study and the Local Educa- tion Authority was consulted in order to gain initial con- tact with the secondary schools involved. Consultation with the heads of the secondary schools followed this. In- itially the study details were circulated in a school new- spaper, which every parent receives, at each school. Af- ter this process the whole school populations were given an information letter to take home with a consent slip to be returned by a parent or guardian. As children were of secondary school age it was thought they could sign consent to fill out a survey on the day of the study, if a parental slip had not been returned [16]. 2.2. Participants Two thousand eight hundred and fifty-eight pupils aged 11-15 in four secondary schools in England (2 in the NW) and 2 in the SW) region) were sent a letter with consent slip attached explaining the survey study and in- vited to participate in an anonymous survey on two oc- casions (summer and winter). Thirty percent (869/2858) of children responded to the winter survey and had valid self-reported physical activity data, and 35% (1000/2858) responded to the summer survey, an overall response rate of 33% (1869/5716) (see Table 1). As this was an anonymous survey no information was collected on the characteristics of the non-respondents to the question- naire, therefore a comparison of respondents to non-re- spondents cannot be made. We also have no information on how many children completed the survey in both wi- nter and summer. 2.3. Measures Self-reported demographic information was collected from the pupils such as age, sex, ethnicity, entitlement to free school meals, height and weight. Table 1. Survey response rates and school characteristics. School 1 2 3 4 Totals Number of children role 1198 923 922 671 3714 GSCE Examination Results (2004) % five or more passes with grades A to C 43% 52% 42% 51% National Average = 54.5% Key stage 3 assessment results (2004) (average point score) 32.8 32.5 31.9 33.9 England Average Point Score = 34.1 Percentage of SEN pupils on statement (2005) Percentage, with SEN but not on statement 1.8% 25.1% 2.1% 27.1% 7.1% 5.9% 3.4% 16.7% National Average SEN with Statement = 2.9% without statement = 14.9% 1st wave: winter 2006 No. of children sent letters 965 744 567 582 2858 Questionnaires returned 438 343 213 64 1058 Incomplete questionnaires 81 83 25 0 189 Responders 357 260 188 64 869 1st wave overall response rate 357/965 (37%) 260/744 (35%) 188/567 (33%) 64/582 (11%) 869/2858 (30%) 2nd wave: summer 2007 No. of children sent letters 965 744 567 582 2858 Questionnaires returned 543 261 225 279 1308 Incomplete questionnaires 118 84 53 53 308 Responders 425 177 172 226 1000 2nd wave overall response rate 425/965 (44%) 177/744 (24%) 172/567 (30%) 226/582 (39%) 1000/2858 (35%) SEN (Special Educational Need); GCSE (General Certificate of Secondary Education Examination)  S. E. Boyle et al. / Health 2 (2010) 1142-1149 Copyright © 2010 SciRes. Openly accessible at http://www.scirp.org/journal/HEALTH/ 1144 2.4. Physical Activity The self-completed Western Australian Child and Ado- lescent Physical Activity and Nutrition Survey (CAPA- NS) questionnaire was used to assess physical activity [17]. The CAPANS consists of 24 questions and was first successfully used in a sample of 2274 children aged 7 to 16 years in 2003 [18]. The CAPANS asks children to select the type of physical activity (from a compre- hensive list of activities) they usually do in a typical week; and then to record the number of times they did the activity and the time spent on that activity. The total time spent on physical activity per week was calculated by totalling the time children spent in moderate or vig- orous activity per day and then dividing this figure by seven to give an average for the week. The UK govern- ment recommends children are physically active at a moderate intensity for 60 minutes per day [11]. There- fore the physical activity data was further classified into whether or not children were meeting these recommen- dations or not. 2.5. Diet The Block food intake screener was used to assess diet and the intake of fat, fibre, fruit and vegetables [19]. The responses to the screener can then be used to estimate the amount of fat and fruit and vegetables a child is co- nsuming in their diet. Fat and fruit intake for each child was then further classified as achieving the optimal co- nsumption of fats (< 35% of calories consumed per day) or fruit and vegetable (at least 5 portions per day) or not. 2.6. Body Mass Index (BMI) The pupils estimated their own height and weight which was then used to calculate each child’s BMI. UK spe- cific BMI reference values and cut-points were then used to classify each child as having normal weight or being overweight or obese [20]. 2.7. Statistical Analysis Continuous outcomes such as minutes of vigorous activ- ity per day were compared between areas using a two in- dependent samples t-test. Binary outcomes e.g. achiev- ing 60 minutes of physical activity per day, yes or no, were compared between areas using a chi-squared test. Multiple linear regression (for continuous outcomes) and multiple logistic regression (for binary outcomes) was used to adjust the area effect for the potential confound- ing variables of ethnicity (white vs. none-white), sex (boy or girl) and age (years) which were known to be associated with physical activity [12,21,22]. Also ad- justed for was receipt of free school meals (yes or no) as a proxy measure for deprivation. The multiple regression analyses also adjusted for potential clustering of pupils’ outcomes within the schools by calculating robust stan- dard errors with the cluster option in STATA v11 [23]. This was an anonymous survey and we have no informa- tion about whether or not the children completed the survey twice in both winter and summer. Therefore the majority of the statistical analyses were performed and reported separately by season. A P-value of less than 0.05 was regarded as statistically significant. 3. RESULTS Table 1 shows the overall response rate to the survey was 33% (1869/5716). The demographic characteristics of the respondents, in both summer and winter samples, can be seen in Table 2. There was some evidence of statisti- cally significant differences in the social demographic characteristics of the pupils between the two areas. Table 3 shows that the proportions of children ach- ieving the UK recommended guidelines of 60 minutes moderate to vigorous physical activity per day, was hig- her in summer compared to winter, 32.2% (322/1000) vs. 16.9% (147/869). There was no evidence of a difference in proportions achieving the recommendations between areas in summer or winter (with and without adjustment for covariates, such as sex, age, ethnicity and receipt of free school meals). Overall only 25% (469/1869), 95% CI: 23% to 27%, of children met the target of 60 minutes moderate to vigorous physical activity per day. Similar findings were observed for the continuous outcome of minutes of moderate to vigorous physical activity per day. Children were observed (see Table 4) to be under- taking more physical activity in summer than in winter, but there was no statistical evidence of a difference be- tween areas in summer or winter (with and without ad- justment for covariates). Children in the SW were ob- served to be undertaking less sedentary behaviour per day than children in the NW, both in summer and winter (Table 4), although only in summer was this difference statistically significant (P = 0.003) and this difference was not statistically significant after adjustment for co- variates. Optimal fruit and vegetable consumption, of five or more portions per day, was higher in summer than win- ter, 57% (566/1000) vs. 50% (429/866), see Table 3. There was no evidence of a difference in consumption between areas in winter (with and without adjustment for covariates). However there was some evidence of a dif- ference between areas in the summer, with the odds of children in the SW having optimal fruit consumption being 1.8 (95% CI: 1.38 to 2.32, P < 0.001) times that of the odds of children in NW, but this difference was not statistically significant after adjustment for covariates. 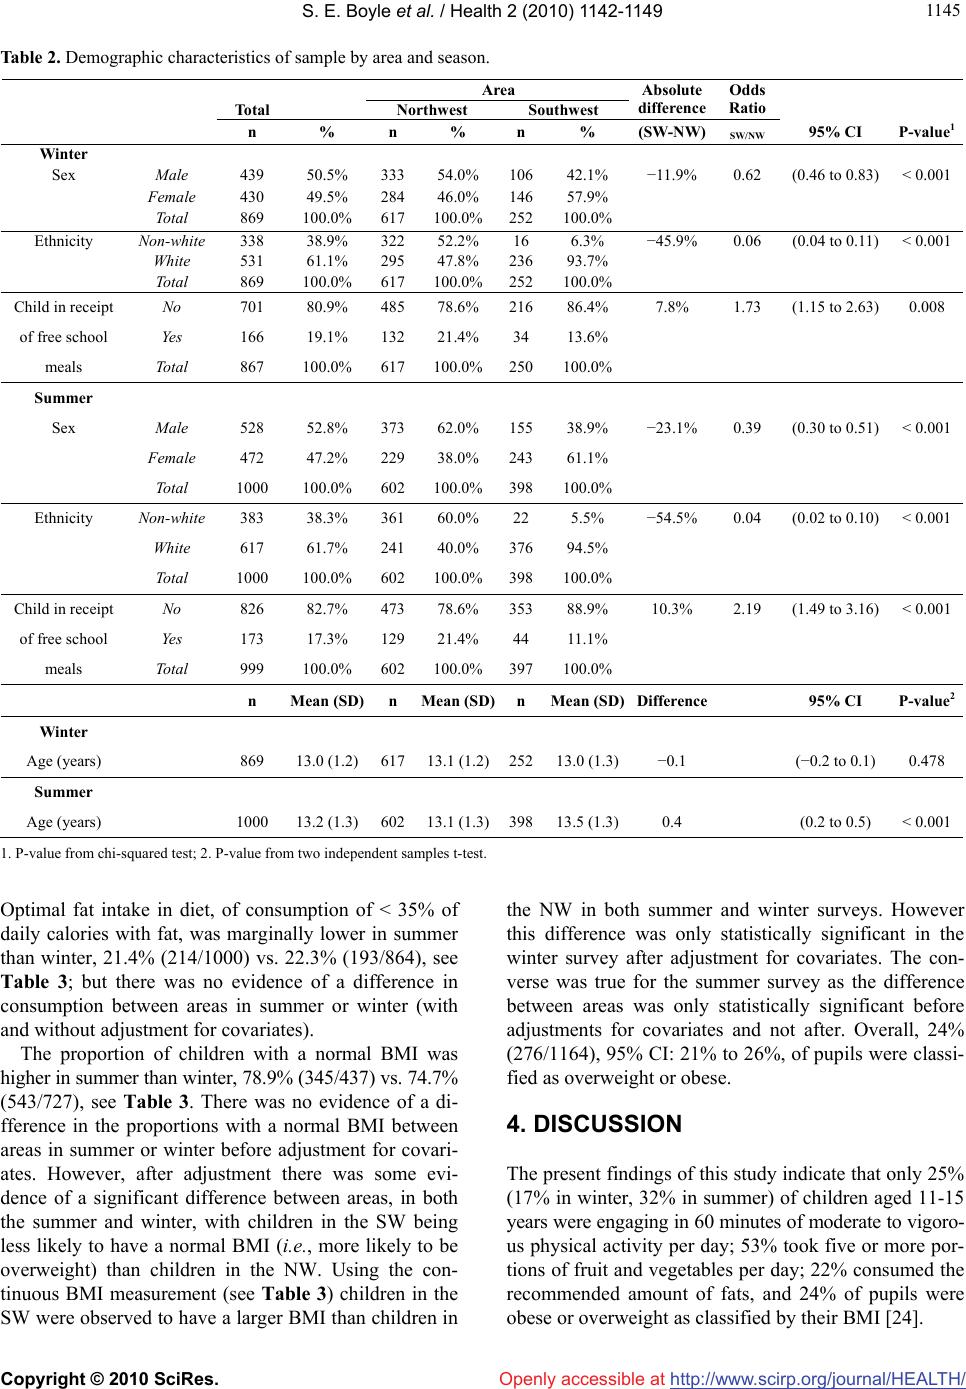 S. E. Boyle et al. / Health 2 (2010) 1142-1149 Copyright © 2010 SciRes. Openly accessible at http://www.scirp.org/journal/HEALTH/ 114 1145 Table 2. Demographic characteristics of sample by area and season. Area Total Northwest Southwest Absolute difference Odds Ratio n % n % n % (SW-NW)SW/NW 95% CI P-value1 Winter Sex Male 439 50.5% 33354.0% 10642.1% −11.9% 0.62 (0.46 to 0.83)< 0.001 Female 430 49.5% 28446.0% 14657.9% Total 869 100.0% 617100.0%252100.0% Ethnicity Non-white 338 38.9% 32252.2% 16 6.3% −45.9% 0.06 (0.04 to 0.11)< 0.001 White 531 61.1% 29547.8% 23693.7% Total 869 100.0% 617100.0%252100.0% Child in receipt No 701 80.9% 48578.6% 21686.4% 7.8% 1.73 (1.15 to 2.63)0.008 of free school Yes 166 19.1% 13221.4% 34 13.6% meals Total 867 100.0% 617100.0%250100.0% Summer Sex Male 528 52.8% 37362.0% 15538.9% −23.1% 0.39 (0.30 to 0.51)< 0.001 Female 472 47.2% 22938.0% 24361.1% Total 1000 100.0% 602100.0%398100.0% Ethnicity Non-white 383 38.3% 36160.0% 22 5.5% −54.5% 0.04 (0.02 to 0.10)< 0.001 White 617 61.7% 24140.0% 37694.5% Total 1000 100.0% 602100.0%398100.0% Child in receipt No 826 82.7% 47378.6% 35388.9% 10.3% 2.19 (1.49 to 3.16)< 0.001 of free school Yes 173 17.3% 12921.4% 44 11.1% meals Total 999 100.0% 602100.0%397100.0% n Mean (SD) n Mean (SD)n Mean (SD)Difference 95% CI P-value2 Winter Age (years) 869 13.0 (1.2) 61713.1 (1.2)25213.0 (1.3)−0.1 (−0.2 to 0.1)0.478 Summer Age (years) 1000 13.2 (1.3) 60213.1 (1.3)39813.5 (1.3)0.4 (0.2 to 0.5) < 0.001 1. P-value from chi-squared test; 2. P-value from two independent samples t-test. Optimal fat intake in diet, of consumption of < 35% of daily calories with fat, was marginally lower in summer than winter, 21.4% (214/1000) vs. 22.3% (193/864), see Table 3; but there was no evidence of a difference in consumption between areas in summer or winter (with and without adjustment for covariates). The proportion of children with a normal BMI was higher in summer than winter, 78.9% (345/437) vs. 74.7% (543/727), see Table 3. There was no evidence of a di- fference in the proportions with a normal BMI between areas in summer or winter before adjustment for covari- ates. However, after adjustment there was some evi- dence of a significant difference between areas, in both the summer and winter, with children in the SW being less likely to have a normal BMI (i.e., more likely to be overweight) than children in the NW. Using the con- tinuous BMI measurement (see Table 3) children in the SW were observed to have a larger BMI than children in the NW in both summer and winter surveys. However this difference was only statistically significant in the winter survey after adjustment for covariates. The con- verse was true for the summer survey as the difference between areas was only statistically significant before adjustments for covariates and not after. Overall, 24% (276/1164), 95% CI: 21% to 26%, of pupils were classi- fied as overweight or obese. 4. DISCUSSION The present findings of this study indicate that only 25% (17% in winter, 32% in summer) of children aged 11-15 years were engaging in 60 minutes of moderate to vigoro- us physical activity per day; 53% took five or more por- tions of fruit and vegetables per day; 22% consumed the recommended amount of fats, and 24% of pupils were obese or overweight as classified by their BMI [24]. 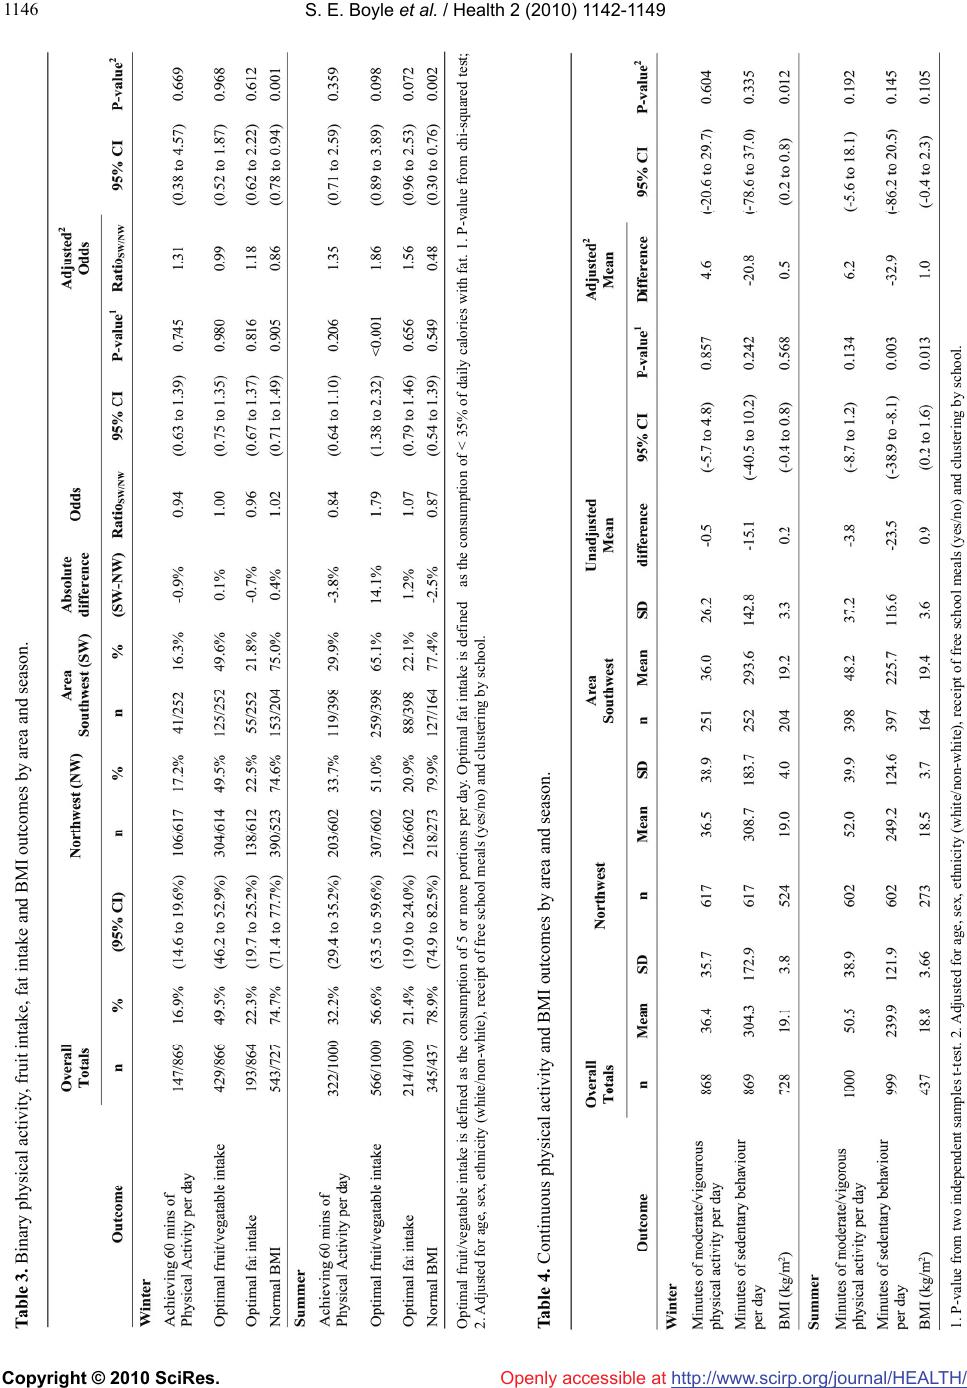 S. E. Boyle et al. / Health 2 (2010) 1142-1149 Copyright © 2010 SciRes. Openly accessible at http://www.scirp.org/journal/HEALTH/ 1146 Table 3. Binary physical activity, fruit intake, fat intake and BMI outcomes by area and season. 1. P-value from two independent samples t-test. 2. Adjusted for age, sex, ethnicity (white/non-white), receipt of free school meals (yes/no) and clustering by school. Optimal fruit/vegatable intake is defined as the consumption of 5 or more portions per day. Optimal fat intake is defined as the consumption of < 35% of daily calories with fat. 1. P-value from chi-squared test; 2. Adjusted for age, sex, ethnicity (white/non-white), receipt of free school meals (yes/no) and clustering by school. Table 4. Continuous physical activity and BMI outcomes by area and season.  S. E. Boyle et al. / Health 2 (2010) 1142-1149 Copyright © 2010 SciRes. Openly accessible at http://www.scirp.org/journal/HEALTH/ 114 1147 The physical activity results from the present study are lower than two previous studies. An international World Health Organisation [25] study reported that 45% of 11 year olds and 38% of 15 year olds were achieving the recommend levels of physical activity. More recently a British Heart Foundation [12] survey reported that 41% of 11-15 year olds were meeting the physical activ- ity target. Our current data also revealed that the mean time spent in moderate to vigorous activity by these children was 44 minutes per day which looks very low when compared to the mean amount of time spent in se- dentary behaviour (270 minutes per day). These seden- tary figures are particularly worrying as physical inactiv- ity was thought to contribute to almost two million worldwide deaths [26]. If there is a tendency in self-re- port surveys to over-estimate physical activity then the figures reported in this study could well be an over esti- mate of the true activity levels [27]. In these circum- stances this could be a worrying indicator for activity levels. Since the early 1990’s [14] the UK Government has encouraged the consumption of at least five portions of fruit and vegetables per day and a total fat intake of less than < 35% of calories consumed. The intake of fruit and vegetables has been particularly promoted amongst yo- ung children with free fruit schemes in UK schools [28]. Consumption of at least 5 portions in the present study was around 53% (50% in winter, 57% in summer) this was much higher than the 13% of children consuming the recommended in the national health survey [15]. Intake of fats in the data also uncovered that only around one in four (22%) of the children were taking in the recom- mended amount of fats in their diets, i.e., less than 35% of calories consumed, indicating an over eating of fatty foods. On an epidemiological basis for young people to be considered overweight they would need to have a BMI greater than or equal to the 85th percentile or to be obese it would need to be greater than or equal to the 95th per- centile according to UK reference curves [20]. The mean age of the participants in this study was 13.2 years, th- erefore this would equate to a BMI score of overweight for boys 20.65 kg/m2 and girls 21.74 kg/m2 [20]. The ch- ildren in this study were found to have a mean self-rep- orted BMI of 19.7 kg/m2, and 76% (888/1164) had a ‘no- rmal’ BMI. If children were underreporting their weight, and/or over reporting their height, then this would result in a lower BMI. However, this study’s estimate of 24% (25% in winter and 21% in summer) of children being overweight or obese compares favourably with other re- cent surveys [9]. The study has several strengths and limitations. We had a large sample of over 1,800 children self-reporting diet and physical activity. We believe that the particip- ants in this study represented an ethnically diverse cross section of the secondary school population that is bro- adly similar to many comprehensive secondary schools in England. The data was collected over the same period of time in all schools which should account for any dif- ferences in activity due to holiday periods or seasonality. The generalisability of this study, to other schools and areas in England, is likely to have been affected by the low response rate of 33% (1869/5716). This study invol- ved only four schools in two regions, and is not a rand- om sample of pupils or schools, so therefore the results must be interpreted cautiously and cannot be wholly re- presentative of other schools in the NW and SW or ind- eed England. The low response rate may have poten- tially caused a bias in the estimated differences in outco- mes between the various groups. Unfortunately as this was an anonymous survey no information was collected on the characteristics of the non-respondents to the ques- tionnaire, therefore a comparison of respondents to non- respondents cannot be made. Also since this was an an- onymous survey we have no information on how many children completed the survey twice both in the winter and summer. So we cannot rule out that some bias may have been introduced into the sample. However, 23.5% of our survey participants were classified as obese which is similar to previous estimates for English school chil- dren aged 11-15 of 21%; although only 25% of our sam- ple met the physical activity guidelines compared to around 52% reported nationally [25]. Our sample ap- peared to have similar levels for receipt of free school meals (18% vs. 16.5%) compared to school roll informa- tion. We believe that the responders, to our survey, are mo- re likely to be a well motivated group of students, who are more likely to report higher levels of physical activ- ity and better levels of diet and lower levels of BMI (due to overestimating their height and underestimating their weight). If this is so then our estimates are potentially likely to be larger than the true values as we have a self- selected sample of students who eat and exercise well. The cross-sectional design is less robust than a longi- tudinal study. So it must be clearly acknowledged that the data represents merely a snap shot of information on physical activity and diet. The diet questionnaire alth- ough validated and piloted by the authors has mainly been used in an adult non-UK population, which again may have an effect. Pragmatically, we used self report methods rather than objective measures such as pedometers or accelerome- ters to estimate physical activity. This may have resulted  S. E. Boyle et al. / Health 2 (2010) 1142-1149 Copyright © 2010 SciRes. Openly accessible at http://www.scirp.org/journal/HEALTH/ 1148 in an overestimate of activity particularly if this was a well motivated group of students. However, the use of objective measures, such as pedometers, is not without problems as the use of these tools tends to alter the be- haviour of people being observed and again may result in an over estimate of activity. In general, the potential ‘bias’ of self-reporting survey methods for diet or PA is of concern to any researcher and the over-reporting in activity or under-reporting fat intake maybe a particular worry in studies of children [29]. However, in previous studies of children and PA the self-report survey shows some promise of being a quality research instrument with a young population [27] and remains the most widely used measurement tool [30]. For practical reasons (since we had a large sample) we used the self-reported CAPANS instrument to assess PA, which has been shown to be reliable and valid measure in children [17]. In several studies self-reported BMI in children has shown that students tend to underestimate their BMI. Those students who are overweight or obese tend to underestimate their BMI to a greater extent than normal weight students. However, further studies have found that differences between self-reported and meas- ured height and weight in young people were not statis- tically significant and there was reasonable agreement between actual and self-reported measurements [31,32]. In other studies, which found differences, they reported that over 90% of adolescent participants estimated wei- ght and height was in the correct BMI (Overweight/ obese or Normal) classification group [33]. 5. CONCLUSIONS The findings of this study indicate that only 25% of children aged 11-15 years in the four English schools were engaging in the recommended 60 minutes of mod- erate to vigorous physical activity per day. This estimate is considerably lower than several previous reports which suggested that between 38% and 80% of children were achieving the recommended physical activity guidelines. This level of inactivity, observed in our sur- vey, if sustained, could have serious future public health consequences for England. This may lead to an in- creased likelihood of being overweight in adulthood and consequently more ill health, with increases in the inci- dence of diabetes and coronary heart disease in adult life. Although the proportion of children with a normal BMI of 24% is similar to other UK studies the consumption of too little fruit and too much fat indicates few of these children at secondary school age are meeting the UK government targets of 5 or more portions of fruit and vegetables per day and less than 35% of daily calorie intake made up of fat. More research is needed possibly linking self report and that of an objective nature, to measure activity and BMI, to confirm these findings. REFERENCES [1] Black, D., Morris, J.N., Smith, C. and Townsend, P. (1980) Inequalities in health: Report of a research work- ing group. Department of Health and Social Security, London. [2] Davey, S.G., Bartley, M. and Blane, D. (1990) The black report on socioeconomic inequalities in health 10 years on. British Medical Journal, 301(6748), 373-377. [3] Morris, J.N. (1990) Inequalities in health: Ten years and little further on. Lancet, 336(8713), 491-493. [4] Department of Health, (1992) The health of the nation: A strategy for health in England. Her Majesty’s Stationery Office, London. [5] Davey, S.G. and Egger, M. (1993) Socioeconomic dif- ferentials in wealth and health: Widening inequalities in health. British Medical Journal, 307(6912), 1085-1086. [6] National Statistics Online (2008) Life expectancy at birth by health and local authorities in the United Kingdom 1999-2003. http://www.statistic s.gov. uk/downl oads/the me _population/LE _E&W_2007.x ls [7] National Institutes of Health (NIH): The National Heart, Lung and Blood Institute (1998) Clinical guidelines on the identification evaluation and treatment of overweight and obesity in adults: The evidence report. NIH Publica- tions, Rockville. [8] Reilly, J.J., Methven, E., McDowel, Z.C., Hacking, B., Alexander, D., Stewart, L. and Kelnar, C.J.H. (2003) Health consequences of obesity. Archives of Disease in Childhood, 88(9), 748-752. [9] DH (Department of Health) (Central Health Monitoring Unit, Health Improvement Directorate – Public Health) (2006) Health Profile of England, Department of Health, London. [10] Erlichman, J., Kerbey, A.L. and James, W.T.P. (2002) Physical activity and its impact on health outcomes. Pa- per 2: The prevention of unhealthy weight gain and obe- sity by physical activity: An analysis of the evidence. Obesity Reviews, 3(4), 273-287. [11] Department of Health (2004) At least five a week. Evi- dence on the impact of physical activity and its relation- ship to health. A report from the chief medical officer. Department of Health, London. [12] Khunti, K., Stone, M., Bankart, J., et al. (2007) Physical activity and sedentary behaviours of South Asian and white European children in inner city secondary schools in the UK. Family Practice, 24(3), 237-244. [13] Sproston, K. and Primatesta, P., Eds. (2003) Health sur- vey for England 2002. The health of children and young people. Stationary Office, London. [14] The Committee on Medical Aspects of Food Policy (CO- MA) (1991) Report on health and social subjects 41, Dietary Reference Values (DRVs) for food energy and nutrients for the UK, report of the panel on DRVs. Sta- tionary Office, London. [15] Gregory, J.R., Lowe, S., Bates, C.J., et al. (2000) Na- tional diet and nutrition survey: Young people aged 4-18  S. E. Boyle et al. / Health 2 (2010) 1142-1149 Copyright © 2010 SciRes. Openly accessible at http://www.scirp.org/journal/HEALTH/ 114 1149 years. Her Majesty’s Stationery Office, London. [16] Boyle, S.E. (2008) Evaluation of physical activity levels among adolescents in the Southwest and Northwest: Consideration of health issues. A Ph.D. study. The Uni- versity of Sheffield, Sheffield. [17] McCormack, G. and Giles-Corti, B. (2002) Report to the physical activity taskforce, evaluation and monitoring group: An assessment of self-report questionnaires and motion sensors for measuring physical activity in chil- dren. Department of Public Health, The University of Western Australia, Perth. [18] Hands, B., Parker, H., Glasson, C., Brinkman, S. and Read, H. (2004) Results of Western Australian child and adolescent physical activity and nutrition survey 2003 (CAPANS. Physical Activity Technical Report). The University of Notre Dame, Australia. [19] Block, G., Gillespie, C., Rosenbaum E.H. and Jenson, C. (2000) A rapid food screener to assess fat and fruit and vegetable intake. American Journal of Preventive Med- icine, 18(4), 284-288. [20] Cole, T.J., Freeman, J.V. and Preece, M.A. (1990) Body mass index reference curves for the UK. Archives of Disease in Childhood, 73(1), 25-29. [21] Sallis, J.F., Prochaska, J.J. and Taylor, W.C. (2000) A review of correlates of physical activity of children and adolescents. Medicine and Science in Sports and Exer- cise, 32(5), 963-975. [22] van Mechelen, W. and Kemper, H.C.G. (1995) Habitual PA in longitudinal perspective. In: Kemper, H.G.C., Ed., The Amsterdam growth study: A longitudinal analysis of health, fitness and lifestyle. Human Kinetics, Champaign, 135-158. [23] StataCorp (2005) Stata statistical software: Release 9. StataCorp LP, College Station. [24] Chinn, S. and Rona, R.J. (2002) International definitions of overweight and obesity for children: A lasting solution? Annals of Human Biology, 29(3), 306-313. [25] Currie, C., Roberts, C., Morgan, A., et al. (2004) Young peoples health in context. Health behaviour in school children (HBSC) study: International report from 2001/ 2002 survey, health policy for children and adolescents. 4, World Health Organization, Copenhagen. [26] WHO (World Health Organization) (2004) Global strat- egy on diet, physical activity and health. WHO, Geneva. [27] Welk, G. (2002) Physical activity assessments for health related research. Human Kinetics, Iowa. [28] DOH (2001) The national school fruit scheme: Evalua- tion summary. Crown Copyright, Department of Health. [29] Welk, G.J., Corbin, C.B. and Dale, D. (2000) Measure- ment issues in the assessment of physical activity in children. Research Quarterly for Exercise and Sport, 71(2), 59-73. [30] Sallis, J.F. and Owen, N. (1999) Physical activity and behavioural medicine. Sage Publications, London. [31] Fortenberry, D.J. (1992) Reliability of adolescents’ re- ports of height and weight. Journal of Adolescent Health, 13(2), 114-117. [32] Strauss, R.S. (1999) Comparison of measured and self reported weight and height in a cross sectional sample of young adolescents. International Journal of Obesity Re- lated Metabolic Disorders, 23(8), 904-908. [33] Goodman, E., Hinden, B.R. and Khandelwal, S. (2000) Accuracy of teen and parental reports of obesity and body mass index. Peadiatrics, 106(1), 52-58. |