 Low Carbon Economy, 2010, 1, 29-38 doi:10.4236/lce.2010.11005 Published Online September 2010 (http://www.SciRP.org/journal/lce) Copyright © 2010 SciRes. LCE 1 Effect of Wind Generation System Rating on Transient Dynamic Performance of the Micro-Grid during Islanding Mode Rashad M. Kamel, Aymen Chaouachi, Ken Nagasaka Environmental Energy Engineering, Department of Electronics & Information Engineering, Tokyo University of Agriculture and Technology, Tokyo, Japan. Email:r_m_kamel@yahoo.com, a.chaouachi@gmail.com, bahman@cc.tuat.ac.jp Received August 3rd, 2010; revised October 8th, 2010; accepted October 11th, 2010. ABSTRACT Recently, several types of distributed generations (DGs) are connected together and form a small power system called Micro Grid (MG). This paper developed a complete model which can simulate in details the transient dynamic per- formance of the MG during and subsequent to islanding process. All MG’s components are modeled in detail. The de- veloped model is used to investigate how the transient dynamic performance of the MG will affected by increasing the rating of wind generation system installed in the MG. Two cases are studied; the first case investigates the dynamic performance of the MG equipped with 10 kW fixed speed wind generation system. The second studied case indicates how the dynamic performance of the MG will be affected if the wind generation system rating increases to 30 kW. The results showed that increasing of wind generation rating on the MG causes more voltage drops and more frequency fluctuations due to the fluctuation of wind speed. Increasing voltage drops because wind turbine generator is a squirrel cage induction generator and absorbs more reactive power when the generated active power increases. The frequency fluctuations due to power fluctuations of wind turbine as results of wind speed variations. The results proved that when the MG equipped with large wind generation system, high amount of reactive power must be injected in the system to keep its stability. The developed model was built in Matlab® Simulink® environment. Keywords: MG, Distributed Generators, Wind Power Rating and Dynamic Performance 1. Introduction Recent technological developments in micro generation domain, necessity of reducing CO2 emissions in the elec- tricity generation field, and electricity business restruct- ing are the main factors responsible for the growing in- terest in the use of micro generation [1,2]. In fact the connection of small generation units—the micro sources (MS), with power rating less than a few tens of kilowatts— to low voltage (LV) networks potentially increases the reliability to final consumers and brings additional bene- fits for global system operation and planning, namely, regarding investment reduction for future grid reinforce- ment and expansion [3]. In this context, a MG can be defined as a LV network (e.g. a small urban area, a shopping center, or an indus- trial park) plus its loads and several small modular gen- eration systems connected to it, providing both power and heat to local loads [combined heat and power (CHP)] [3]. The MG is intended to operate in the following two different operating conditions: Normal Interconnected Mode: MG is connected to a main grid (distribution network), either being supplied by it or injecting some mount of power into the main sys- tem. Emergency Mode: MG operates autonomously, in a similar way to physical islands, when the disconnection from the upstream distribution network occurs. The development of MGs can contribute to the reduc- tion of emissions and the mitigation of climate changes. This is because available and currently developing tech- nologies for distributed generation units are based on re- newable sources and micro sources that are characterized by very low emissions [4]. The new micro sources tech- nologies (e.g. micro gas turbine, fuel cells, photovoltaic panels and several kinds of wind turbines) used in MG are not suitable for supplying energy to the MG directly  30 Effect of Wind Generation System Rating on Transient Dynamic Performance of the Micro-Grid during Islanding Mode [3]. They have to be interfaced with the MG through an inverter stage. Thus, the use of power electronic inter- faces in the MG leads to a series of challenges in the de- sign and operation of the MG [5]. Technical challenges associated with the operation and control of MG are im- mense. Ensuring stable operation during network distur- bances, maintaining stability and power quality in the islanding mode of operation requires the development of sophisticated control strategies for MG’s inverters in or- der to provide stable frequency and voltage in the pres- ence of arbitrarily varying loads. This paper’s objective is to demonstrate the transient dynamic performance of the MG during and subsequent to islanding process and how it will affected with increasing the wind power rat- ing installed in the MG. Reference [6] discusses MG autonomous operation du- ring and subsequent to islanding process but the renew- able micro sources not included, also, this reference used PSCAD/EMTDC package for analysis. In references [7] and [8] a control scheme based on droop concepts to op- erate inverter feeding a standalone AC system is dis- cussed. References [9] and [10] discuss the behavior of distributed generators (DGs) connected to distribution network, however, the dynamics of the primary energy sources has not been considered, not allowing obtaining the full picture of the MG long-term dynamic behavior, which is largely influenced by the micro sources dynamic. This paper developed a complete model to simulate the dynamic performance of the MG. All MG’s compo- nents are modeled in details. The developed model is a general and can be used to study any disturbance which may occur in the MG. Effect of increasing wind power rating is investigated. Two cases are studied; the first ca- se is studying the transient dynamic performance of the MG equipped with 10 kW fixed speed wind generation system. The second case is how the dynamic perform- ance of the MG will affect when the wind generation sys- tem is increased to 30 kW. The developed model was built in Matlab® Simulink® environment. To conduct the proposed studies, single line diagram of the studied MG is presented in Section 2. Section 3 gives a brief description of all MG’s components devel- oped models. Section 4 presents a description of the com- plete model with the applied controls. Two studied cases with results and discussions are explained in Section 5. Conclusions are presented in Section 6. 2. Single Line Diagram of the Studied Micro-Grid Figure 1 shows single line diagram of the studied MG. It consists of 7 buses. Flywheel is connected to bus # 1. Wind generation system is connected to bus # 2. Two Figure 1. Single line diagram of the studied MG. photovoltaic panels with rating 10 kW and 3 kW are connected to buses 4 and 5, respectively. Single shaft micro turbine (SSMT) with rating 22 kW is connected to bus # 6. Bus 7 is provided with 22 kW solid oxide fuel cell (SOFC). The values loads and line parameters of the MG are available in reference [11]. 3. Description of Microgrid Individual Components Models 3.1. Inverter Models Inverters play a vital role in the system which interfaces of the micro sources with the AC power system. Two control models of the inverter which used to interface micro sources to the MG are developed. The configura- tion of the basic inverter interfaced micro sources is sho- wn in Figure 2. The inverter controls both the magnitude and phase angle of its output voltage (V in Figure 2). The vector relationship between the inverter voltage (V) and the lo- cal MG voltage (E in Figure 2) along with the inductor’s reactance determines the flow of active and reactive powers from the micro source to the MG [12]. The cor- responding mathematical relations for P (active power) and Q (reactive power) magnitudes are given by the fol- lowing equations: sin () VE VE PL (1) 2 cos () VE VVE QLL (2) From Equation (1) and Equation (2), the control of ac- Copyright © 2010 SciRes. LCE 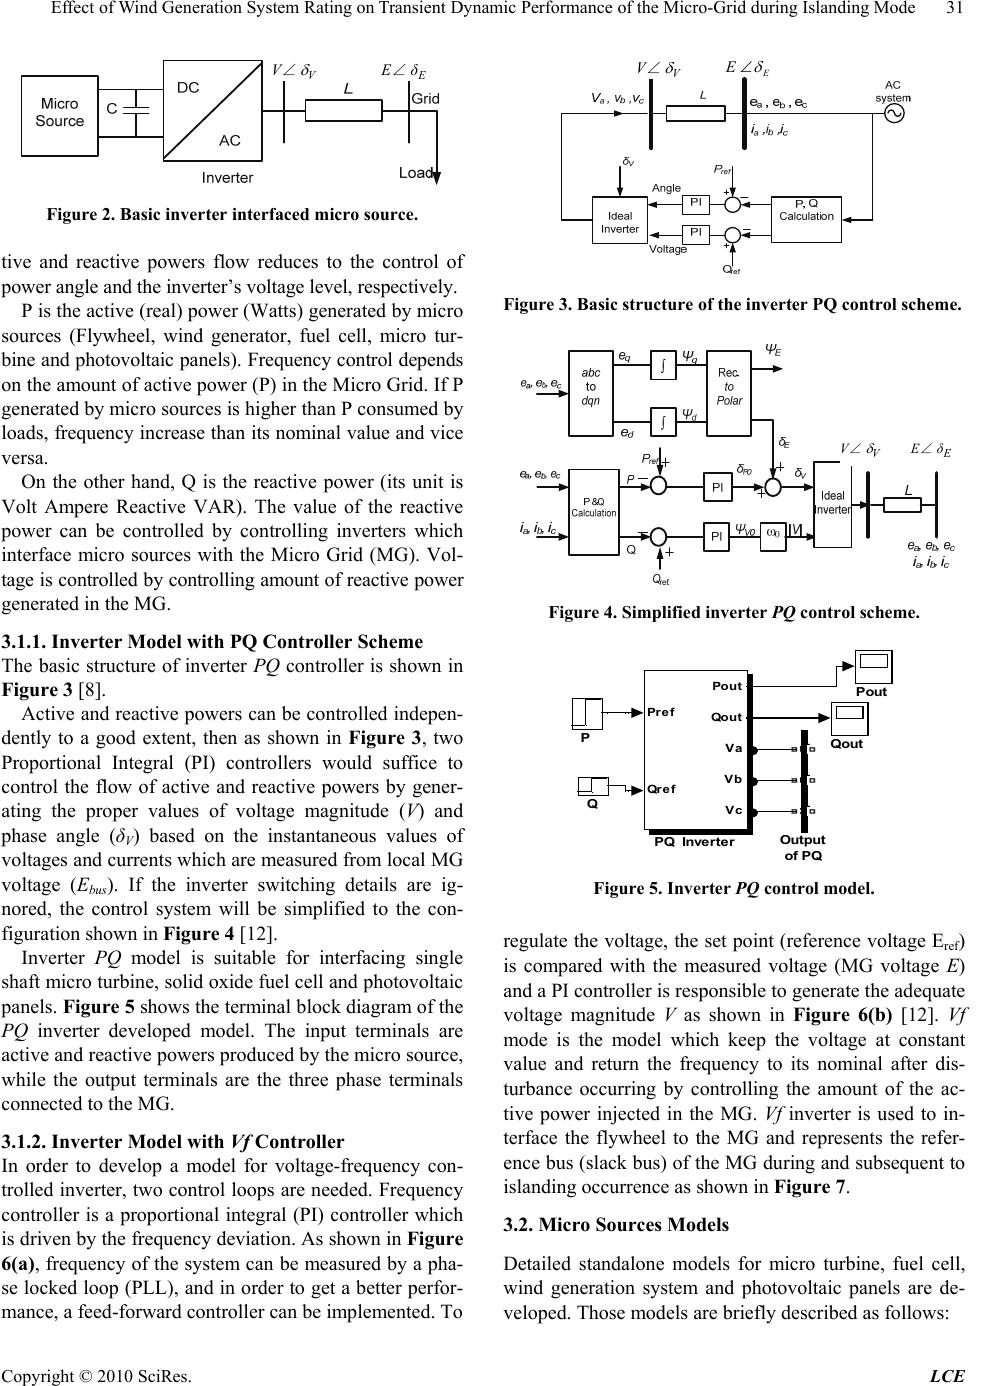 Effect of Wind Generation System Rating on Transient Dynamic Performance of the Micro-Grid during Islanding Mode31 V V E E Figure 2. Basic inverter interfaced micro source. tive and reactive powers flow reduces to the control of power angle and the inverter’s voltage level, respectively. P is the active (real) power (Watts) generated by micro sources (Flywheel, wind generator, fuel cell, micro tur- bine and photovoltaic panels). Frequency control depends on the amount of active power (P) in the Micro Grid. If P generated by micro sources is higher than P consumed by loads, frequency increase than its nominal value and vice versa. On the other hand, Q is the reactive power (its unit is Volt Ampere Reactive VAR). The value of the reactive power can be controlled by controlling inverters which interface micro sources with the Micro Grid (MG). Vol- tage is controlled by controlling amount of reactive power generated in the MG. 3.1.1. Inverter Model with PQ Controller Scheme The basic structure of inverter PQ controller is shown in Figure 3 [8]. Active and reactive powers can be controlled indepen- dently to a good extent, then as shown in Figure 3, two Proportional Integral (PI) controllers would suffice to control the flow of active and reactive powers by gener- ating the proper values of voltage magnitude (V) and phase angle (δV) based on the instantaneous values of voltages and currents which are measured from local MG voltage (Ebus). If the inverter switching details are ig- nored, the control system will be simplified to the con- figuration shown in Figure 4 [12]. Inverter PQ model is suitable for interfacing single shaft micro turbine, solid oxide fuel cell and photovoltaic panels. Figure 5 shows the terminal block diagram of the PQ inverter developed model. The input terminals are active and reactive powers produced by the micro source, while the output terminals are the three phase terminals connected to the MG. 3.1.2. Inverter Model with Vf Controller In order to develop a model for voltage-frequency con- trolled inverter, two control loops are needed. Frequency controller is a proportional integral (PI) controller which is driven by the frequency deviation. As shown in Figure 6(a), frequency of the system can be measured by a pha- se locked loop (PLL), and in order to get a better perfor- mance, a feed-forward controller can be implemented. To V V E E Figure 3. Basic structure of the inverter PQ control scheme. V V E E Figure 4. Simplified inverter PQ control scheme. Qout Q Pout Pr e f Qr e f Pout Qout Va Vb Vc PQ Inverter P Outp u t of PQ Figure 5. Inverter PQ control model. regulate the voltage, the set point (reference voltage Eref) is compared with the measured voltage (MG voltage E) and a PI controller is responsible to generate the adequate voltage magnitude V as shown in Figure 6(b) [12]. Vf mode is the model which keep the voltage at constant value and return the frequency to its nominal after dis- turbance occurring by controlling the amount of the ac- tive power injected in the MG. Vf inverter is used to in- terface the flywheel to the MG and represents the refer- ence bus (slack bus) of the MG during and subsequent to islanding occurrence as shown in Figure 7. 3.2. Micro Sources Models Detailed standalone models for micro turbine, fuel cell, wind generation system and photovoltaic panels are de- veloped. Those models are briefly described as follows: ∠ δ V∠V V∠V V∠V δ∠ Copyright © 2010 SciRes. LCE  32 Effect of Wind Generation System Rating on Transient Dynamic Performance of the Micro-Grid during Islanding Mode Figure 6. Inverter Vf control scheme. 50 f0 f fo Er e f f Vout Va Vb Vc Vf Inverter (VSI) V Output of Vf Vout Figure 7. Vf controlled inverter. 3.2.1. Single Shaft Micro Turbine Model (SSMT) References [13-16] describe in details the mathematical model of single shaft and split-shaft micro turbine. The mathematical model is simulated in Matlab® Simulink® environment and the model is shown in Figure 8(a). In- put terminal is Pref which represent the desired power. The output terminal is Pe (electrical power output from synchronous generator which coupled with micro turbine). Pe is connected to P input terminal of the PQ inverter. Load connected to the synchronous generator is a virtual resistive load because in Matlab® Simulink® the syn- chronous generator model must always connected to ex- ternal load. 3.2.2. Solid Oxide Fuel Cell (SOFC) Model Detailed mathematical model of solid oxide fuel cell (S- OFC) is discussed by references [13,14,17]. This model is simulated using Matlab® Simulink® and model block diagram is shown in Figure 8(b). Input terminals are Pref (desired power) and rated voltage of fuel cell (Vrated). Out- put terminal is Pe which represents the electrical power output from fuel cell. This terminal is applied to P input terminal of the PQ inverter model. 3.2.3. Wind Generation System Model Wind generator used in this paper is a squirrel-cage in- duction generator that directly connected to the MG. Wind turbine model is based on the steady state power characteristic of the turbine. The stiffness of the drive 1 Pe Go to Inverter -C- Vrated A B C Virtual Load Pm wm Pe Va Vb Vc Synchrounous Ge ne ra tor ( a ) Pref P ref wm Pref Pm Microturbine Vrated Pr ef Pout Fuell cell model ( b ) Pe Active power Generator Figure 8. Micro turbine and fuel cell standalone developed models. train is infinite and the friction factor and the inertia of the turbine must be combined with those of the generator cou- pled to the turbine [14,18]. The output power of the turbine is given by the follow- ing equation: 3 2 ),( windPm v A CP (3) where: Pm: Mechanical output power of the turbine (W). CP: Performance coefficient of the turbine. ρ: Air density (kg/m3). wind : Wind speed (m/s). λ: Tip speed ratio of the rotor blade tip speed to wind speed. β: Blade pitch angle (deg.) and A: Turbine swept area (m2). A generic equation is used to model CP (λ, β). This equation, based on the modeling turbine characteristics of reference [18], is: 5 2 134 (, )()i c P i c cccce 6 c (4) with: 3 11 0.035 0.08 1 i (5) The coefficient C1 to C6 are: C1 = 0.5176, C2 = 116, C3 = 0.4, C4 = 5, C5 = 21 and C6 = 0.0068 [18]. For the induction generator, the well-known 4th order dq model is used, expressed in the arbitrary reference frame, rotating with an angular velocity [19]: .. dssd sq uri p sd (6) .. qs sqsdsq uri p (7) 0.( ). rdr rdrrqrd uri p (8) 0.( ). rqr rqrrdrq uri p (9) Where 0 1d pdt , and 0 is the base electrical an- gular frequency. Generator convention is used for the stator currents. The zero sequence equation is omitted, since the machine stator is connected. The stator and ro- Copyright © 2010 SciRes. LCE 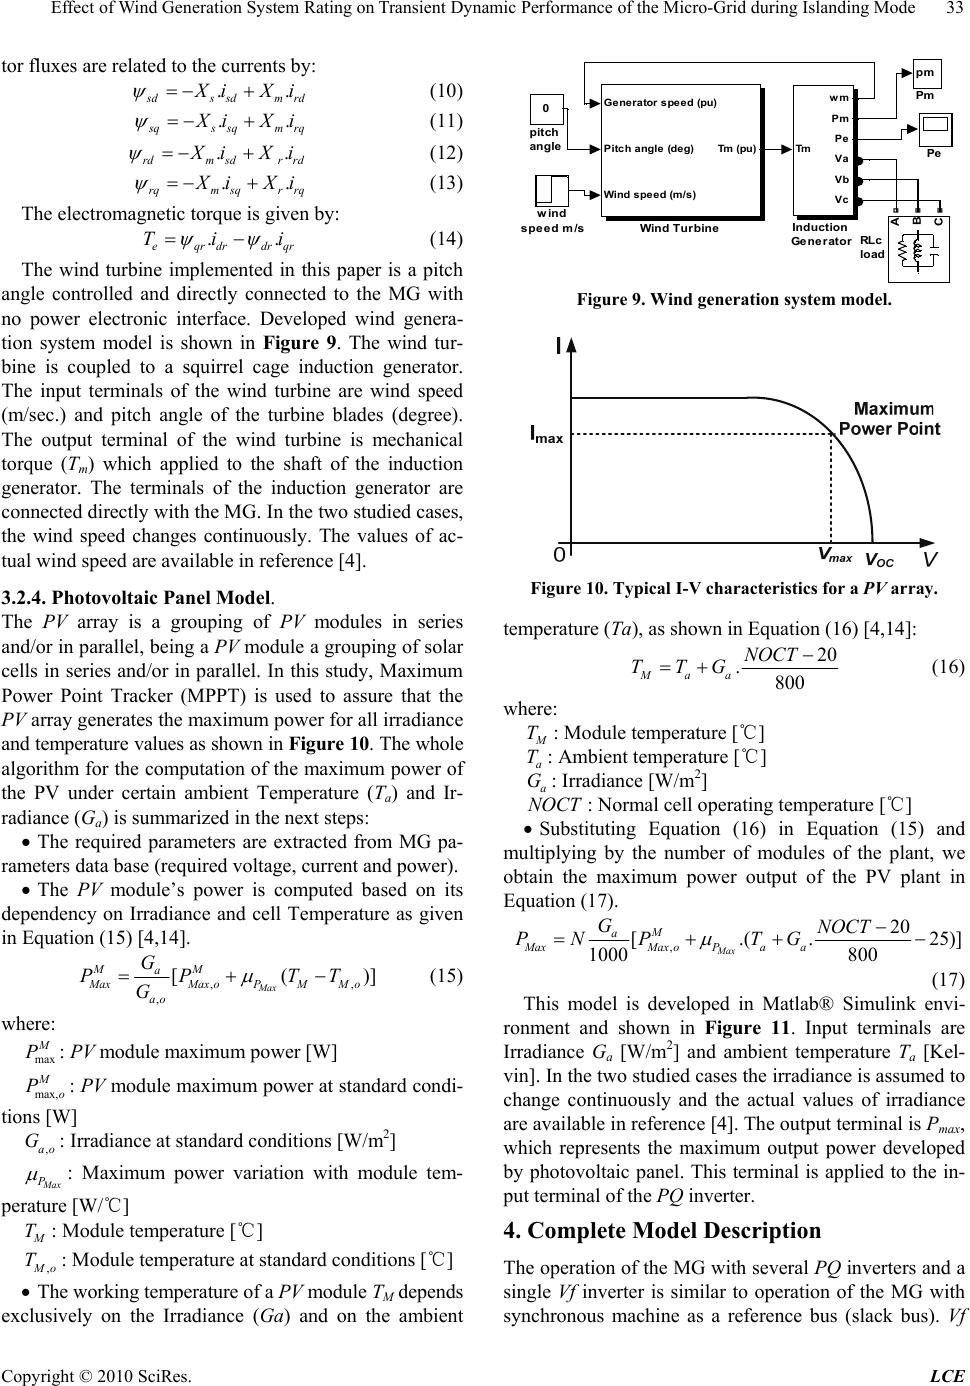 Effect of Wind Generation System Rating on Transient Dynamic Performance of the Micro-Grid during Islanding Mode33 . tor fluxes are related to the currents by: . dssdmrd iXi (10) .. qssqmrq iXi (11) . rdm sdr rd . iXi (12) . rqmsqr rq . iXi (13) The electromagnetic torque is given by: . eqrdrdrq Ti. r i (14) The wind turbine implemented in this paper is a pitch angle controlled and directly connected to the MG with no power electronic interface. Developed wind genera- tion system model is shown in Figure 9. The wind tur- bine is coupled to a squirrel cage induction generator. The input terminals of the wind turbine are wind speed (m/sec.) and pitch angle of the turbine blades (degree). The output terminal of the wind turbine is mechanical torque (Tm) which applied to the shaft of the induction generator. The terminals of the induction generator are connected directly with the MG. In the two studied cases, the wind speed changes continuously. The values of ac- tual wind speed are available in reference [4]. 3.2.4. Photovoltaic Panel Model. The PV array is a grouping of PV modules in series and/or in parallel, being a PV module a grouping of solar cells in series and/or in parallel. In this study, Maximum Power Point Tracker (MPPT) is used to assure that the PV array generates the maximum power for all irradiance and temperature values as shown in Figure 10. The whole algorithm for the computation of the maximum power of the PV under certain ambient Temperature (Ta) and Ir- radiance (Ga) is summarized in the next steps: The required parameters are extracted from MG pa- rameters data base (required voltage, current and power). The PV module’s power is computed based on its dependency on Irradiance and cell Temperature as given in Equation (15) [4,14]. ,, , [( Max MM a MaxMax oPMMo ao G PP TT G )] (15) where: max P: PV module maximum power [W] max, M o P: PV module maximum power at standard condi- tions [W] ,ao G: Irradiance at standard conditions [W/m2] ax P : Maximum power variation with module tem- perature [W/℃] T: Module temperature [℃] , o T: Module temperature at standard conditions [℃] The working temperature of a PV module TM depends exclusively on the Irradiance (Ga) and on the ambient wind speed m/s 0 pitch angle Generator speed (pu) Pitch angle (deg) Wind speed (m/s) Tm (pu) Wind Turbine A B C RLc load pm Pm Pe Tm wm Pm Pe Va Vb Vc Induction Ge ne r at or Figure 9. Wind generation system model. Figure 10. Typical I-V characteristics for a PV array. temperature (Ta), as shown in Equation (16) [4,14]: 20 .800 Maa NOCT TTG (16) where: T T : Module temperature [℃] a G : Ambient temperature [℃] a NOC : Irradiance [W/m2] T: Normal cell operating temperature [℃] Substituting Equation (16) in Equation (15) and multiplying by the number of modules of the plant, we obtain the maximum power output of the PV plant in Equation (17). , 20 [.(. 1000 800 Max M a MaxMax oPaa GNOCT PN PTG 25)] (17) This model is developed in Matlab® Simulink envi- ronment and shown in Figure 11. Input terminals are Irradiance Ga [W/m2] and ambient temperature Ta [Kel- vin]. In the two studied cases the irradiance is assumed to change continuously and the actual values of irradiance are available in reference [4]. The output terminal is Pmax, which represents the maximum output power developed by photovoltaic panel. This terminal is applied to the in- put terminal of the PQ inverter. 4. Complete Model Description The operation of the MG with several PQ inverters and a single Vf inverter is similar to operation of the MG with synchronous machine as a reference bus (slack bus). Vf Copyright © 2010 SciRes. LCE  34 Effect of Wind Generation System Rating on Transient Dynamic Performance of the Micro-Grid during Islanding Mode 1 Pma x Temperature (Ta) Ga Ta Pm ax PV Model Irradiance (Ga) Figure 11. PV array developed model. inverter provides the voltage reference for the operation of the PQ inverters when the MG is isolated from the main power system. Acting as a voltage source, the Vf in- verter requires a significant amount of storage capability in the DC link or a prime power source with a very fast response in order to maintain the DC link voltage con- stant. In other words, the power requested by a Vf inver- ter needs to be available almost instantaneously in the DC link. In fact, this type of behavior actually models the action of the flywheel system. Flywheel was considered to be existing at the DC bus of the Vf inverter to provide the required instantaneous power. The Vf inverter is re- sponsible for fast load-tracking during transients and for voltage control. During normal operation conditions (sta- ble frequency at nominal value), the output active power of the Vf inverter is zero; only reactive power is injected in the MG for voltage control. 4.1. Control of Active Power in Each Micro Source During islanded (autonomous) operation, when an im- balance between load and local generation occurs, the grid frequency drifts from its nominal value. Storage de- vices (flywheel) would keep injecting power into the network as long as the frequency differed from the no- minal value. Micro turbine and fuel cell are controllable sources which their output power can be controlled. A PI controller (input of this controller is the frequency devia- tion) acting directly in the primary machine (Pref of fuel cell and micro turbine) allows frequency restoration. Af- ter frequency restoration, storage devices will be operat- ing again at the normal operating point (zero active po- wer output). This controller can not apply to wind gene- ration system and photovoltaic panels because those mi- cro sources are uncontrollable sources and their output power depends on weather conditions (wind speed, ir- radiance and ambient temperature). Figure 12 shows the PI controller block diagram used to control output power of fuel cell and micro turbine. 4.2. Reactive Power-Voltage Control Figure 13 describes the adopted voltage control strategy. 2 P Active Power Reference for microsour ce ( Fuel Cell and Microturbine ) 50 f0 0.6 Pset Kp Proportional gain 1 s Integrator KI Inte gral ga in 1 Gr id freque ncy Figure 12. Control of active power of SOFC and micro tur- bine. Figure 13. Droop control of the Vf inverter terminal voltage. Knowing the network characteristics, it is possible to define the maximum voltage droop. To maintain the vol- tage between acceptable limits, Vf inverter connected to the flywheel will adjust the reactive power in the network. It will inject reactive power if the voltage falls under its nominal value and will absorb reactive power if the vol- tage rises over its nominal value. 4.3. Active Power-Frequency Control The transition to islanded operation mode and the opera- tion of the MG in islanded mode require micro genera- tion sources to particulate in active power-frequency control, so that the generation can match the load. During this transient period, the participation of the storage de- vices (flywheel) in system operation is very important, since the system has very low inertia, and some micro sources (micro turbine and fuel cell) have a very slow response to the request of an increase in power genera- tion. As already mentioned, the power necessary to pro- vide appropriate load-following is obtained from storage devices (flywheel). Knowing the network characteristics, it becomes possible to define the maximum frequency droop as shown in Figure 14. To maintain the frequency between acceptable limits, Vf inverter connected to fly- wheel will adjust the active power in the network. It will inject active power if the frequency falls below its nomi- nal value and will absorb active power if the frequency rises over its nominal value. 4.4. Complete Model All micro sources developed models, all inverters developed Copyright © 2010 SciRes. LCE 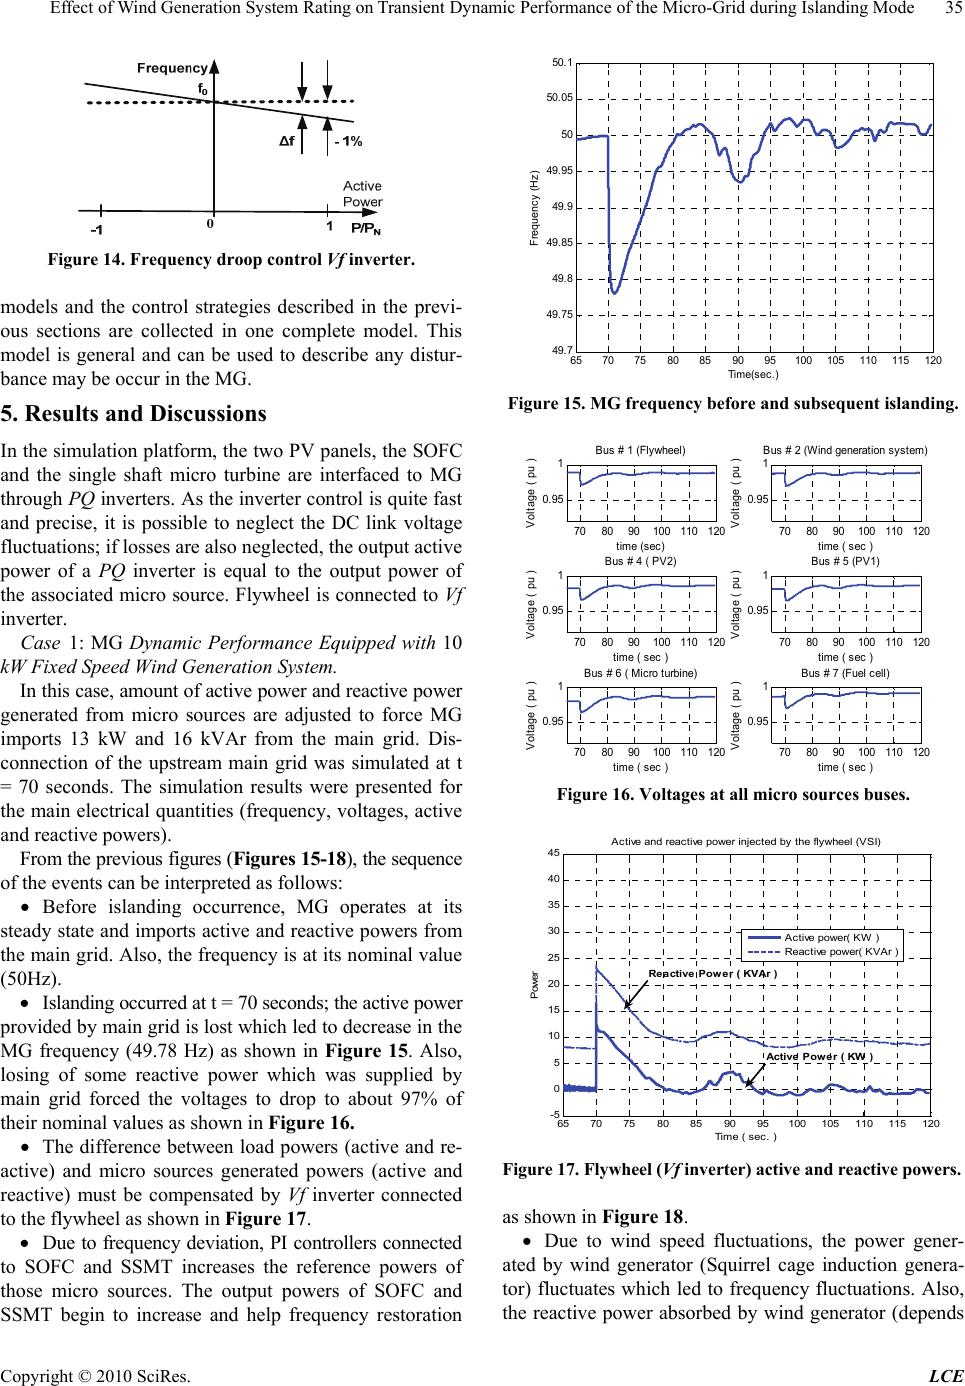 Effect of Wind Generation System Rating on Transient Dynamic Performance of the Micro-Grid during Islanding Mode35 Figure 14. Frequency droop control Vf inverter. models and the control strategies described in the previ- ous sections are collected in one complete model. This model is general and can be used to describe any distur- bance may be occur in the MG. 5. Results and Discussions In the simulation platform, the two PV panels, the SOFC and the single shaft micro turbine are interfaced to MG through PQ inverters. As the inverter control is quite fast and precise, it is possible to neglect the DC link voltage fluctuations; if losses are also neglected, the output active power of a PQ inverter is equal to the output power of the associated micro source. Flywheel is connected to Vf inverter. Case 1: MG Dynamic Performance Equipped with 10 kW Fixed Speed Wind Generation System. In this case, amount of active power and reactive power generated from micro sources are adjusted to force MG imports 13 kW and 16 kVAr from the main grid. Dis- connection of the upstream main grid was simulated at t = 70 seconds. The simulation results were presented for the main electrical quantities (frequency, voltages, active and reactive powers). From the previous figures (Figures 15-18), the sequence of the events can be interpreted as follows: Before islanding occurrence, MG operates at its steady state and imports active and reactive powers from the main grid. Also, the frequency is at its nominal value (50Hz). Islanding occurred at t = 70 seconds; the active power provided by main grid is lost which led to decrease in the MG frequency (49.78 Hz) as shown in Figure 15. Also, losing of some reactive power which was supplied by main grid forced the voltages to drop to about 97% of their nominal values as shown in Figure 16. The difference between load powers (active and re- active) and micro sources generated powers (active and reactive) must be compensated by Vf inverter connected to the flywheel as shown in Figure 17. Due to frequency deviation, PI controllers connected to SOFC and SSMT increases the reference powers of those micro sources. The output powers of SOFC and SSMT begin to increase and help frequency restoration 65 70 7580 8590 95100105110115120 49.7 49.75 49.8 49.85 49.9 49.95 50 50.05 50.1 Ti me( sec.) Frequency (Hz) Figure 15. MG frequency before and subsequent islanding. 70 8090100 110 120 0. 95 1 time (sec) Voltage ( pu ) Bus # 1 (Flywheel) 708090 100 110120 0.95 1 time ( sec ) Voltage ( pu ) Bus # 2 (Wind generation system) 70 8090100 110 120 0. 95 1 time ( sec ) Voltage ( pu ) Bus # 4 ( PV2) 708090 100 110120 0.95 1 time ( sec ) Voltage ( pu ) Bus # 5 (PV1) 70 8090100 110 120 0. 95 1 time ( sec ) Voltage ( pu ) Bus # 6 ( Micro turbine) 708090 100110 120 0.95 1 time ( sec ) Voltage ( pu ) Bus # 7 (Fuel cell) Figure 16. Voltages at all micro sources buses. 65 70 7580 8590 95100 105 110 115 120 -5 0 5 10 15 20 25 30 35 40 45 Time ( sec. ) Power Active and reactive power injected by the flywheel (VSI) Active power( KW ) Reactive power( KVAr ) Reactive Power ( KVAr ) Active Power ( KW ) Figure 17. Flywheel (Vf inverter) active and reactive powers. as shown in Figure 18. Due to wind speed fluctuations, the power gener- ated by wind generator (Squirrel cage induction genera- tor) fluctuates which led to frequency fluctuations. Also, the reactive power absorbed by wind generator (depends Copyright © 2010 SciRes. LCE 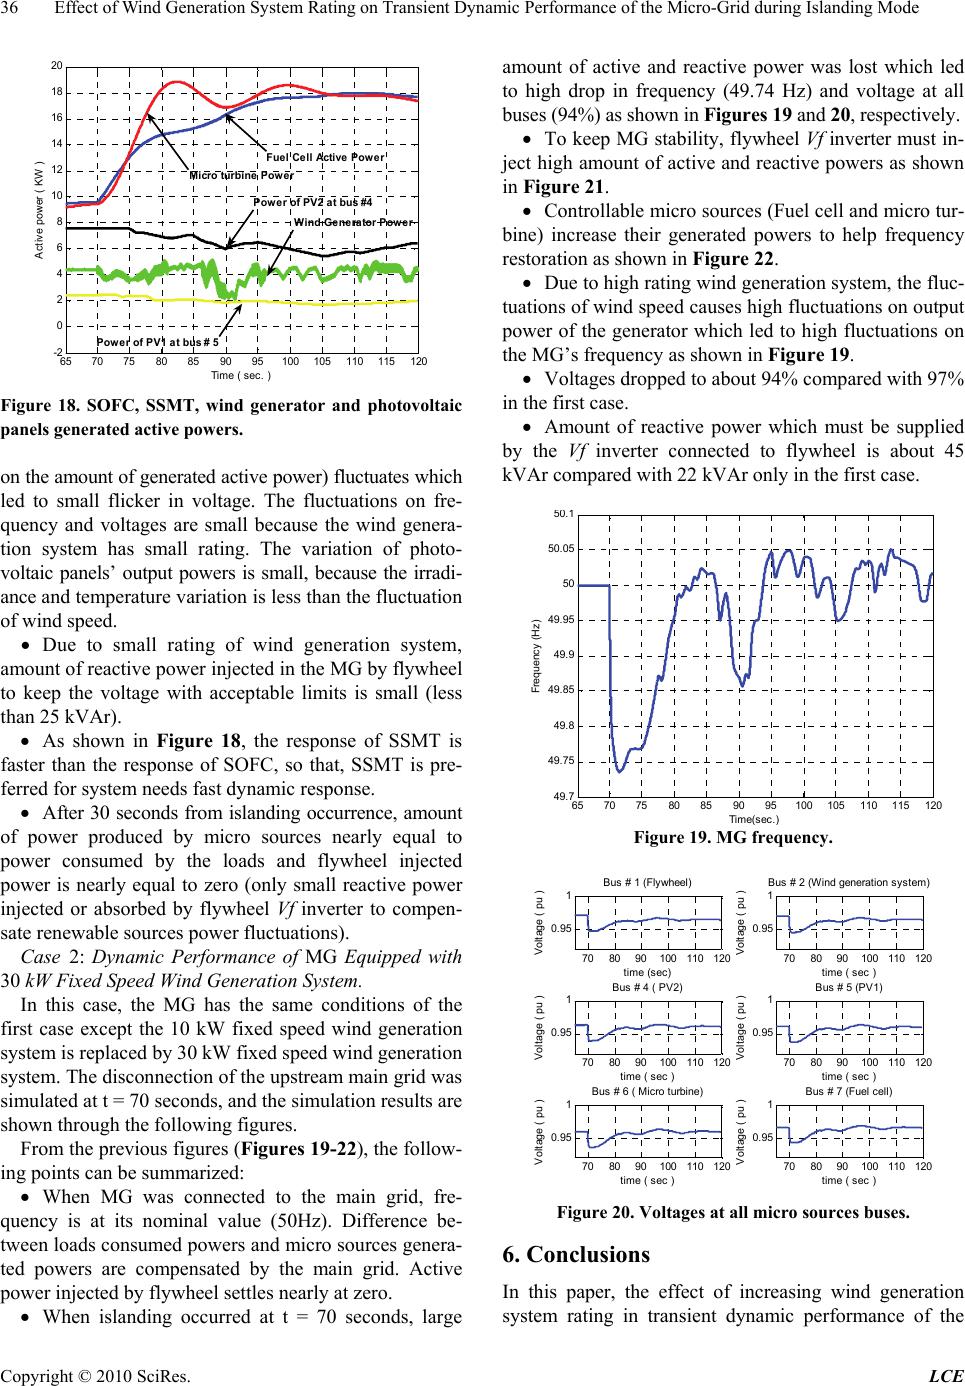 36 Effect of Wind Generation System Rating on Transient Dynamic Performance of the Micro-Grid during Islanding Mode 65 707580 85 90 95 100 105110 115120 -2 0 2 4 6 8 10 12 14 16 18 20 Time ( sec. ) Active power ( KW ) Fuel Cell Active Power Micro turbine Power Power of PV2 at bus #4 Wind Generator Power Power of PV1 at bus # 5 Figure 18. SOFC, SSMT, wind generator and photovoltaic panels generated active powers. on the amount of generated active power) fluctuates which led to small flicker in voltage. The fluctuations on fre- quency and voltages are small because the wind genera- tion system has small rating. The variation of photo- voltaic panels’ output powers is small, because the irradi- ance and temperature variation is less than the fluctuation of wind speed. Due to small rating of wind generation system, amount of reactive power injected in the MG by flywheel to keep the voltage with acceptable limits is small (less than 25 kVAr). As shown in Figure 18, the response of SSMT is faster than the response of SOFC, so that, SSMT is pre- ferred for system needs fast dynamic response. After 30 seconds from islanding occurrence, amount of power produced by micro sources nearly equal to power consumed by the loads and flywheel injected power is nearly equal to zero (only small reactive power injected or absorbed by flywheel Vf inverter to compen- sate renewable sources power fluctuations). Case 2: Dynamic Performance of MG Equipped with 30 kW Fixed Speed Wind Generation System. In this case, the MG has the same conditions of the first case except the 10 kW fixed speed wind generation system is replaced by 30 kW fixed speed wind generation system. The disconnection of the upstream main grid was simulated at t = 70 seconds, and the simulation results are shown through the following figures. From the previous figures (Figures 19-22), the follow- ing points can be summarized: When MG was connected to the main grid, fre- quency is at its nominal value (50Hz). Difference be- tween loads consumed powers and micro sources genera- ted powers are compensated by the main grid. Active power injected by flywheel settles nearly at zero. When islanding occurred at t = 70 seconds, large amount of active and reactive power was lost which led to high drop in frequency (49.74 Hz) and voltage at all buses (94%) as shown in Figures 19 and 20, respectively. To keep MG stability, flywheel Vf inverter must in- ject high amount of active and reactive powers as shown in Figure 21. Controllable micro sources (Fuel cell and micro tur- bine) increase their generated powers to help frequency restoration as shown in Figure 22. Due to high rating wind generation system, the fluc- tuations of wind speed causes high fluctuations on output power of the generator which led to high fluctuations on the MG’s frequency as shown in Figure 19. Voltages dropped to about 94% compared with 97% in the first case. Amount of reactive power which must be supplied by the Vf inverter connected to flywheel is about 45 kVAr compared with 22 kVAr only in the first case. 65 707580 859095100105 110115120 49.7 49.75 49.8 49.85 49.9 49.95 50 50.05 . Time sec. Frequency (Hz) Figure 19. MG frequency. 70 80 90100 110 120 0.95 1 time (sec) Voltage ( pu ) Bus # 1 (Flywheel) 70 80 90 100 110 120 0.95 1 time ( sec ) Voltage ( pu ) Bus # 2 (Wind generation system) 70 80 90100 110 120 0.95 1 time ( sec ) Voltage ( pu ) Bus # 4 ( PV2) 70 80 90 100 110 120 0.95 1 time ( sec ) Voltage ( pu ) Bus # 5 (PV1) 70 80 90100 110 120 0.95 1 time ( sec ) Voltage ( pu ) Bus # 6 ( Micro turbine) 70 80 90 100 110 120 0.95 1 time ( sec ) Voltage ( pu ) Bus # 7 (Fuel cell) Figure 20. Voltages at all micro sources buses. 6. Conclusions In this paper, the effect of increasing wind generation system rating in transient dynamic performance of the Copyright © 2010 SciRes. LCE 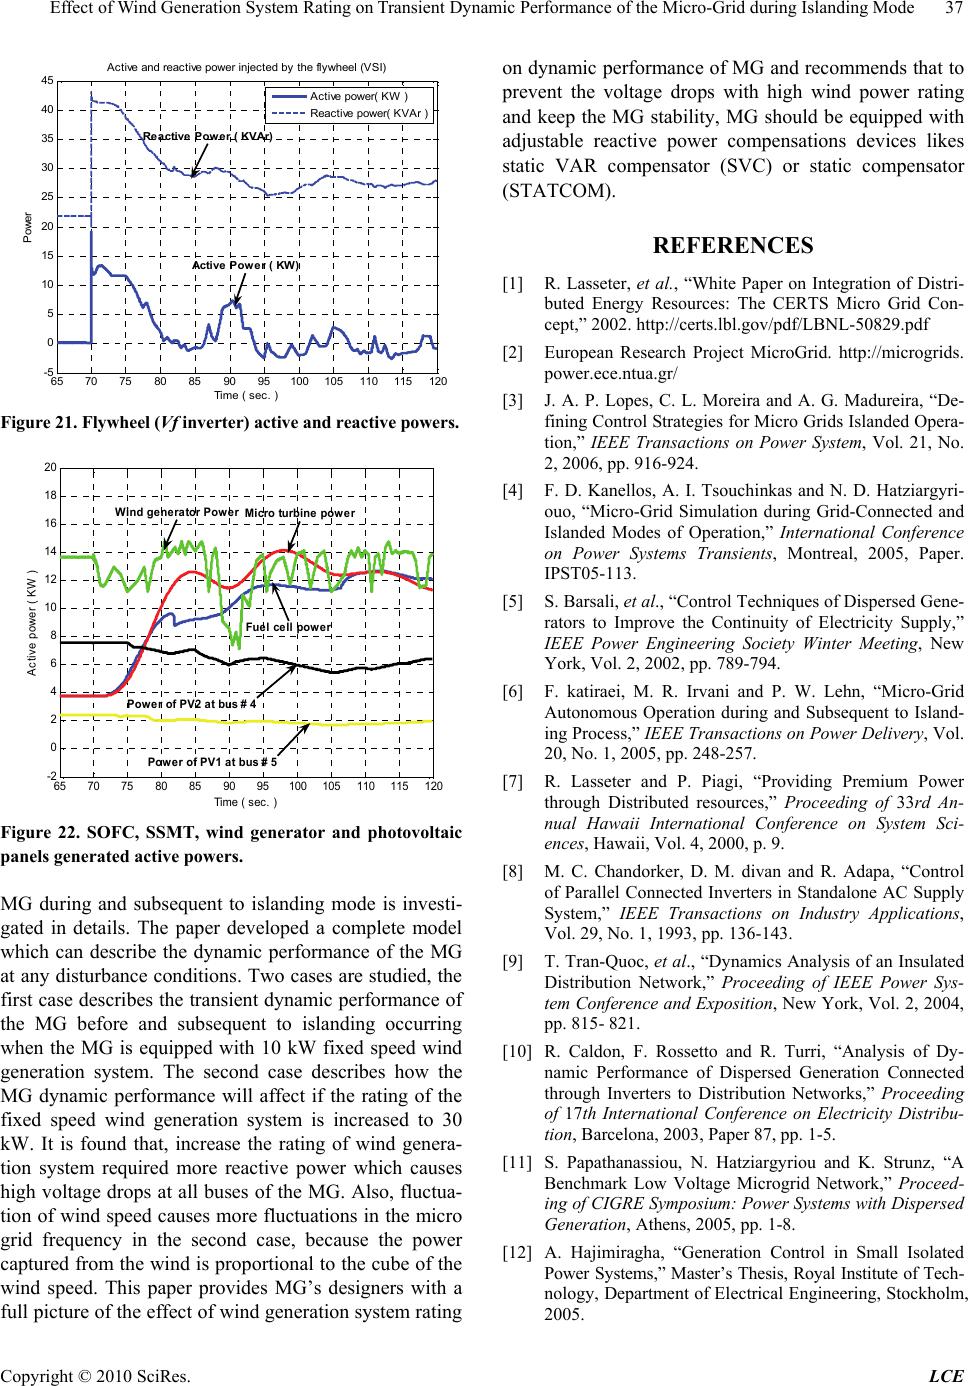 Effect of Wind Generation System Rating on Transient Dynamic Performance of the Micro-Grid during Islanding Mode37 65 70 7580 8590 95100105 110 115 120 -5 0 5 10 15 20 25 30 35 40 45 Time ( sec. ) Power Active and reactive power injected by the flywheel (VSI) Active power( KW ) Reactive power( KVAr ) Reactive Power ( KVAr) Active Power ( KW) Figure 21. Flywheel (Vf inverter) active and reactive powers. 65 70 75 80859095100105110 115 120 -2 0 2 4 6 8 10 12 14 16 18 20 Time ( sec. ) Active power ( KW ) Wind generator Power Power of PV1 at bus # 5 Power of PV2 at bus # 4 Micro turbine power Fuel cell power Figure 22. SOFC, SSMT, wind generator and photovoltaic panels generated active powers. MG during and subsequent to islanding mode is investi- gated in details. The paper developed a complete model which can describe the dynamic performance of the MG at any disturbance conditions. Two cases are studied, the first case describes the transient dynamic performance of the MG before and subsequent to islanding occurring when the MG is equipped with 10 kW fixed speed wind generation system. The second case describes how the MG dynamic performance will affect if the rating of the fixed speed wind generation system is increased to 30 kW. It is found that, increase the rating of wind genera- tion system required more reactive power which causes high voltage drops at all buses of the MG. Also, fluctua- tion of wind speed causes more fluctuations in the micro grid frequency in the second case, because the power captured from the wind is proportional to the cube of the wind speed. This paper provides MG’s designers with a full picture of the effect of wind generation system rating on dynamic performance of MG and recommends that to prevent the voltage drops with high wind power rating and keep the MG stability, MG should be equipped with adjustable reactive power compensations devices likes static VAR compensator (SVC) or static compensator (STATCOM). REFERENCES [1] R. Lasseter, et al., “White Paper on Integration of Distri- buted Energy Resources: The CERTS Micro Grid Con- cept,” 2002. http://certs.lbl.gov/pdf/LBNL-50829.pdf [2] European Research Project MicroGrid. http://microgrids. power.ece.ntua.gr/ [3] J. A. P. Lopes, C. L. Moreira and A. G. Madureira, “De- fining Control Strategies for Micro Grids Islanded Opera- tion,” IEEE Transactions on Power System, Vol. 21, No. 2, 2006, pp. 916-924. [4] F. D. Kanellos, A. I. Tsouchinkas and N. D. Hatziargyri- ouo, “Micro-Grid Simulation during Grid-Connected and Islanded Modes of Operation,” International Conference on Power Systems Transients, Montreal, 2005, Paper. IPST05-113. [5] S. Barsali, et al., “Control Techniques of Dispersed Gene- rators to Improve the Continuity of Electricity Supply,” IEEE Power Engineering Society Winter Meeting, New York, Vol. 2, 2002, pp. 789-794. [6] F. katiraei, M. R. Irvani and P. W. Lehn, “Micro-Grid Autonomous Operation during and Subsequent to Island- ing Process,” IEEE Transactions on Power Delivery, Vol. 20, No. 1, 2005, pp. 248-257. [7] R. Lasseter and P. Piagi, “Providing Premium Power through Distributed resources,” Proceeding of 33rd An- nual Hawaii International Conference on System Sci- ences, Hawaii, Vol. 4, 2000, p. 9. [8] M. C. Chandorker, D. M. divan and R. Adapa, “Control of Parallel Connected Inverters in Standalone AC Supply System,” IEEE Transactions on Industry Applications, Vol. 29, No. 1, 1993, pp. 136-143. [9] T. Tran-Quoc, et al., “Dynamics Analysis of an Insulated Distribution Network,” Proceeding of IEEE Power Sys- tem Conference and Exposition, New York, Vol. 2, 2004, pp. 815- 821. [10] R. Caldon, F. Rossetto and R. Turri, “Analysis of Dy- namic Performance of Dispersed Generation Connected through Inverters to Distribution Networks,” Proceeding of 17th International Conference on Electricity Distribu- tion, Barcelona, 2003, Paper 87, pp. 1-5. [11] S. Papathanassiou, N. Hatziargyriou and K. Strunz, “A Benchmark Low Voltage Microgrid Network,” Proceed- ing of CIGRE Symposium: Power Systems with Dispersed Generation, Athens, 2005, pp. 1-8. [12] A. Hajimiragha, “Generation Control in Small Isolated Power Systems,” Master’s Thesis, Royal Institute of Tech- nology, Department of Electrical Engineering, Stockholm, 2005. Copyright © 2010 SciRes. LCE  38 Effect of Wind Generation System Rating on Transient Dynamic Performance of the Micro-Grid during Islanding Mode Copyright © 2010 SciRes. LCE [13] Y. Zhu and K. Tomsovic, “Development of Models for Analyzing the Load-Following Performance of Microtur- bine and Fuel Cells,” Electric Power System Research, Vol. 62, No. 1, 2002, pp. 1-11. [14] G. Kariniotakis, et al., “DA1-Digital Models for Micro- sources,” Microgrids Project Deliverable of Task DA1, 2003. [15] L. N. Hannett, G. Jee and B. Fardanesh, “A Governor/ Turbine Model for a Twin-Shaft Combustion Turbine,” IEEE Transactions on Power System, Vol. 10, No. 1, 1995, pp. 133-140. [16] M. Nagpal, A. Moshref, G. K. morison, et al., “Experi- ence with Testing and Modeling of Gas Turbines,” Pro- ceedings of the IEEE/PES 2001 Winter Meeting, Colum- bus, 2001, pp. 652-656. [17] J. Padulles, G. W. Ault and J. R. McDonald, “An Inte- grated SOFC Plant Dynamic Model for Power Systems Simulation,” Journal of Power Sources, Vol. 86, No. 1-2, 2000, pp. 495-500. [18] S. Heir, “Grid Integration of Wind Energy Conversion Systems,” John Willy & Sons Ltd, Kassel, 1998. [19] C.-M. Ong, “Dynamic Simulation of Electric Machinery Using Matlab®/Simulink,” Prentice Hall PTR, New Jersey, 1997.
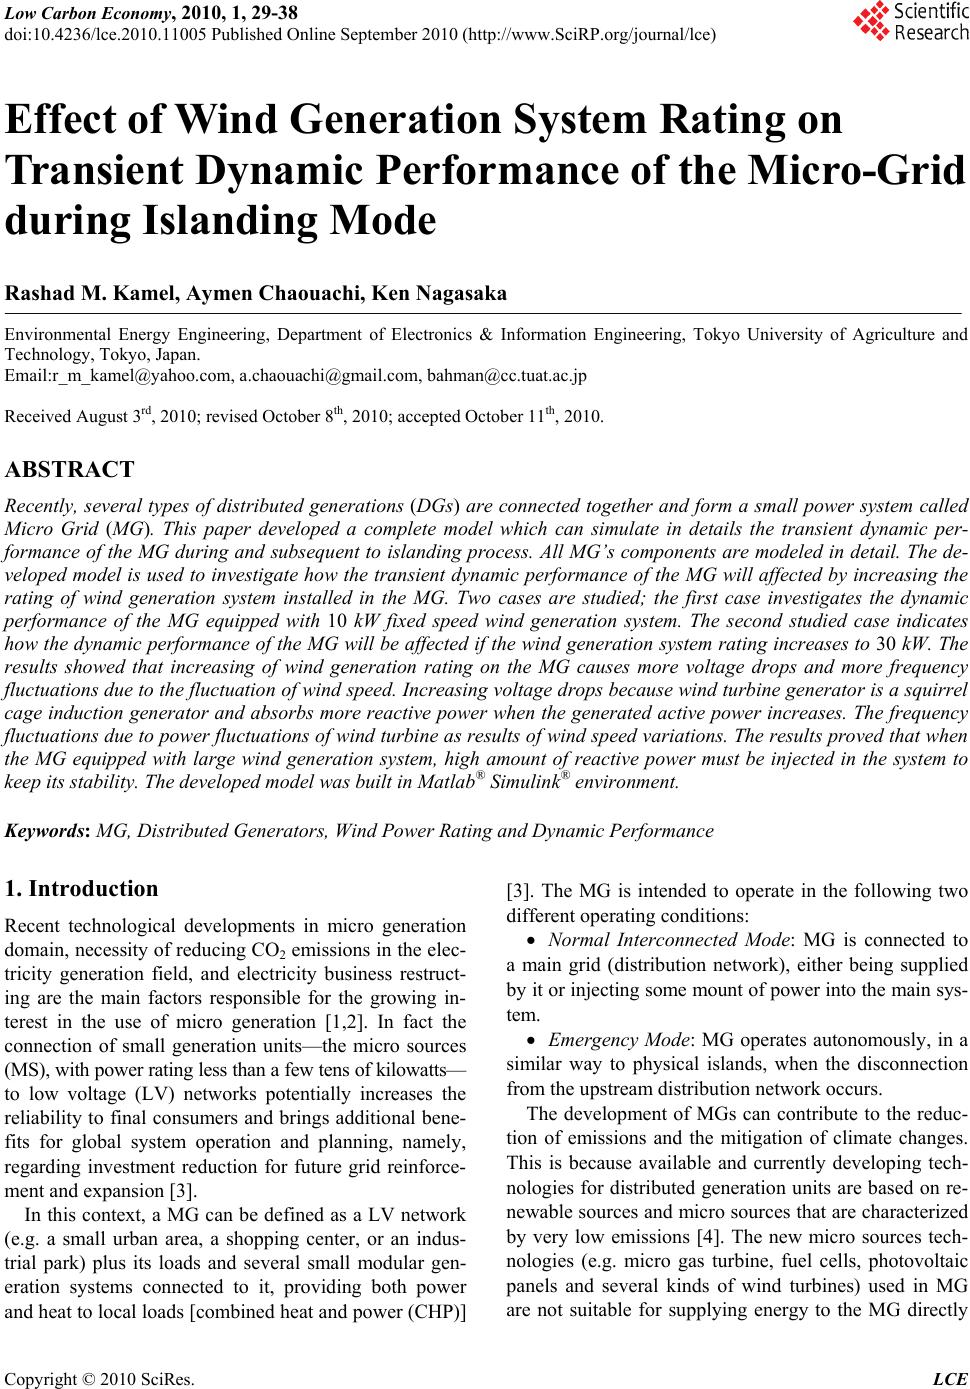
|