 International Journal of Medical Physics, Clinical Engineering and Radiation Oncology, 2013, 2, 19-29 Published Online February 2013 (http://www.scirp.org/journal/ijmpcero) http://dx.doi.org/10.4236/ijmpcero.2013.21004 Copyright © 2013 SciRes. IJMPCERO A Model System for Validation of PET Radiopharmaceuticals: Focusing on Tumor Microenvironment Xiao-Feng Li1, Huijie Jiang1,2, Yuanyuan Ma3, Tao Huang1,4,5, Xindao Yin1,6, A. Cahid Civelek7, Baozhong Shen4,5 1Department of Diagnostic Radiology, University of Louisville School of Medicine, Louisville, USA 2Department of Radiology, The 2nd Hospital of Harbin Medical University, Harbin, China 3Memorial Sloan-Kettering Cancer Center, New York, USA 4Department of Radiology, The 4th Hospital of Harbin Medical University, Harbin, China 5Key Laboratory of Molecular Imaging, College of Heilongjiang Province, Harbin, China 6Imaging Center, Nanjing First Hospital Affiliated to Nanjing Medical University, Nanjing, China 7Department of Diagnostic Radiology, Division of Nuclear medicine, University of Louisville School of Medicine, Louisville, USA Email: linucmed@gmail.com, shenbzh@vip.sina.com, accivelek@gmail.com Received September 7, 2012; revised October 8, 2012; accepted October 15, 2012 ABSTRACT Positron emission tomography (PET) imaging has emerged as an important clinical tool for cancer management, and specifically targeted radiopharmaceuticals play critical roles on PET molecular imaging. Solid cancers have highly complex and heterogeneous microenvironment, this review focused on those microenvironmental factors such as hy- poxia, proliferation and perfusion and, accordingly, a novel test system for validation of current and novel targeted im- aging radiopharmaceuticals. In this review, we have introduced the establishment of cancer and metastases models in nude mice, visualization of microenvironmental components of hypoxia, proliferation, perfusion, stroma and necrosis in cancers and metastases for establishing the microenvironment based model system, and validation of several radio- pharmaceuticals such as 18F-fluoro-2-deoxyglucose (18F-FDG) 18F-fluorothymidine (18F-FLT), 18F-misonidazole (18F- FMISO) using the system. We found that 18F-FLT accumulates in proliferating cancer cells, while 18F-FMISO and 18F-FDG mostly accumulate in hypoxic and non-proliferative cancer cells, 18F-FDG shares roughly similar intratumoral distribution pattern with 18F-FMISO and IAZGP, but mutually excludes 18F-FLT. This model system validated current tracers for imaging glucose metabolism, hypoxia and proliferation in cancer and metastases, therefore, can be used for novel targeted radiopharmaceuticals validation. Keywords: 18F-Fluoro-2-deoxyglucose; 18F-Fluorothymidine; 18F-Misonidazole; Microenvironment; Hypoxia; Proliferation. 1. Introduction Positron emission tomography (PET) imaging has emer- ged as an important clinical tool for cancer detection, staging, and monitoring response to therapy. Current radiopharmaceuticals such as 18F-fluoro-2-deoxyglucose (18F-FDG), 18F-fluorothymidine (18F-FLT) and 18F-miso- nidasole (18F-FMISO) are commonly used PET tracers for cancer management. However, no tracer is conclu- sively superior in the management of cancer. Serial PET scans have been used in clinical studies in patients [1-7] and preclinical researches in animal models [8-14] to study the uptake mechanism of the tracers. However, the results have been mixed. This is probably due to: 1) solid cancers have highly complex and heterogeneous micro- environment [15-17], it is impossible to generate two individual tumors with the same or similar microenvi- ronment components and, subsequently, to compare the radiopharmaceuticals uptake in different tumors; 2) tem- poral change of tumor microenvironment may occur in a very short of interval of natural growth process of cancer and metastases, serial PET scans where the same tumor is probed with different tracers, separated by some time interval, are also problematic [18]. Accordingly, a novel test system is highly demand for validation of current and novel targeted radiopharmaceu- ticals for molecular imaging. It is established that solid cancers have highly complex and heterogeneous micro- environment [15-17] composed of viable cancer cells,  X.-F. LI ET AL. 20 stroma, necrosis and many other factors. Viable cancer cells are either hypoxic or well oxygenated [15,16,18,19], the distribution of proliferative cells are also heteroge- neous [8,10,18-21]. In this review, we focused on the dis- cussion of hypoxia, proliferation and perfusion microen- vironment factors of cancer and metastases in animal model and its usefulness in PET tracers validation. We initially introduced the generation of cancer and metas- tases models in nude mice, then characterization of hy- poxia, proliferation, perfusion, stroma and necrosis in cancer and metastasis using histological/immunohisto- chemical techniques, and finally, the relationship of ra- diopharmaceuticals accumulation and microenvironment- tal factors [18]. 2. Animal Models of Cancers and Metastases Models of disseminated microscopic malignant disease may be generated in the lung, bone, liver and peritoneum by intravenous [22-24], left ventricular [22,25], intras- plenic [26] and intraperitoneal [8,18,19,27,28] injection of tumor cells, respectively. We have shown that a model of disseminated microscopic peritoneal and ascites tu- mors was suitable for studying hypoxia [8,18,19,27,28]. In this model, disseminated peritoneal microscopic tu- mor s were induced by injecting suspensions of colorectal HT29 and HCT-8 cancer cells, or non-small cell lung cancer (NSCLC) A549 and HTB177 cells into the peri- toneal cavity of nude mice. Mice sacrificed 4 - 7 weeks after tumor initiation displayed a distribution of tumors of sizes ranging from a few hundred micrometers up to several millimeters in diameter on or in the intestinal serosa (Figure 1). Ascites fluid containing a distribution of free-floating tumor cell aggregates of up to 1 mm in diameter was also present in mice inoculated with HT29, A549 cells, but was not observed in HCT-8 and HTB177 cell lines. Figure 1. HCT-8 rectal cancer cells peritoneal metastases formed 4 wk after intraperitoneal administration of cancer cells, tumors ranged from several hundred micrometers to millimeters in diameter. Intradermal injection of similar tumor cell suspensions could give rise to unitary microscopic tumors useful for studying hypoxia [8,19,27]. An intradermal tumor model has the potential advantage that growth curves for mi- croscopic tumors could be more easily generated via ul- trasound or optical imaging. Subcutaneous xenografts generated by subcutaneously injection of cancer cells are widely used for microPET study. 3. Tumor Microenvironment 3.1. Visualization of Hypoxia, Proliferation, Perfusion and Vasculature Hypoxia microenvironment visualization relies on the detection of either exogenous substances (tracers) that preferentially localizes in hypoxic tissue or the expres- sion of hypoxia-induced endogenous markers [28]. The most commonly used exogenous hypoxia markers, in- cluding pimonidazole, EF5 and CCI-103F, are 2-nitroi- midazole compounds that are selectively reduced in hy- poxic regions (generally pO2 < 10 mmHg) of tumors, subsequently binding to intracellular macromolecules [28, 29]. The spatial pattern of binding of these markers can be visualized on tumor sections by immunohistochemical methods. Exogenous hypoxia markers have been widely used in clinical and experimental studies of tumor hy- poxia [30-33]. Pimonidazole is used to visualize tumor hypoxia in our group, which is generally administrated 1- 2 hours before animal sacrifice. A large number of cellular proteins are regulated by hypoxia. Potential endogenous markers of hypoxia in- clude hypoxia inducible factor 1α (HIF1α), carbonic an- hydrase 9 (CA9) [19] and glucose transporters 1 (GLUT1) [8,28]. The degradation of CA9 is a relatively slow proc- ess with estimated half-times of a few days [19] which would more appropriately indicate “historical” hypoxia. Thus combinations of endogenous protein markers used in conjunction with exogenous tracers can be used to detect changes in tumor hypoxia. Such an approach may be used to monitor the effect of interventions that perturb the intratumoral distribution of hypoxia [8,19]. The cellular proliferation marker bromodeoxyuridine was administered via tail vein injection 1hr before animal sacrifice to detect proliferative cancer cells [8,18,19]. Vas- culature was visualized by Anti-CD31 staining [19,28]. Per- fusion was detected by fluorescent dye Hoechst 33342 which was administered via tail vein injection 1 minute before animal sacrifice [19]. Hematoxylin and eosin (H&E) provided information of viable cancer cells, stroma and necrosis with the tumor section. 3.2. Hypoxia, Proliferation, Perfusion in Microscopic Tumors Disseminated peritoneal disease developed after intrape- Copyright © 2013 SciRes. IJMPCERO  X.-F. LI ET AL. 21 ritoneal inoculation of tumor cells. At the time of assay the gross appearance of peritoneal disease was similar for both cell lines, consisting of a distribution of small tu- mors adhering to the intestinal serosa [8,19,28]. Tumor sizes ranged from a few hundred μm to several mm in diameter. Microscopic examination of peritoneal tumor sections indicated a characteristic relationship between the pattern of hypoxia and tumor size. In general, sub- millimeter tumor deposits (<~1 mm diameter) showed intense pimonidazole staining coupled with low Hoechst 33342 staining (Figure 2(a)). This observation was in- dicative of hypoxic and relatively poorly perfused tumors. Larger tumors (~1 - 4 mm diameter) appeared relatively well perfused with generally low levels of pimonidazole staining. Anti-CD31 staining (Figure 2a) showed a con- trast in tumor vascularity between the tumors of different size with the smallest tumors possessing little to no vas- culature while larger tumors were well-vascularized. bromodeoxyuridine staining indicated that cellular pro- liferation tended to occur in the rim but not the interior of small avascular tumors (Figure 2(b)) whereas it was pre- valent throughout larger tumors [8,19,28]. (a) (b) (c) (d) 3.3. Hypoxia, Proliferation, Perfusion in Microscopic Intradermal Tumors The patterns of hypoxia in intradermal tumors, ranging from a few hundred μm to several millimeters in diame- ter, were examined. Smaller intradermal tumors (<1 mm in diameter) were characterized by a high level of pi- monidazole positivity and little to no visible Hoechst 33342 or CD31 positivity (Figure 2(c)). In HT29 tumors, positive CA9 staining co-localized with pimonidazole. It was also observed that small intradermal tumors gener- ally contained significant central necrosis. In contrast, for larger intradermal tumors (~1 - 4 mm in diameter) pi- monidazole staining appeared less intense, Hoechst 33342 was present throughout, together with significant vascu- larity and minimal necrosis (Figure 2(c)) [19,28]. 3.4. Hypoxia and Perfusion in Ascites Tumors On microscopic examination HT29 ascites tumors ap- peared similar to small avascular HT29 peritoneal tumors of <1 mm in diameter (Figure 2(d)). Ascites tumors stained intensely positive for pimonidazole and CA9 but negative for Hoechst 33342, indicating that they were mostly hypoxic with little to no blood perfusion [8,19,27]. 3.5. Microenvironment of Macroscopic Subcutaneous Tumors Macroscopic subcutaneous tumors have intermingled but clearly defined regions of non-cancer cell stroma, cancer cells and necrosis. Figure 3(a) shows an example of complex microenvironment revealed by H&E imaging Figure 2. Representative images of microscopic HT29 tu- mors. (a) Left: Fluorescence overlay image (green = pimoni- dazole, blue = Hoechst 33342, red = CA9) of a section con- taining a variety of large and small peritoneal tumors. The series of small tumors ≤ 500 μm in dimension situated along a horizontal line through the center of the figure all show intense pimonidazole and CA9 fluorescence, suggesting sig- nificant hypoxia, with little to no Hoechst 33342 fluores- cence. This contrasts with the two large tumor deposits that extend towards the top and bottom of the image which show extensive Hoechst 33342 but little pimonidazole or CA9 fluorescence. Scale bar, 200 μm. (a) Right: Contiguous sec- tion stained for CD31. It can be seen that the small tumors that appear hypoxic in (a) left are essentially avascular whe- reas the large tumors have extensive vasculature. (b) Left: fluorescence overlay image (green = pimonidazole, blue = Hoechst 33342, red = bromodeoxyuridine) of a section con- taining a mixture of small peritoneal tumors of various sizes together with stromal components. Three small deposits with dimensions of approximately 300 μm (indicated on (b) right) all show intense central pimonidazole fluorescence with little to no Hoechst 33342 implying significant hypoxia and low perfusion. Bromodeoxyuridine (red) fluorescence indicating cellular proliferation is seen only in the non-hy- poxic rim and is not present in the hypoxic core. Scale bar, 200 μm; (b) Right: Contiguous section stained with hema- toxylin and eosin provided for reference. (c) Left: Fluores- cence overlay image (green = pimonidazole, blue = Hoechst 33342, red = CA9) of a section containing two intradermal Copyright © 2013 SciRes. IJMPCERO  X.-F. LI ET AL. 22 tumors. The smaller tumor (right) consists of three distinct nodules, each centrally-hypoxic with varying necrosis, sepa- rated by highly perfused zones. The larger tumor (left) ap- pears minimally hypoxic with widespread perfusion throu- ghout. Scale bar, 200 μm; (c) Right: Contiguous section stai- ned for CD31. The hypoxic tumor nodules appear essen- tially avascular while there is significant vascularity seen in the well-perfused stromal elements, between nodules. The larger non-hypoxic tumor has extensive vasculature. (d) Left: fluorescence overlay image (green = pimonidazole, red = CA9) of a section containing a collection of HT29 ascites tumors. Widespread intense staining is observed for both pimonidazole and CA9 implying signifycant hypoxia. Scale bar, 400 μm; (d) Right: Contiguous section stained with he- matoxylin and eosin provided for reference. Figure 2 is adapted from [19]. Stroma N Cancer cells AB Figure 3. Complex microenvironment of HTB177 subcuta- neous xenograft. (a) H&E: the xenograft is composed with stroma, cancer cells and necrosis (N). Scale bar = 1 mm; (b) Fluorescence overlay image of a contiguous section to H&E stained section shows hypoxia, proliferation and blood per- fusion of cancer cells. pimonidazole (green); Hoechst 33342 (blue); bromodeoxyuridine (red). All Scale bars = 1 mm. This research was originally published in JNM. T. Huang, A. C. Civelek, J. Li, H. Jiang, C. K. Ng, G. C. Postel, B. Shen and X. F. Li, “Tumor Microenvironment-Dependent 18F- FDG, 18F-Fluorothymidine, and 18F-Misonidazole Uptake: A Pilot Study in Mouse Models of Human Non-Small Cell Lung Cancer,” Journal of Nuclear Medicine, Vol. 53, 2012, pp. 1262-1268 © by the Society of Nuclear Medicine, Inc. from NSCLC HTB177 subcutaneous xenograft. Cancer cells were further divided into two subcategories accord- ing to oxygenation status and cellular proliferation (Fig- ure 3(b)): cancer cells closely adjacent to functional blood vessels (positive Hoechst 33342 staining) were stained negative for pimonidazole but positive for bro- modeoxyuridine, indicating well oxygenated and highly proliferative. Cancer cells located approximately 150 μm away from functional blood vessels and/or close to ne- crosis were stained positive for pimonidazole but nega- tive for bromodeoxyuridine, which indicated that these cancer cells were hypoxic with low proliferation rate [18]. Apparently, macroscopic solid cancers have complex microenvironment. 3.6. Relationship between Hypoxia and Tumor Size The pimonidazole positive fraction (PPF) was estimated for a range of non-ascites HT29 tumors of various sizes (Figure 4) [19]. This reveals an interesting size-depend- cy of tumor hypoxia. For the smallest peritoneal and in- tradermal tumors PPF was very high, approaching ~90% in tumors of several hundred μm diameter. At these sizes, tumors were relatively avascular. As peritoneal and in- tradermal tumors increased in size, the PPF decreased until in the range of diameters ~1 - 4 mm there was little to no positive pimonidazole staining, indicating little to no tumor hypoxia, coupled with the appearance of tumor vascularization and significant blood perfusion. As tumor size increased further into the diameter range ≥~4 mm, positive pimonidazole staining reappeared in a character- istically perinecrotic distribution pattern that was in- versely correlated with Hoechst 33342-defined perfusion. We have visualized hypoxia, proliferation and perfu- sion in cancer and metastases models. The microenvi- ronment-based model system has been used to validate and test several current PET tracers for imaging glucose metabolism, hypoxia and proliferation by our group [8,18,27]. 4. Examine Radiopharmaceuticals Using the Characterized Model System Such model system may provide a useful means of cor- roborating the validity of purported targeted tracers. There are powerful methods of assessing the microenvi- Figure 4. Scatterplot showing the relationship between tu- mor size and Pimonidazole positive fraction (PPF) for HT29 tumors. ● Peritoneal; ▲ Intradermal; ■ Subcutaneous. Adapted from [19]. Copyright © 2013 SciRes. IJMPCERO  X.-F. LI ET AL. 23 ronmental features of individual microscopic tumors, including their hypoxic status, proliferation and blood perfusion, and relating these to the uptake of radiolabeled tracer. In addition, such models provide a diversity of tumors of differing size and hypoxic status growing in the same animal, thereby reducing or eliminating issues associated with inter-animal variability. To complement the high spatial resolution associated with immunohisto- chemical detection of hypoxia markers, the intratumoral distribution of radiolabeled hypoxia tracers can be de- termined by DAR detection systems. Studies comparing the spatial distributions of radiolabeled tracers and hy- poxia markers have been reported in macroscopic tumors [10,18,34] and microscopic diseases [8,18,27]. 4.1. 18F-FDG 18F-FDG PET has emerged as an important clinical tool for cancer detection, staging, and monitoring of response and is routinely used in the clinical management of sev- eral cancer types [35]. The uptake of 18F-FDG, an analog of glucose, is largely proportional to the rate of glucose metabolism enabling this parameter to be quantified [36]. In hypoxic conditions, cancer cells may undergo a switch from aerobic to anaerobic glucose metabolism. This adaptive response involves the coordinated expression of many hypoxia inducible factor (HIF)-regulated proteins, such as GLUT-1, and various glycolytic enzymes [37]. Glucose metabolism in hypoxic cancer cells has been studied in cell culture and in animal models of macro- scopic tumors (reviewed in [36]), however, results have been mixed and controversial. We have recently reported the use of correlative im- aging methodologies to examine the uptake of 18F-FDG in microscopic [8] and macroscopic [18] tumors and re- late this to hypoxic status. 18F-FDG uptake by DAR was compared with immunofluorescent visualization of pi- monidazole binding and GLUT-1 expression. We have also reported that 18F-FDG uptake in microscopic tumors was altered by carbogen breathing [8]. 18F-FDG uptake in disseminated peritoneal disease arising from HT29, HCT-8, A549 and HTB177 tumor cells was studied in air-breathing animals [8,18]. As shown in Figure 5, there was spatial co-localization be- tween high levels of 18F-FDG uptake, pimonidazole binding and GLUT-1 expression. Such regions tended to correspond to low levels of cellular proliferation and blood perfusion. In particular, the smallest tumor depo- sits (<~1 mm diameter) were hypoxic (as evidenced by high pimonidazole binding) and had high 18F-FDG up- take. In these tumors GLUT-1 expression was high, bro- modeoxyuridine staining was confined to the rim and blood perfusion was minimal. Larger tumors (~1 - 4 mm diameter) were not hypoxic (low pimonidazole binding) and displayed relatively low 18F-FDG uptake and GLUT- 1 expression. Additionally, bromodeoxyuridine-positive proliferative cells were distributed throughout the larger tumors and blood perfusion was relatively high. Carbogen breathing significantly decreased 18F-FDG accumulation and tumor hypoxia in microscopic tumors but had little effect on GLUT1 expression (Figure 6) [8]. 18F-FDG uptake in subcutaneous xenografts was also observed. High 18F-FDG uptake was found in hypoxic zones but low 18F-FDG uptake in well perfused cancer cells, non-cancerous stroma and necrosis (Figure 7) [18]. Therefore, 18F-FDG uptake was significantly increased in microscopic tumors and only hypoxic regions of mac- roscopic tumors. This enhanced uptake could be abro- gated by carbogen breathing; physiological hypoxia was a necessary condition for increased 18F-FDG uptake. 4.2. Radioiodine-Labeled-Iodoazomycin Galactopyranoside and 18F-FMISO Radiolabeled tracers such as 18F-FMISO [38-40] and 124I- labelled iodo-azomycin galactopyranoside (124I-IAZGP) [41-43]. amongst others are under investigation for in vivo PET imaging of tumor hypoxia. We have recently reported the use of correlative imaging methodologies to examine the uptake of IAZGP and 18F-FMISO in micro- scopic [18,27] and macroscopic [18] tumors and related this to microenviromental factors. Figure 8 shows an example of the intratumoral distri- butions of 131I-IAZGP, pimonidazole binding and CA9 H&E PIMO BrdUrd 18 F-FDG GLUT-1 Hoechst Figure 5. 18F-FDG uptake in HT29 peritoneal tumors in air breathing condition. Part of a larger tumor (square) has relatively low levels of 18F-FDG uptake, pimonidazole bind- ing, and GLUT-1 expression, with relatively high levels of cell proliferation and blood perfusion. A microscopic tumor (circle) has relatively high FDG uptake, pimonidazole bind- ing and GLUT-1 with lower cell proliferation and little perfusion. Scale bar 1 mm. This research was originally published in JNM. X. F. Li, Y. Ma, X. Sun, J. L.Humm, C. C. Ling and J. A. O’Donoghue, “High 18F-FDG Uptake in Microscopic Peritoneal Tumors Requires Physiologic Hy- poxia,” Journal of Nuclear Medicine, Vol. 5, 2010, pp. 632-638 © by the Society of Nuclear Medicine, Inc. Copyright © 2013 SciRes. IJMPCERO 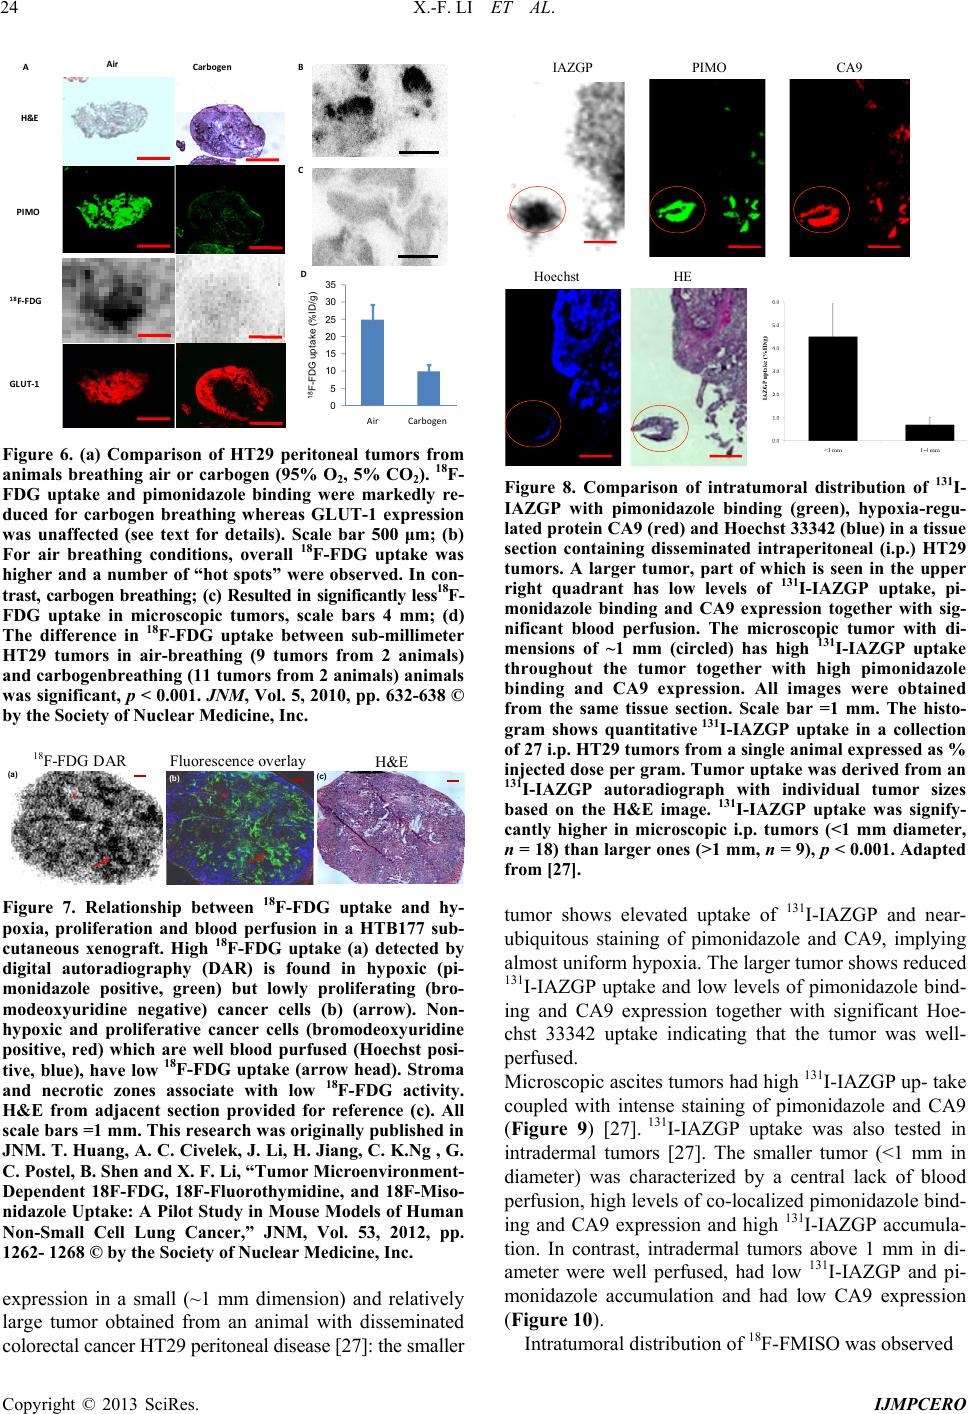 X.-F. LI ET AL. 24 H&E GLUT-1 PIMO 18 F-FDG Air Carbogen A D B C 0 5 10 15 20 25 30 35 18 F- F DG uptake (%I D/g) IAZGP PIMO CA9 Hoechst HE AirCarbogen Figure 6. (a) Comparison of HT29 peritoneal tumors from animals breathing air or carbogen (95% O2, 5% CO2). 18F- FDG uptake and pimonidazole binding were markedly re- duced for carbogen breathing whereas GLUT-1 expression was unaffected (see text for details). Scale bar 500 μm; (b) For air breathing conditions, overall 18F-FDG uptake was higher and a number of “hot spots” were observed. In con- trast, carbogen breathing; (c) Resulted in significantly less18F- FDG uptake in microscopic tumors, scale bars 4 mm; (d) The difference in 18F-FDG uptake between sub-millimeter HT29 tumors in air-breathing (9 tumors from 2 animals) and carbogenbreathing (11 tumors from 2 animals) animals was significant, p < 0.001. JNM, Vol. 5, 2010, pp. 632-638 © by the Society of Nuclear Medicine, Inc. (a) (b) (c) 18 F-FDG DAR Fluorescence overlay H&E Figure 7. Relationship between 18F-FDG uptake and hy- poxia, proliferation and blood perfusion in a HTB177 sub- cutaneous xenograft. High 18F-FDG uptake (a) detected by digital autoradiography (DAR) is found in hypoxic (pi- monidazole positive, green) but lowly proliferating (bro- modeoxyuridine negative) cancer cells (b) (arrow). Non- hypoxic and proliferative cancer cells (bromodeoxyuridine positive, red) which are well blood purfused (Hoechst posi- tive, blue), have low 18F-FDG uptake (arrow head). Stroma and necrotic zones associate with low 18F-FDG activity. H&E from adjacent section provided for reference (c). All scale bars =1 mm. This research was originally published in JNM. T. Huang, A. C. Civelek, J. Li, H. Jiang, C. K.Ng , G. C. Postel, B. Shen and X. F. Li, “Tumor Microenvironment- Dependent 18F-FDG, 18F-Fluorothymidine, and 18F-Miso- nidazole Uptake: A Pilot Study in Mouse Models of Human Non-Small Cell Lung Cancer,” JNM, Vol. 53, 2012, pp. 1262- 1268 © by the Society of Nuclear Medicine, Inc. expression in a small (~1 mm dimension) and relatively large tumor obtained from an animal with disseminated colorectal cancer HT29 peritoneal disease [27]: the smaller Figure 8. Comparison of intratumoral distribution of 131I- IAZGP with pimonidazole binding (green), hypoxia-regu- lated protein CA9 (red) and Hoechst 33342 (blue) in a tissue section containing disseminated intraperitoneal (i.p.) HT29 tumors. A larger tumor, part of which is seen in the upper right quadrant has low levels of 131I-IAZGP uptake, pi- monidazole binding and CA9 expression together with sig- nificant blood perfusion. The microscopic tumor with di- mensions of ~1 mm (circled) has high 131I-IAZGP uptake throughout the tumor together with high pimonidazole binding and CA9 expression. All images were obtained from the same tissue section. Scale bar =1 mm. The histo- gram shows quantitative 131I-IAZGP uptake in a collection of 27 i.p. HT29 tumors from a single animal expressed as % injected dose per gram. Tumor uptake was derived from an 131I-IAZGP autoradiograph with individual tumor sizes based on the H&E image. 131I-IAZGP uptake was signify- cantly higher in microscopic i.p. tumors (<1 mm diameter, n = 18) than larger ones (>1 mm, n = 9), p < 0.001. Adapted from [27]. tumor shows elevated uptake of 131I-IAZGP and near- ubiquitous staining of pimonidazole and CA9, implying almost uniform hypoxia. The larger tumor shows reduced 131I-IAZGP uptake and low levels of pimonidazole bind- ing and CA9 expression together with significant Hoe- chst 33342 uptake indicating that the tumor was well- perfused. Microscopic ascites tumors had high 131I-IAZGP up- take coupled with intense staining of pimonidazole and CA9 (Figure 9) [27]. 131I-IAZGP uptake was also tested in intradermal tumors [27]. The smaller tumor (<1 mm in diameter) was characterized by a central lack of blood perfusion, high levels of co-localized pimonidazole bind- ing and CA9 expression and high 131I-IAZGP accumula- tion. In contrast, intradermal tumors above 1 mm in di- ameter were well perfused, had low 131I-IAZGP and pi- monidazole accumulation and had low CA9 expression (Figure 10). Intratumoral distribution of 18F-FMISO was observed Copyright © 2013 SciRes. IJMPCERO 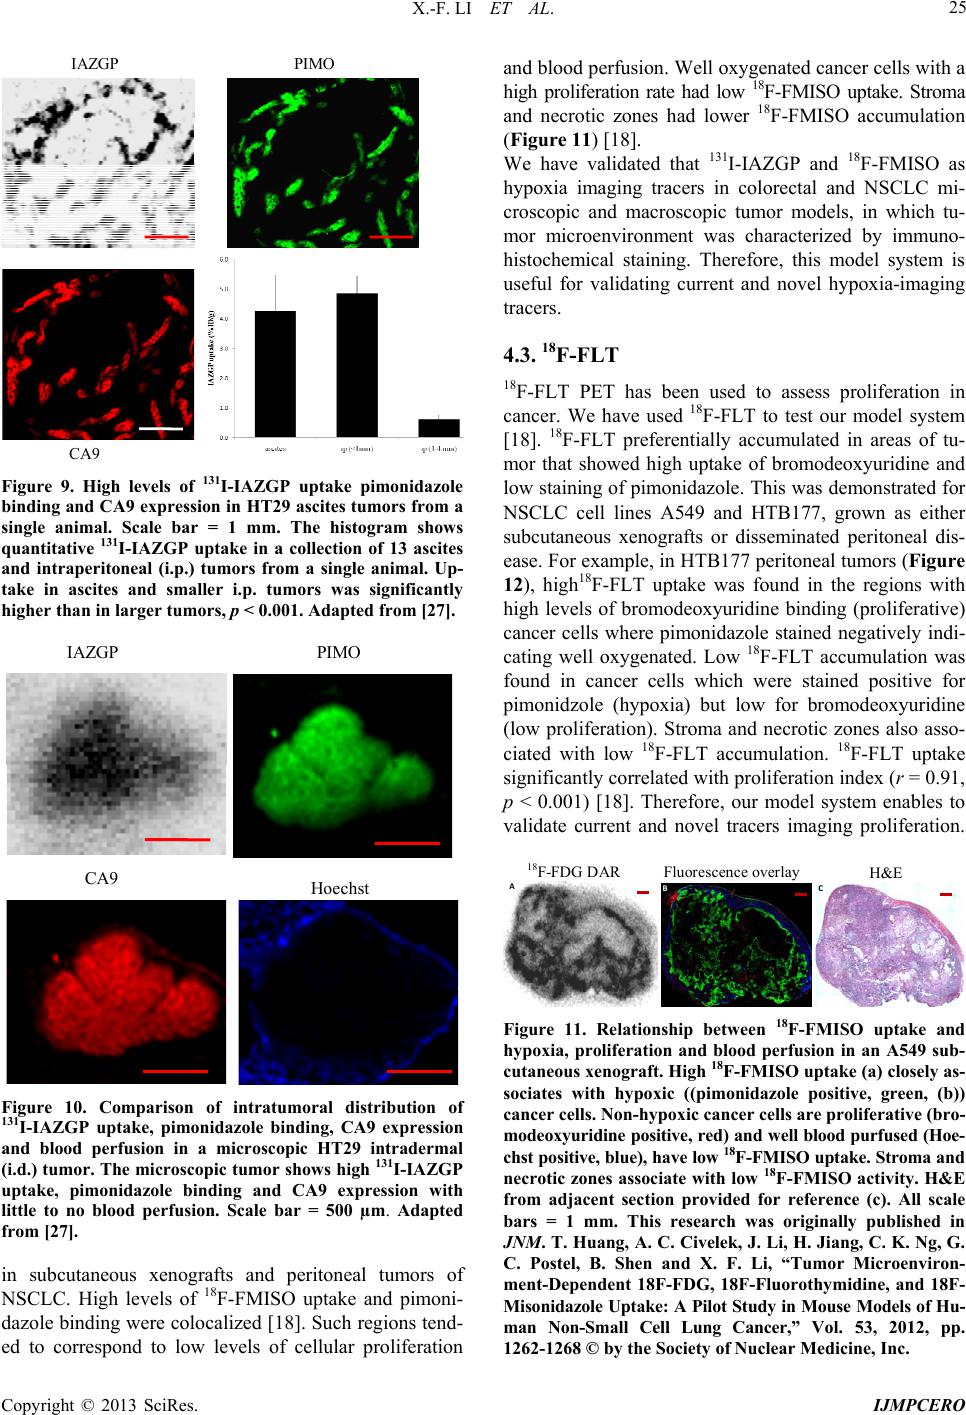 X.-F. LI ET AL. 25 PIMO CA9 IAZGP Figure 9. High levels of 131I-IAZGP uptake pimonidazole binding and CA9 expression in HT29 ascites tumors from a single animal. Scale bar = 1 mm. The histogram shows quantitative 131I-IAZGP uptake in a collection of 13 ascites and intraperitoneal (i.p.) tumors from a single animal. Up- take in ascites and smaller i.p. tumors was significantly higher than in larger tumors, p < 0.001. Adapted from [27]. Hoech PIMO CA9 IAZGP st Figure 10. Comparison of intratumoral distribution of 131I-IAZGP uptake, pimonidazole binding, CA9 expression and blood perfusion in a microscopic HT29 intradermal (i.d.) tumor. The microscopic tumor shows high 131I-IAZGP uptake, pimonidazole binding and CA9 expression with little to no blood perfusion. Scale bar = 500 µm. Adapted from [27]. in subcutaneous xenografts and peritoneal tumors of NSCLC. High levels of 18F-FMISO uptake and pimoni- dazole binding were colocalized [18]. Such regions tend- ed to correspond to low levels of cellular proliferation and blood perfusion. Well oxygenated cancer cells with a high proliferation rate had low 18F-FMISO uptake. Stroma and necrotic zones had lower 18F-FMISO accumulation (Figure 11) [18]. We have validated that 131I-IAZGP and 18F-FMISO as hypoxia imaging tracers in colorectal and NSCLC mi- croscopic and macroscopic tumor models, in which tu- mor microenvironment was characterized by immuno- histochemical staining. Therefore, this model system is useful for validating current and novel hypoxia-imaging tracers. 4.3. 18F-FLT 18F-FLT PET has been used to assess proliferation in cancer. We have used 18F-FLT to test our model system [18]. 18F-FLT preferentially accumulated in areas of tu- mor that showed high uptake of bromodeoxyuridine and low staining of pimonidazole. This was demonstrated for NSCLC cell lines A549 and HTB177, grown as either subcutaneous xenografts or disseminated peritoneal dis- ease. For example, in HTB177 peritoneal tumors (Figure 12), high18F-FLT uptake was found in the regions with high levels of bromodeoxyuridine binding (proliferative) cancer cells where pimonidazole stained negatively indi- cating well oxygenated. Low 18F-FLT accumulation was found in cancer cells which were stained positive for pimonidzole (hypoxia) but low for bromodeoxyuridine (low proliferation). Stroma and necrotic zones also asso- ciated with low 18F-FLT accumulation. 18F-FLT uptake significantly correlated with proliferation index (r = 0.91, p < 0.001) [18]. Therefore, our model system enables to validate current and novel tracers imaging proliferation. 18F-FDG DAR Fluorescence overlay H&E ABC Figure 11. Relationship between 18F-FMISO uptake and hypoxia, proliferation and blood perfusion in an A549 sub- cutaneous xenograft. High 18F-FMISO uptake (a) closely as- sociates with hypoxic ((pimonidazole positive, green, (b)) cancer cells. Non-hypoxic cancer cells are proliferative (bro- modeoxyuridine positive, red) and well blood purfused (Hoe- chst positive, blue), have low 18F-FMISO uptake. Stroma and necrotic zones associate with low 18F-FMISO activity. H&E from adjacent section provided for reference (c). All scale bars = 1 mm. This research was originally published in JNM. T. Huang, A. C. Civelek, J. Li, H. Jiang, C. K. Ng, G. C. Postel, B. Shen and X. F. Li, “Tumor Microenviron- ment-Dependent 18F-FDG, 18F-Fluorothymidine, and 18F- Misonidazole Uptake: A Pilot Study in Mouse Models of Hu- man Non-Small Cell Lung Cancer,” Vol. 53, 2012, pp. 1262-1268 © by the Society of Nuclear Medicine, Inc. Copyright © 2013 SciRes. IJMPCERO 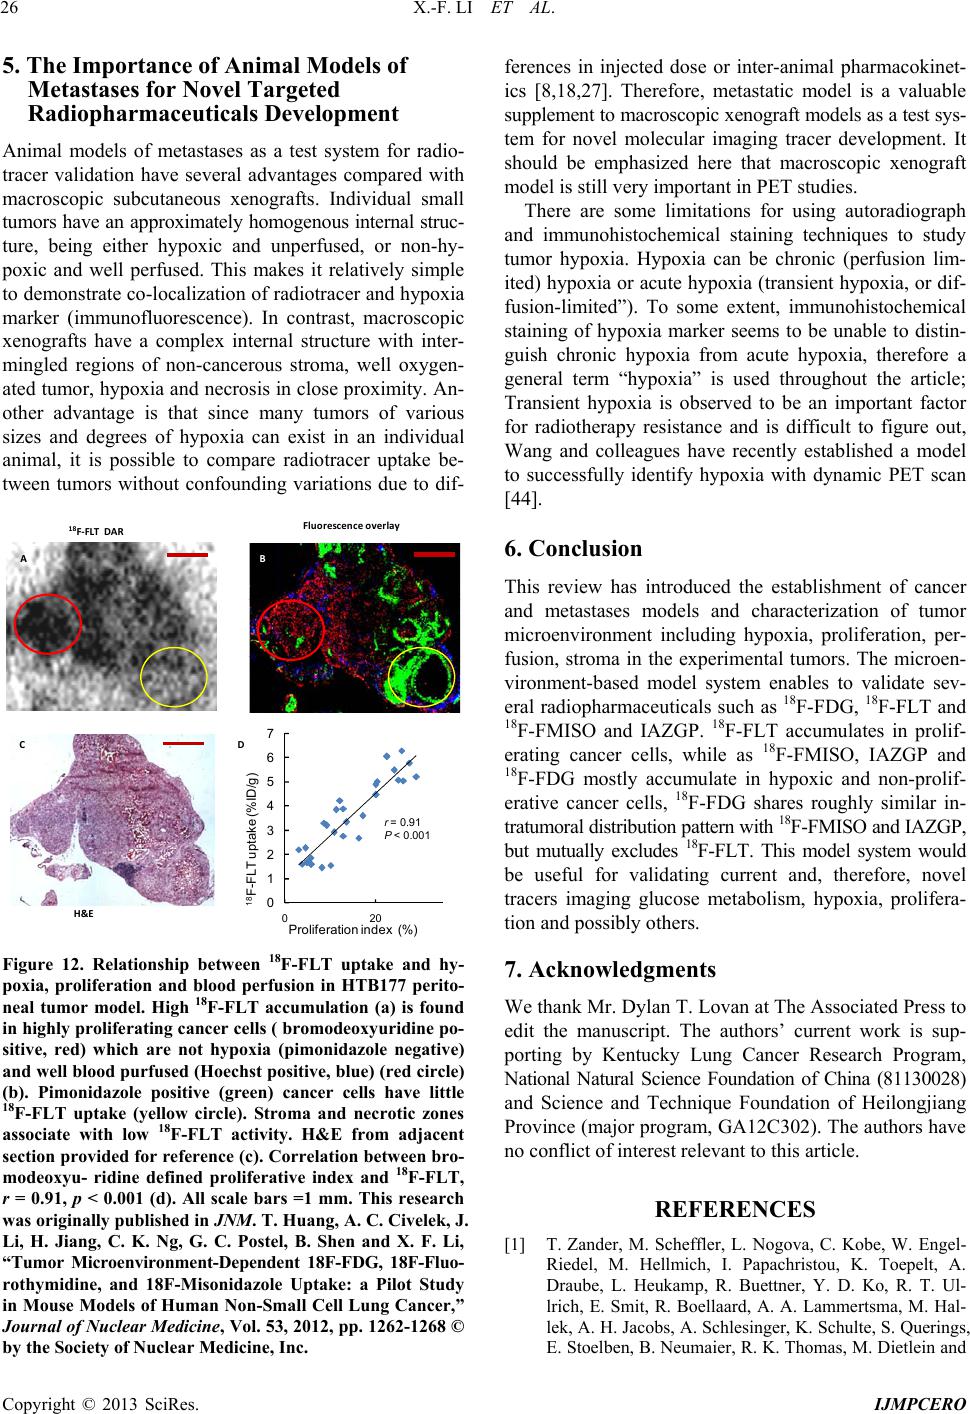 X.-F. LI ET AL. 26 5. The Importance of Animal Models of Metastases for Novel Targeted Radiopharmaceuticals Development Animal models of metastases as a test system for radio- tracer validation have several advantages compared with macroscopic subcutaneous xenografts. Individual small tumors have an approximately homogenous internal struc- ture, being either hypoxic and unperfused, or non-hy- poxic and well perfused. This makes it relatively simple to demonstrate co-localization of radiotracer and hypoxia marker (immunofluorescence). In contrast, macroscopic xenografts have a complex internal structure with inter- mingled regions of non-cancerous stroma, well oxygen- ated tumor, hypoxia and necrosis in close proximity. An- other advantage is that since many tumors of various sizes and degrees of hypoxia can exist in an individual animal, it is possible to compare radiotracer uptake be- tween tumors without confounding variations due to dif- H&E 18 F-FLT DARFluorescence overlay AB C 0 1 2 3 4 5 6 7 18 F-FL T uptake (%ID/g) Proliferati D 020 on i ndex (%) r = 0.91 P < 0.001 Figure 12. Relationship between 18F-FLT uptake and hy- poxia, proliferation and blood perfusion in HTB177 perito- neal tumor model. High 18F-FLT accumulation (a) is found in highly proliferating cancer cells ( bromodeoxyuridine po- sitive, red) which are not hypoxia (pimonidazole negative) and well blood purfused (Hoechst positive, blue) (red circle) (b). Pimonidazole positive (green) cancer cells have little 18F-FLT uptake (yellow circle). Stroma and necrotic zones associate with low 18F-FLT activity. H&E from adjacent section provided for reference (c). Correlation between bro- modeoxyu- ridine defined proliferative index and 18F-FLT, r = 0.91, p < 0.001 (d). All scale bars =1 mm. This research was originally published in JNM. T. Huang, A. C. Civelek, J. Li, H. Jiang, C. K. Ng, G. C. Postel, B. Shen and X. F. Li, “Tumor Microenvironment-Dependent 18F-FDG, 18F-Fluo- rothymidine, and 18F-Misonidazole Uptake: a Pilot Study in Mouse Models of Human Non-Small Cell Lung Cancer,” Journal of Nuclear Medicine, Vol. 53, 2012, pp. 1262-1268 © by the Society of Nuclear Medicine, Inc. ferences in injected dose or inter-animal pharmacokinet- ics [8,18,27]. Therefore, metastatic model is a valuable supplement to macroscopic xenograft models as a test sys- tem for novel molecular imaging tracer development. It should be emphasized here that macroscopic xenograft model is still very important in PET studies. There are some limitations for using autoradiograph and immunohistochemical staining techniques to study tumor hypoxia. Hypoxia can be chronic (perfusion lim- ited) hypoxia or acute hypoxia (transient hypoxia, or dif- fusion-limited”). To some extent, immunohistochemical staining of hypoxia marker seems to be unable to distin- guish chronic hypoxia from acute hypoxia, therefore a general term “hypoxia” is used throughout the article; Transient hypoxia is observed to be an important factor for radiotherapy resistance and is difficult to figure out, Wang and colleagues have recently established a model to successfully identify hypoxia with dynamic PET scan [44]. 6. Conclusion This review has introduced the establishment of cancer and metastases models and characterization of tumor microenvironment including hypoxia, proliferation, per- fusion, stroma in the experimental tumors. The microen- vironment-based model system enables to validate sev- eral radiopharmaceuticals such as 18F-FDG, 18F-FLT and 18F-FMISO and IAZGP. 18F-FLT accumulates in prolif- erating cancer cells, while as 18F-FMISO, IAZGP and 18F-FDG mostly accumulate in hypoxic and non-prolif- erative cancer cells, 18F-FDG shares roughly similar in- tratumoral distribution pattern with 18F-FMISO and IAZGP, but mutually excludes 18F-FLT. This model system would be useful for validating current and, therefore, novel tracers imaging glucose metabolism, hypoxia, prolifera- tion and possibly others. 7. Acknowledgments We thank Mr. Dylan T. Lovan at The Associated Press to edit the manuscript. The authors’ current work is sup- porting by Kentucky Lung Cancer Research Program, National Natural Science Foundation of China (81130028) and Science and Technique Foundation of Heilongjiang Province (major program, GA12C302). The authors have no conflict of interest relevant to this article. REFERENCES [1] T. Zander, M. Scheffler, L. Nogova, C. Kobe, W. Engel- Riedel, M. Hellmich, I. Papachristou, K. Toepelt, A. Draube, L. Heukamp, R. Buettner, Y. D. Ko, R. T. Ul- lrich, E. Smit, R. Boellaard, A. A. Lammertsma, M. Hal- lek, A. H. Jacobs, A. Schlesinger, K. Schulte, S. Querings, E. Stoelben, B. Neumaier, R. K. Thomas, M. Dietlein and Copyright © 2013 SciRes. IJMPCERO  X.-F. LI ET AL. 27 J. Wolf, “Early Prediction of Nonprogression in Advan- ced Non-Small-Cell Lung Cancer Treated with Erlotinib by Using [18F] Fluorodeoxyglucose and [18F]Fluorothy- midine Positron Emission Tomography,” Journal of Cli- nical Oncology, Vol. 29, No. 13, 2011, pp. 1701-1708. doi:10.1200/JCO.2010.32.4939 [2] V. Frings, A. J. de Langen, E. F. Smit, F. H. van Velden, O. S. Hoekstra, H. van Tinteren and R. Boellaard, “Re- peatability of Metabolically Active Volume Measure- ments with 18F-FDG and 18F-FLT PET in Non-Small Cell Lung Cancer,” Journal of Nuclear Medicine, Vol. 51, No. 12, 2010, pp. 1870-1877. doi:10.2967/jnumed.110.077255 [3] P. Vera, P. Bohn, A. Edet-Sanson, A. Salles, S. Hapdey, I. Gardin, J. F. Ménard, R. Modzelewski, L. Thiberville and B. Dubray, “Simultaneous Positron Emission Tomogra- phy (PET) Assessment of Metabolism with 18F-Fluoro-2- Deoxy-D-Glucose (FDG), Proliferation with 18F-Fluoro- Thymidine (FLT), and Hypoxia with 18Fluoro-Misoni- dazole (F-Miso) before and during Radiotherapy in Pa- tients with Non-Small-Cell Lung Cancer (NSCLC): A Pilot Study,” Radiotherapy and Oncology, Vol. 98, No. 1, 2011, pp. 109-116. doi:10.1016/j.radonc.2010.10.011 [4] W. Yang, Y. Zhang, Z.Fu, J. Yu, X. Sun, D. Mu and A. Han, “Imaging of Proliferation with 18F-FLT PET/CT Versus 18F-FDG PET/CT in Non-Small-Cell Lung Can- cer,” European Journal of Nuclear Medicine and Mole- cular, Vol. 37, No. 7, 2010, pp. 1291-1299. doi:10.1007/s00259-010-1412-6 [5] Y. Yamamoto, Y. Nishiyama, S. Ishikawa, J Nakano, S. S. Chang, S. Bandoh, N. Kanaji, R. Haba, Y. Kushida and M. Ohkawa, “Correlation of 18F-FLT and 18F-FDG Up- take on PET with Ki-67 Immunohistochemistry in Non- Small Cell Lung Cancer,”European Journal of Nuclear Medicine and Molecular, Vol. 34, No. 10, 2007, pp. 1610-1616. doi:10.1007/s00259-007-0449-7 [6] S. A. Nehmeh, N. Y. Lee, H. Schröder, O. Squire, P. B. Zanzonico, Y. E. Erdi, C. Greco, G. Mageras, H. S. Pham, S. M. Larson, C. C. Ling and J. L. Humm, “Reproducibi- lity of Intratumor Distribution of 18F-Fluoromisonidazole in Head and Neck Cancer,” International Journal of Ra- diation Oncology, Biology, Physics, Vol. 70, No. 1, 2008, pp. 235-242. doi:10.1016/j.ijrobp.2007.08.036 [7] A. K. Buck, G. Halter, H. Schirrmeister, J. Kotzerke, I. Wurziger, G. Glatting, T. Mattfeldt, B. Neumaier, S. N. Reske and M. Hetzel, “Imaging Proliferation in Lung Tu- mors with PET: 18F-FLT versus 18F-FDG,” Journal of Nuclear Medicine, Vol. 44, No. 9, 2003, pp. 1426-1431. [8] X. F. Li, Y. Ma, X Sun, J. L. Humm, C. C. Ling and J. A. O’Donoghue, “High 18F-FDG Uptake in Microscopic Pe- ritoneal Tumors Requires Physiologic Hypoxia,” Journal of Nuclear Medicine, Vol. 51, No. 4, 2010, pp. 632-638. doi:10.2967/jnumed.109.071233 [9] P. Burgman, J. A. O’Donoghue, J. L. Humm and C. C. Ling, “Hypoxia-Induced Increase in FDG Uptake in MCF7 Cells,” Journal of Nuclear Medicine, Vol. 42, No. 1, 2001, pp. 170-175. [10] A. Pugachev, S. Ruan, S. Carlin, S. M. Larson, J. Campa, C. C. Ling and J. L. Humm, “Dependence of FDG Uptake on Tumor Microenvironment,” International Journal of Radiation Oncology, Biology, Physics, Vol. 62, No. 2, 2005, pp. 545-553. doi:10.1016/j.ijrobp.2005.02.009 [11] T. Tanaka, T. Furukawa, S. Fujieda, S. Kasamatsu, Y. Yonekura and Y. Fujibayashi, “Double-Tracer Autora- diography with Cu-ATSM/FDG and Immunohistochemi- cal Interpretation in Four Different Mouse Implanted Tu- mor Models,” Nuclear Medicine and Biology, Vol. 33, No. 6, 2006, pp. 743-750. doi:10.1016/j.nucmedbio.2006.05.005 [12] P. Zanzonico, J. Campa, D. Polycarpe-Holman, G. For- ster, R. Finn, S. Larson, J. Humm and C. Ling, “Ani-mal- Specific Positioning Molds for Registration of Repeat Imaging Studies: Comparative Micropet Imaging of F18- Labeled Fluoro-Deoxyglucose and Fluoro-Misonidazole in Rodent Tumors,” Nuclear Medicine and Biology, Vol. 33, No. 1, 2006, pp. 65-70. doi:10.1016/j.nucmedbio.2005.07.011 [13] C. S. Dence, D. E. Ponde, M. J. Welch and J. S. Lewis, “Autoradiographic and Small-Animal PET Comparisons between 18F-FMISO, 18FFDG, 18F-FLT and the Hypoxic Selective 64Cu-ATSM in a Rodent Model of Cancer,” Nuclear Medicine and Biology, Vol. 35, No. 6, 2008, pp. 713-720. doi:10.1016/j.nucmedbio.2008.06.001 [14] E. G. Troost, P. Laverman, M. E. Philippens, J. Lok, A. J. van der Kogel, W. J. Oyen, O. C. Boerman, J. H. Kaan- ders and J. Bussink, “Correlation of [18F]FMISO Autora- diography and Pimonidazole Immunohistochemistry in Human Head and Neck Carcinoma Xenografts,” Euro- pean Journal of Nuclear Medicine and Molecular, Vol. 35, No. 10, 2008, pp. 1803-1811. doi:10.1007/s00259-008-0772-7 [15] R. H. Thomlinson and L. H. Gray, “The Histological Struc- ture of Some Human Lung Cancers and the Possible Im- plications for Radiotherapy,” British Journal of Cancer, Vol. 9, No. 4, 1955, pp. 539-549. doi:10.1038/bjc.1955.55 [16] E. E. Graves, A. Maity and Q. T. Le, “the Tumor Mic- roenvironment in Non-Small Cell Lung Cancer,” Semi- nars in Radiation Oncology, Vol. 20, No. 3, 2010, pp. 156-163. doi:10.1016/j.semradonc.2010.01.003 [17] D. Hanahan and R. A. Weinberg, “Hallmarks of Cancer: The Next Generation,” Ce ll , Vol. 144, No. 5, 201, pp. 646-674. [18] T. Huang, A. C. Civelek, J. Li, H. Jiang, C. K. Ng, G. C. Postel, B. Shen and X. F. Li, “Tumor Microenvironment- Dependent 18F-FDG, 18F-Fluorothymidine, and 18F-Miso- nidazole Uptake: A Pilot Study in Mouse Models of Hu- man Non-Small Cell Lung Cancer,” Journal of Nuclear Medicine, Vol. 53,No. 8, 2012, pp. 1262-1268. doi:10.2967/jnumed.111.098087 [19] X. F. Li, S. Carlin, M. Urano, J. Russell, C. C. Ling and J. A. O’Donoghue, “Visualization of Hypoxia in Microsco- pic Tumors by Immunofluorescent Microscopy,” Cancer Research, Vol. 67, No. 16, 2007, pp. 7646-7653. doi:10.1158/0008-5472.CAN-06-4353 [20] A. S. Kennedy, J. A. Raleigh, G. M. Perez, D. P. Calkins, D. E. Thrall, D. B. Novotny and M. A. Varia, “Proli- feration and Hypoxia in Human Squamous Cell Carci- noma of the Cervix: First Report of Combined Immu- nohistochemical Assays,” International Journal of Radi- ation Oncology, Biology, Physics, Vol. 37, No. 4,1997, Copyright © 2013 SciRes. IJMPCERO  X.-F. LI ET AL. 28 pp. 897-905. doi:10.1016/S0360-3016(96)00539-1 [21] R. E. Durand and J. A. Raleigh, “Identification of Non- proliferating but Viable Hypoxic Tumor Cells in Vivo,” Cancer Research, Vol. 58, No. 16, 1998, pp. 3547-3550. [22] X. F. Li, P Zanzonico, C. C. Ling and J. O’Donoghue, “Visualization of Experimental Lung and Bone Metas- tases in Live Nude Mice by X-Ray Micro-Computed To- mography,” Technology in Cancer Research and Treat- ment , Vol. 5, No. 2, 2006, pp. 147-155. [23] M. D. Cameron, E. E. Schmidt, N. Kerkvliet, K. V. Nad- karni, V. L. Morris, A. C. Groom, A. F. Chambers and I. C. MacDonald, “Temporal Progression of Metastasis in Lung: Cell Survival, Dormancy, and Location Depen- dence of Metastatic Inefficiency,” Cancer Research, Vol. 60, No. 9, 2000, pp. 2541-2546. [24] Y. Maniwa, M. Okada, N. Ishii and K. Kiyooka, “Vas- cular Endothelial Growth Factor Increased by Pulmonary Surgery Accelerates the Growth of Micrometastases in Metastatic Lung Cancer,” Chest, Vol. 114, No. 6, 1998, pp. 1668-1675. doi:10.1378/chest.114.6.1668 [25] T. Hiraga, S. Kizaka-Kondoh, K. Hirota, M. Hiraoka and T. Yoneda, “Hypoxia and Hypoxia-Inducible Factor-1 Expression Enhance Osteolytic Bone Metastases of Bre- ast Cancer,” Cancer Research, Vol. 67, No. 9, 2007, pp. 4157-4563. doi:10.1158/0008-5472.CAN-06-2355 [26] X. F. Li, S. Kinuya, K. Yokoyama, K. Koshida, H. Mori, K. Shiba, N. Watanabe, N. Shuke, T. Michigishi and N. Tonami, “Benefits of Combined Radioimmunotherapy and Anti-Angiogenic Therapy in a Liver Metastasis Model of Human Colon Cancer Cells,”European Journal of Nuc- lear Medicine and Molecular, Vol. 29, No. 12, 2002, pp. 1669-1674. doi:10.1007/s00259-002-0997-9 [27] X. F. Li, X. Sun, Y. Ma, M. Suehiro, M. Zhang, J. Russell, J. L. Humm, C. C. Ling and J. A. O’Donoghue, “De- tection of Hypoxia in Microscopic Tumors Using 131I- Labeled Iodo-Azomycin Galactopyranoside (131I-IAZGP) Digital Autoradiography,”European Journal of Nuclear Medicine and Molecular, Vol. 37, No. 2, 2010, pp. 339- 348. doi:10.1007/s00259-009-1310-y [28] X. F. Li and J. A. O’Donoghue, “Hypoxia in Microscopic Tumors,” Cancer Letters, Vol. 264, No. 2, 2008, pp. 172- 180. doi:10.1016/j.canlet.2008.02.037 [29] A. S. Ljungkvist, J. Bussink, J. H. Kaanders, P. F. Rijken, A. C. Begg, J. A. Raleigh and A. J. van der Kogel, “Hy- poxic Cell Turnover in Different Solid Tumor Lines,” International Journal of Radiation Oncology, Biology, Physics, Vol. 62, No. 4, 2005, pp. 1157-168. doi:10.1016/j.ijrobp.2005.03.049 [30] J. A. Raleigh, S. C. Chou, G. E. Arteel and M. R. Hor- sman, “Comparisons among Pimonidazole Binding, Oxy- gen Electrode Measurements, and Radiation Response in C3H Mouse Tumors,” Radiation Research, Vol. 151, No. 5, 1999, pp. 580-589. doi:10.2307/3580034 [31] J. H. Kaanders, K. I. Wijffels, H. A. Marres, A. S. Ljung- kvist, L. A. Pop, F. J. van den Hoogen, P. C. de Wilde, J. Bussink, J. A. Raleigh and A. J. van der Kogel, “Pimoni- dazole Binding and Tumor Vascularity Predict for Treat- ment Outcome in Head and Neck Cancer,” Cancer Re- search, Vol. 62, No. 23, 2002, pp. 7066-7074. [32] J. A. Raleigh, D. P. Calkins-Adams, L. H. Rinker, C. A. Ballenger, M. C. Weissler, W. C. Fowler Jr., D. B. Novot- ny and M. A. Varia, “Hypoxia and Vascular Endothelial Growth Factor Expression in Human Squamous Cell Car- cinomas Using Pimonidazole as a Hypoxia Marker,” Cancer Research, Vol. 58, No. 17, 1998, pp. 3765-3768. [33] A. S. Ljungkvist, J. Bussink, P. F. Rijken, J. A. Raleigh, J. Denekamp and A. J. Van Der Kogel, “Changes in Tumor Hypoxia Measured with a Double Hypoxic Marker Tech- nique,” International Journal of Radiation Oncology, Biology, Physics, Vol. 48, No. 5, 2000, pp. 1529-1538. doi:10.1016/S0360-3016(00)00787-2 [34] J. A. O’Donoghue, P. Zanzonico, A. Pugachev, B. Wen, P. Smith-Jones, S. Cai, E. Burnazi, R. D. Finn, P. Bur- gman, S. Ruan, J. S. Lewis, M. J. Welch, C. C. Ling and J. L. Humm, “Assessment of Regional Tumor Hypoxia Us- ing 18F-Fluoromisonidazole and 64Cu(II)-Diacetyl-Bis (N4-Methylthiosemicarbazone) Positron Emission Tomo- graphy: Comparative Study Featuring Micropet Imaging, Po2 Probe Measurement, Autoradiography, and Fluore- scent Microscopy in the R3327-AT and FaDu Rat Tumor Models,” International Journal of Radiation Oncology, Biology, Physics, Vol. 61, No. 5, 2005, pp. 1493-1502. doi:10.1016/j.ijrobp.2004.12.057 [35] S. Ben-Haim and P. Ell, “18F-FDG PET and PET/CT in the Evaluation of Cancer Treatment Response,” Journal of Nuclear Medicine, Vol. 50, No. 1, 2009, pp. 88-99. doi:10.2967/jnumed.108.054205 [36] R. A. Dierckx and C. Van de Wiele, “FDG Uptake, a Surrogate of Tumour Hypoxia?” European Journal of Nuclear Medicine and Molecular, Vol. 35, No. 8, 2008, pp. 1544-1549. doi:10.1007/s00259-008-0758-5 [37] G. L. Semenza, “Targeting HIF-1 for Cancer Therapy,” Nature Reviews Cancer, Vol. 3, No. 10, 2003, pp. 721- 732. doi:10.1038/nrc1187 [38] L. Bentzen, S. Keiding, M. R. Horsman, L. Falborg, S. B. Hansen and J. Overgaard, “Feasibility of Detecting Hy- poxia in Experimental Mouse Tumours with 18F-Fluo- rinated Tracers and Positron Emission Tomography—A Study Evaluating [18F]Fluoro-2-Deoxy-D-Glucose,” Acta Oncologica, Vol. 39, No. 35, 2000, pp. 629-637. doi:10.1080/028418600750013320 [39] L. Dubois, W. Landuyt, K. Haustermans, P. Dupont, G. Bormans, P. Vermaelen, E. Verbeken and L. Mortelmans, “Evaluation of Hypoxia in an Experimental Rat Tumour Model by [18F]Fluoromisonidazole PET and Immunohis- tochemistry,” British Journal of Cancer, Vol. 91, No. 11, 2004, pp. 1947-1954. doi:10.1038/sj.bjc.6602219 [40] F. He, X. Deng, B. Wen, Y. L iu, X. Sun, L. Xing, A. Minami, Y. Huang, Q. Chen, P. B. Zanzonico, C. C. Ling and G. C. Li, “Noninvasive Molecular Imaging of Hypo- xia in Human Xenografts: Comparing Hypoxia-Induced Gene Expression with Endogenous and Exogenous Hypo- xia Markers,” Cancer Resserch, Vol. 68, No. 20, 2008, pp. 8597-8606. doi:10.1158/0008-5472.CAN-08-0677 [41] R. V. Iyer, E. L. Engelhardt, C. C. Stobbe, R. F. Schnei- der and J. D. Chapman, “Preclinical Assessment of Hypo- xic Marker Specificity and Sensitivity,” International Jour- nal of Radiation Oncology, Biology, Physics, Vol. 42, No. 42, 1998, pp. 741-745. Copyright © 2013 SciRes. IJMPCERO  X.-F. LI ET AL. Copyright © 2013 SciRes. IJMPCERO 29 doi:10.1016/S0360-3016(98)00315-0 [42] P. Zanzonico, J. O’Donoghue, J. D. Chapman, R. Schnei- der, S. Cai, S. Larson, B. Wen, Y. Chen, R. Finn, S. Ruan, L. Gerweck, J. Humm and C. Ling, “Iodine-124-Labeled Iodo-Azomycin-Galactoside Imaging of Tumor Hypoxia in Mice with Serial Micropet Scanning,” European Jour- nal of Nuclear Medicine and Molecular, Vol. 31, No. 1, 2004, pp. 117-128. doi:10.1007/s00259-003-1322-y [43] C. C. Riedl, P. Brader, P. B. Zanzonico, Y. S. Chun, Y. Woo, P. Singh, S. Carlin, B. Wen, C. C. Ling, H. Hricak and Y. Fong, “Imaging Hypoxia in Orthotopic Rat Liver Tumors with Iodine 124-Labeled Iodoazomycin Galacto- pyranoside PET,” Radiology, Vol. 248, No. 2, 2008, pp. 561-570. doi:10.1148/radiol.2482071421 [44] K. Wang, E. Yorke, S. A. Nehmeh, J. L. Humm and C. C. Ling, “Modeling Acute and Chronic Hypoxia Using Se- rial Images of 18F-FMISO PET,” Medical Physics, Vol. 36, No. 10, 2009, pp. 4400-4408. doi:10.1118/1.3213092
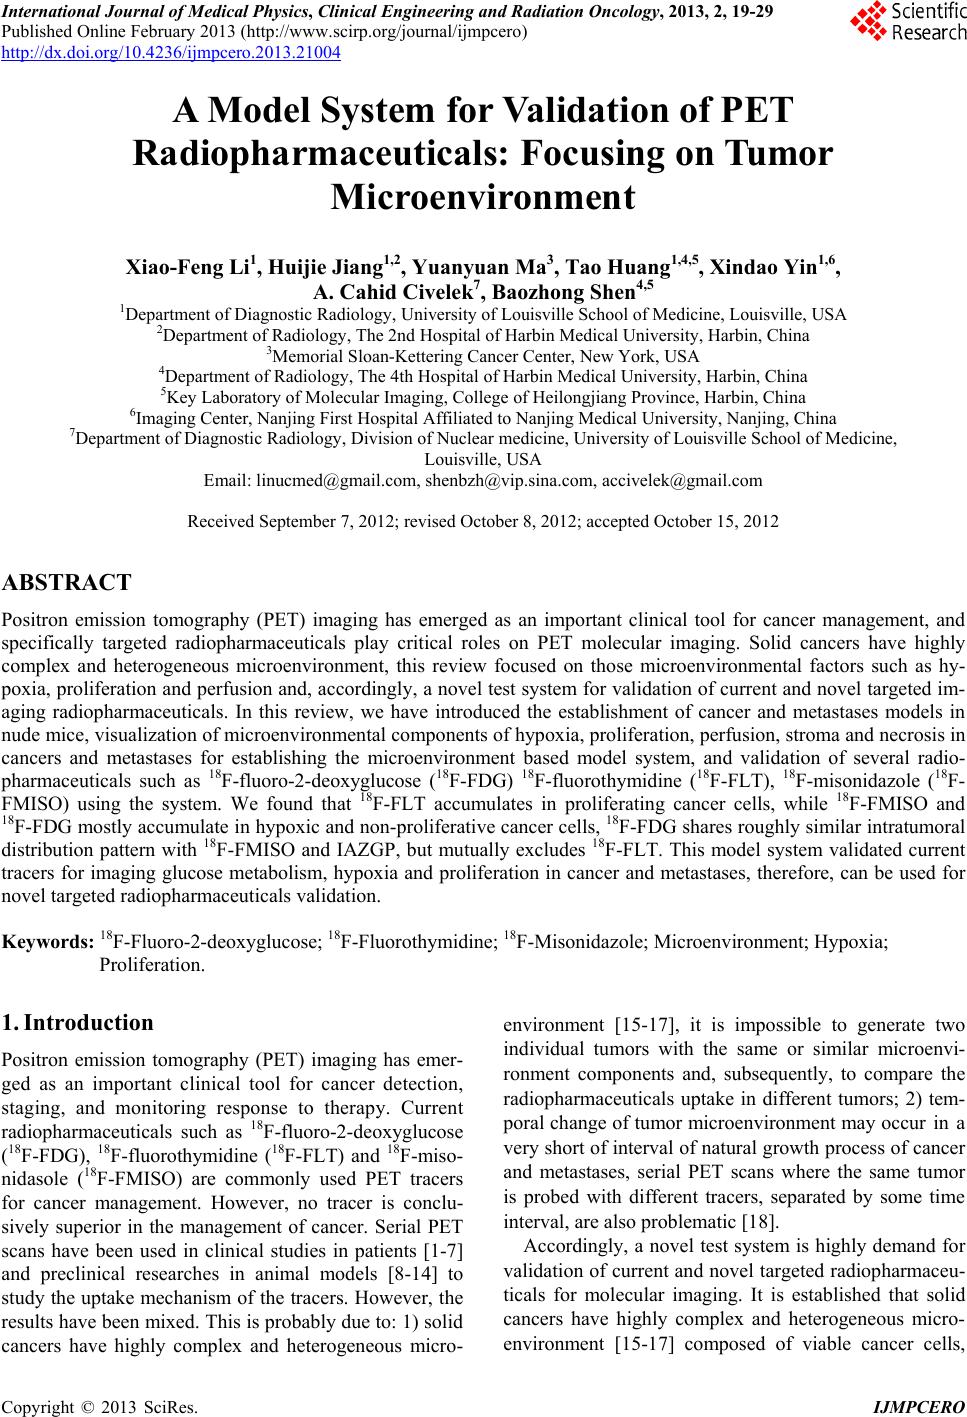
|