 International Journal of Medical Physics, Clinical Engineering and Radiation Oncology, 2013, 2, 6-14 Published Online February 2013 (http://www.scirp.org/journal/ijmpcero) http://dx.doi.org/10.4236/ijmpcero.2013.21002 Copyright © 2013 SciRes. IJMPCERO Verification and Dosimetric Impact of Acuros XB Algorithm for Stereotactic Body Radiation Therapy (SBRT) and RapidArc Planning for Non-Small-Cell Lung Cancer (NSCLC) Patients Suresh Rana1,2, Kevin Rogers2, Terry Lee2, Daniel Reed2, Christopher Biggs2 1Department of Medical Physics, ProCure Proton Therapy Center, Oklahoma City, USA 2Department of Radiation Oncology, Arizona Center for Cancer Care, Peoria, USA Email: suresh.rana@gmail.com Received October 11, 2012; revised November 14, 2012; accepted November 20, 2012 ABSTRACT Purpose: The experimental verification of the Acuros XB (AXB) algorithm was conducted in a heterogeneous rectan- gular slab phantom, and compared to the Anisotropic Analytical Algorithm (AAA). The dosimetric impact of the AXB for stereotactic body radiation therapy (SBRT) and RapidArc planning for 16 non-small-cell lung cancer (NSCLC) pa- tients was assessed due to the dose recalculation from the AAA to the AXB. Methods: The calculated central axis per- centage depth doses (PDD) in a heterogeneous slab phantom for an open field size of 3 × 3 cm2 were compared against the PDD measured by an ionization chamber. For 16 NSCLC patients, the dose-volume parameters from the treatment plans calculated by the AXB and the AAA were compared using identical jaw settings, leaf positions, and monitor units (MUs). Results: The results from the heterogeneous slab phantom study showed that the AXB was more accurate than the AAA; however, the dose underestimation by the AXB (up to −3.9%) and AAA (up to −13.5%) was observed. For a planning target volume (PTV) in the NSCLC patients, in comparison to the AAA, the AXB predicted lower mean and minimum doses by average 0.3% and 4.3% respectively, but a higher maximum dose by average 2.3%. The averaged maximum doses to the heart and spinal cord predicted by the AXB were lower by 1.3% and 2.6% respectively; whereas the doses to the lungs predicted by the AXB were higher by up to 0.5% compared to the AAA. The percentage of ipsi- lateral lung volume receiving at least 20 and 5 Gy (V20 and V5 respectively) were higher in the AXB plans than in the AAA plans by average 1.1% and 2.8% respectively. The AXB plans produced higher target heterogeneity by average 4.5% and lower plan conformity by average 5.8% compared to the AAA plans. Using the AXB, the PTV coverage (95% of the PTV covered by the 100% of the prescribed dose) was reduced by average 8.2% than using the AAA. The AXB plans required about 2.3% increment in the number of MUs in order to achieve the same PTV coverage as in the AAA plans. Conclusion: The AXB is more accurate to use for the dose calculations in SBRT lung plans created with a RapidArc technique; however, one should also note the reduced PTV coverage due to the dose recalculation from the AAA to the AXB. Keywords: Acuros XB; AAA; Heterogeneity Correction; SBRT; RapidArc; Lung Cancer 1. Introduction Lung cancer is the leading cancer killer in both men and women in the United States, causing more deaths than the next three most common cancers combined (colon, breast and prostate) [1]. According to the American Can- cer Society’s most recent statistics, an estimated 226,160 new cases of lung cancer were expected to be diagnosed in 2012, representing almost 14 percent of all cancer dia- gnoses [1]. Surgical resection is considered to be the preferred treatment for the early stage non-small-cell lung cancer (NSCLC). For NSCLC patients who are not candidates for surgical therapy, stereotactic body radiotherapy (SBRT) is an alternative method for the treatment of small lung tumors. SBRT is a highly con- formal technique that delivers high radiation dose with few treatment fractions to the tumor while limiting the doses received by the organs at risk (OARs). Previous studies have shown that high probability of tumor control can be achieved with SBRT when com- pared to the conventional radiation therapy [2,3], with local control rates at 3 years up to 90% [4]. However, advanced cancer treatment techniques such as SBRT also demand for more accurate dose calculation algorithms 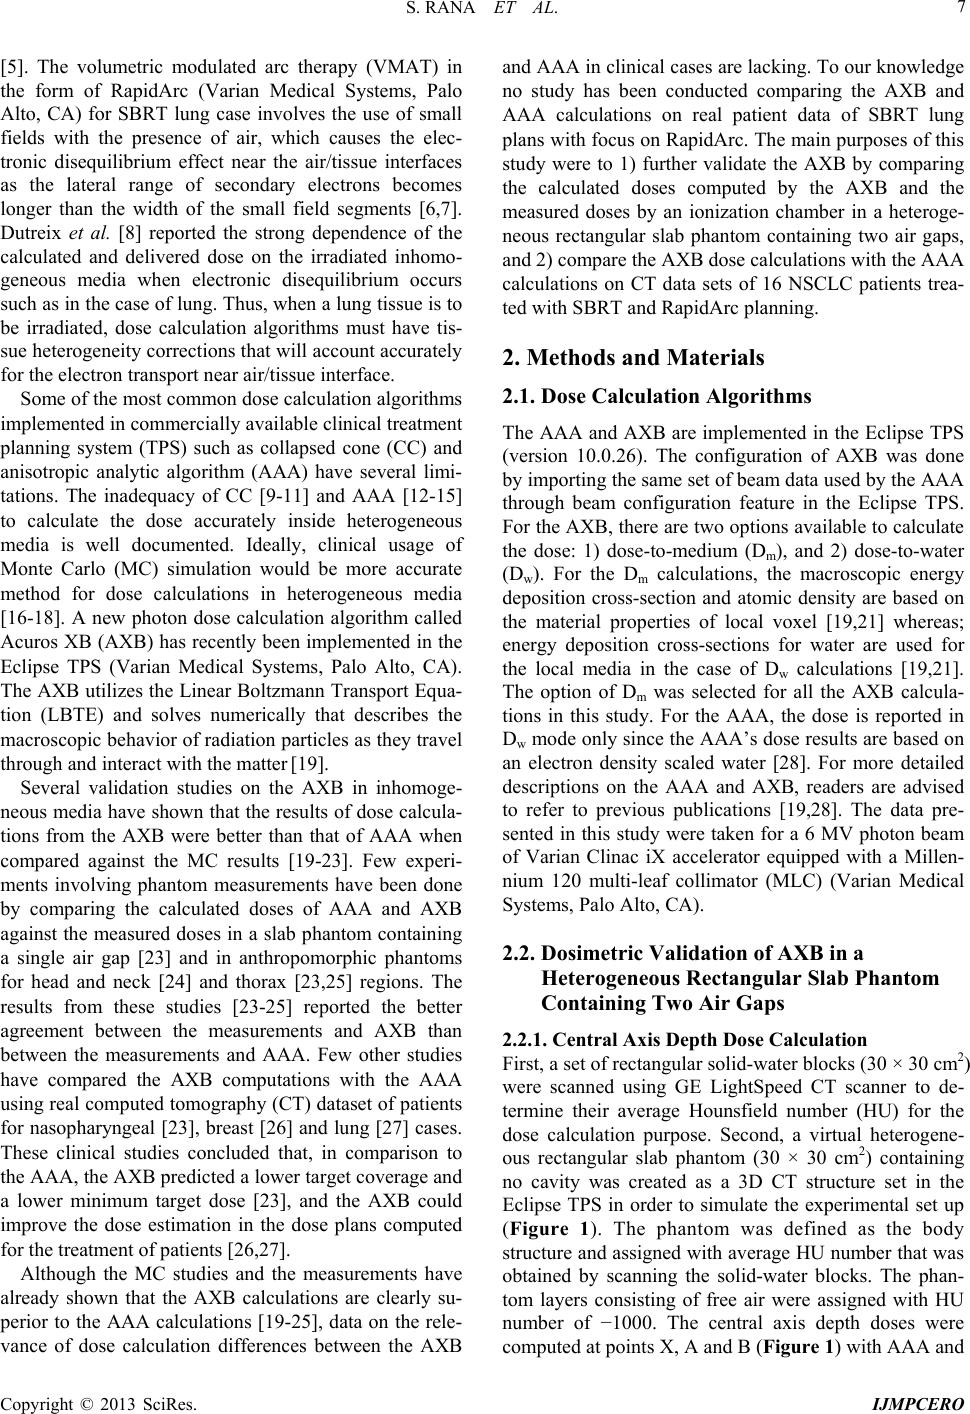 S. RANA ET AL. 7 [5]. The volumetric modulated arc therapy (VMAT) in the form of RapidArc (Varian Medical Systems, Palo Alto, CA) for SBRT lung case involves the use of small fields with the presence of air, which causes the elec- tronic disequilibrium effect near the air/tissue interfaces as the lateral range of secondary electrons becomes longer than the width of the small field segments [6,7]. Dutreix et al. [8] reported the strong dependence of the calculated and delivered dose on the irradiated inhomo- geneous media when electronic disequilibrium occurs such as in the case of lung. Thus, when a lung tissue is to be irradiated, dose calculation algorithms must have tis- sue heterogeneity corrections that will account accurately for the electron transport near air/tissue interface. Some of the most common dose calculation algorithms implemented in commercially available clinical treatment planning system (TPS) such as collapsed cone (CC) and anisotropic analytic algorithm (AAA) have several limi- tations. The inadequacy of CC [9-11] and AAA [12-15] to calculate the dose accurately inside heterogeneous media is well documented. Ideally, clinical usage of Monte Carlo (MC) simulation would be more accurate method for dose calculations in heterogeneous media [16-18]. A new photon dose calculation algorithm called Acuros XB (AXB) has recently been implemented in the Eclipse TPS (Varian Medical Systems, Palo Alto, CA). The AXB utilizes the Linear Boltzmann Transport Equa- tion (LBTE) and solves numerically that describes the macroscopic behavior of radiation particles as they travel through and interact with the matter [19]. Several validation studies on the AXB in inhomoge- neous media have shown that the results of dose calcula- tions from the AXB were better than that of AAA when compared against the MC results [19-23]. Few experi- ments involving phantom measurements have been done by comparing the calculated doses of AAA and AXB against the measured doses in a slab phantom containing a single air gap [23] and in anthropomorphic phantoms for head and neck [24] and thorax [23,25] regions. The results from these studies [23-25] reported the better agreement between the measurements and AXB than between the measurements and AAA. Few other studies have compared the AXB computations with the AAA using real computed tomography (CT) dataset of patients for nasopharyngeal [23], breast [26] and lung [27] cases. These clinical studies concluded that, in comparison to the AAA, the AXB predicted a lower target coverage and a lower minimum target dose [23], and the AXB could improve the dose estimation in the dose plans computed for the treatment of patients [26,27]. Although the MC studies and the measurements have already shown that the AXB calculations are clearly su- perior to the AAA calculations [19-25], data on the rele- vance of dose calculation differences between the AXB and AAA in clinical cases are lacking. To our knowledge no study has been conducted comparing the AXB and AAA calculations on real patient data of SBRT lung plans with focus on RapidArc. The main purposes of this study were to 1) further validate the AXB by comparing the calculated doses computed by the AXB and the measured doses by an ionization chamber in a heteroge- neous rectangular slab phantom containing two air gaps, and 2) compare the AXB dose calculations with the AAA calculations on CT data sets of 16 NSCLC patients trea- ted with SBRT and RapidArc planning. 2. Methods and Materials 2.1. Dose Calculation Algorithms The AAA and AXB are implemented in the Eclipse TPS (version 10.0.26). The configuration of AXB was done by importing the same set of beam data used by the AAA through beam configuration feature in the Eclipse TPS. For the AXB, there are two options available to calculate the dose: 1) dose-to-medium (Dm), and 2) dose-to-water (Dw). For the Dm calculations, the macroscopic energy deposition cross-section and atomic density are based on the material properties of local voxel [19,21] whereas; energy deposition cross-sections for water are used for the local media in the case of Dw calculations [19,21]. The option of Dm was selected for all the AXB calcula- tions in this study. For the AAA, the dose is reported in Dw mode only since the AAA’s dose results are based on an electron density scaled water [28]. For more detailed descriptions on the AAA and AXB, readers are advised to refer to previous publications [19,28]. The data pre- sented in this study were taken for a 6 MV photon beam of Varian Clinac iX accelerator equipped with a Millen- nium 120 multi-leaf collimator (MLC) (Varian Medical Systems, Palo Alto, CA). 2.2. Dosimetric Validation of AXB in a Heterogeneous Rectangular Slab Phantom Containing Two Air Gaps 2.2.1. C entral Axis De pth Dose Calculatio n First, a set of rectangular solid-water blocks (30 × 30 cm2) were scanned using GE LightSpeed CT scanner to de- termine their average Hounsfield number (HU) for the dose calculation purpose. Second, a virtual heterogene- ous rectangular slab phantom (30 × 30 cm2) containing no cavity was created as a 3D CT structure set in the Eclipse TPS in order to simulate the experimental set up (Figure 1). The phantom was defined as the body structure and assigned with average HU number that was obtained by scanning the solid-water blocks. The phan- tom layers consisting of free air were assigned with HU number of −1000. The central axis depth doses were computed at points X, A and B (Figure 1) with AAA and Copyright © 2013 SciRes. IJMPCERO  S. RANA ET AL. 8 Figure 1. Schematic diagram of the experimental setup for the central axis depth dose c o mputations and measureme nts in a heterogeneous rectangular slab phantom containing two air gaps. The central axis depth doses were compared in solid-water medium (third phantom layer) for points A and B which are located at the distance of 1 and 2 cm from the air/solid-water interface respectively. The normalization point is 1.5 cm proximal to the phantom surface and mark- ed with “X”. AXB (both include version 10.0.26) for the same number of MUs using an identical beam set up. The dose com- putations were done for an open field size of 3 × 3 cm2. The dose calculation grid was set to 2.5 mm for all the AAA and AXB calculations. 2.2.2. Central Axis D epth Dose Mea su rement In order to mimic the virtual phantom created in the Eclipse TPS, rectangular Styrofoam blocks (2 × 2 cm2, 4 and 6 cm thickness) were placed on both the lateral sides of the central beam axis and used only as support to create the air gaps between the solid-water materials (30 × 30 cm2). The solid-water block that was used to house the Exradin A1 cylindrical ionization chamber (collec- ting volume: 0.053 cm3) (Standard Imaging, Middletown, WI) contained single cavity. This solid-water block (referred as the chamber block to differentiate itself from other solid-water blocks with no cavity) was designed such that the center of the chamber will be located under the center crosshair inscribed on the surface of the chamber block. For measurements at points of interest (X, A and B), the crosshair on the surface of the chamber block was aligned with the light field crosshair. By keeping an identical field size (3 × 3 cm2), beam para- meters and geometries that were used for the dose com- putation by the AAA and AXB in the Eclipse TPS, 100 MUs were delivered to the phantom. The central axis depth dose measurements were acquired with Exradin A1 cylindrical ionization chamber and the measurement at each points of interest (X, A and B) was repeated three times. 2.2.3. Central Axis Depth Dose Comparison The calculated (AAA and AXB) and measured doses were converted to the percent depth dose (PDD) by nor- malizing to their respective central axis dose obtained at 1.5 cm depth and this dose normalization point is marked with “X” in Figure 1. The calculated (AAA and AXB) PDDs were then compared against the measured PDDs for points A and B to evaluate the accuracy of dose pre- dictions by the AAA and AXB in the presence of air gaps. The difference, Dm (%) was calculated using Equation (1). m DPDD AXB or AAAMeasurement100 Measurement (1) 2.3. Dosimetric Evaluation of AXB for Clinical SBRT Lung Cases 2.3.1. Pa tients and Con t o uring Sixteen NSCLC patients were selected for this retrospec- tive study and these patients were treated at Arizona Center for Cancer Care with SBRT. The CT scans of all SBRT patients were acquired with 512 × 512 pixels at 0.25 cm slice spacing on a flat tabletop of GE Light- Speed CT Scanner. The Digital Imaging and Communi- cations in Medicine (DI-COM) CT data was electroni- cally transferred to the Eclipse TPS for contouring and planning. The following volumes of interest (VOI) were created in each axial CT slice: 1) planning target volume (PTV) from a 5 mm wide isotropic expansion of the cli- nical target volume (CTV), and 2) organs at risk (OARs): heart, spinal cord, contra- lateral lung (contra-lung), and ipsilateral lung excluding PTV (ipsi-lung). 2.3.2. Pl anning, Op timization and Dose Calculation The beam parameters of the original patient treatment plans in this study were set up in the Eclipse TPS (ver- sion 10.0.26) and the treatment plans were created using a RapidArc technique consisting of 2 - 4 partial arcs in a coplanar field arrangement (Figure 2). The beam-eye-view graphics in the Eclipse TPS was used to better arrange the arc angles and define the field sizes according to the location of the PTV and OARs with an objective of achieving maximal PTV coverage and minimal OARs dose. The isocenter of the plans was placed at the center of the PTV and all the plans were Copyright © 2013 SciRes. IJMPCERO  S. RANA ET AL. 9 Figure 2. A transversal view of RapidArc plan setup in the Eclipse treatment planning system for lung cancer using double partial-arc technique . inversely optimized. The volumetric dose optimization method followed the same systematic strategy regarding the objectives and priorities such that at least 95% of the PTV received the prescription dose of 60 Gy in 5 frac- tions while keeping the doses to the spinal cord and heart limited to not more than 18 and 30 Gy respectively. For the contra-lung, the percentage volume receiving 20 Gy or more (V20Gy) was restricted to 10%. For the ipsi-lung, the dose limitation was <32% of the volume receiving 20 Gy or more. The patient plans were generated by performing final dose calculations of the optimized plans with the AAA (version 10.0.26) and these plans were normalized such that the 100% of the prescribed dose covered the 95% of the PTV. The resulting final original patient treatment plans (i.e., plans obtained after dose normalization) were referred as the AAA plans. Next, for each patient, the AAA plan was copied and the dose re-calculation was performed retrospectively with the AXB (version 10.0.26) using identical jaw settings, MLC leaf positions and MUs as in the corresponding AAA plan. A second set of treat- ment plans for all 16 patients resulting from the AXB dose computation were referred as the AXB plans. Fi- nally, a third set of treatment plans were created by nor- malizing the AXB plans such that 100% of the pre- scribed dose covered the 95% of the PTV and these plans are referred as the AXB_Norm plans. The dose cal- culation grid was set to 2.5 mm for all the calculations. 2.3.3. Plan Evaluation The dose-volume histograms (DVH) of all the calculated SBRT lung treatment plans (AAA and AXB) were gene- rated in the Eclipse TPS for the PTV, heart, spinal cord, contra-lung, and ipsi-lung. For the PTV, the maximum dose, mean dose, minimum dose, the percentage of PTV covered by 100% and 90% of the prescribed dose (V100 and V90 respectively), Paddick conformity index, CIPaddick (defined in Equation (2)) [29], and heterogeneity index (HI) (defined in Equation (3)) were compared. Padd 2 P ick I TV PT CI IV = (2) where PI is the volume of the prescription isodose vol- ume, TV is the target volume, and TVPI is the target volume within the prescribed isodose volume PI. A per- fect treatment plan would have TV = PI = TVPI and give CIPaddick = 1. 1% 99% D D HI= (3) where D1% and D99% are doses at 1% and 99% of the PTV respectively. For the lungs, the maximum dose, mean dose and the percentage of lung volume receiving 20 Gy and 5 Gy (V20 and V5 respectively) were compared. The maxi- mum dose was evaluated for the heart and spinal cord. Additionally, the difference in MUs between the AAA and AXB_Norm plans was evaluated. For the purpose of comparison, the AAA plans were used as the standard, and the percent difference of corresponding computed value (Dc) between the AXB and AAA plans of the same patient was calculated using Equation (4). c AXB AAA Dx 100 AAA (4) where x is a computed dose-volume parameter or a do- simetric index in the AXB and AAA plans. In order to test the observed differences between the calculated AAA and AXB plans, a statistical analysis was done using paired two-sided student’s t-test in a Mi- crosoft Excel spreadsheet. A P-value of less than 0.05 (i.e., P < 0.05) was considered to be statistically signifi- cant. 3. Results and Discussion 3.1. Dosimetric Validation of AXB in a Heterogeneous Rectangular Slab Phantom Containing Two Air Gaps Table 1 shows the calculated (AAA and AXB) and mea- sured PDD data at points A and B in a heterogeneous rectangular slab phantom (Figure 1) for a 6 MV photon beam and a 3 × 3 cm2 field size. It is seen from Table 1 and Figure 3 that the AXB’s values had better agreement than the AAA’s values at both the points A and B when compared against the measured data. Specifically, at point A, the dose differences for the AXB and AAA were −3.9% and −9.0% respectively; whereas at point B, the Copyright © 2013 SciRes. IJMPCERO 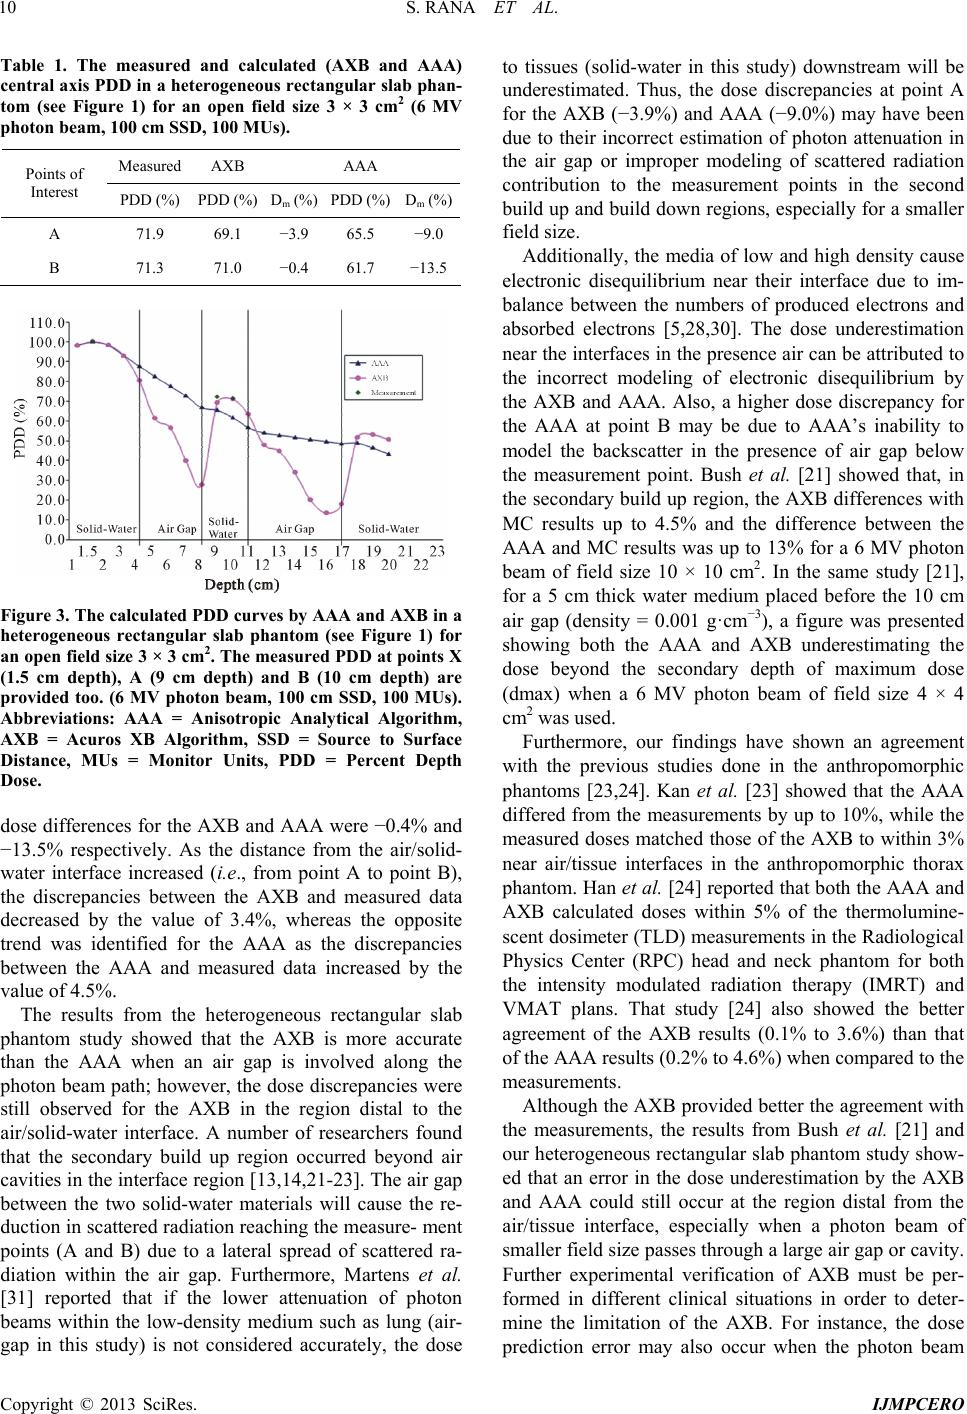 S. RANA ET AL. 10 Table 1. The measured and calculated (AXB and AAA) central axis PDD in a heterogeneous rectangular slab phan- tom (see Figure 1) for an open field size 3 × 3 cm2 (6 MV photon beam, 100 cm SSD, 100 MUs). Measured AXB AAA Points of Interest PDD (%) PDD (%) Dm (%) PDD (%)Dm (%) A 71.9 69.1 −3.9 65.5 −9.0 B 71.3 71.0 −0.4 61.7 −13.5 Figure 3. The calculated PDD curves by AAA and AXB in a heterogeneous rectangular slab phantom (see Figure 1) for an open field size 3 × 3 cm2. The measured PDD at points X (1.5 cm depth), A (9 cm depth) and B (10 cm depth) are provided too. (6 MV photon beam, 100 cm SSD, 100 MUs). Abbreviations: AAA = Anisotropic Analytical Algorithm, AXB = Acuros XB Algorithm, SSD = Source to Surface Distance, MUs = Monitor Units, PDD = Percent Depth Dose. dose differences for the AXB and AAA were −0.4% and −13.5% respectively. As the distance from the air/solid- water interface increased (i.e., from point A to point B), the discrepancies between the AXB and measured data decreased by the value of 3.4%, whereas the opposite trend was identified for the AAA as the discrepancies between the AAA and measured data increased by the value of 4.5%. The results from the heterogeneous rectangular slab phantom study showed that the AXB is more accurate than the AAA when an air gap is involved along the photon beam path; however, the dose discrepancies were still observed for the AXB in the region distal to the air/solid-water interface. A number of researchers found that the secondary build up region occurred beyond air cavities in the interface region [13,14,21-23]. The air gap between the two solid-water materials will cause the re- duction in scattered radiation reaching the measure- ment points (A and B) due to a lateral spread of scattered ra- diation within the air gap. Furthermore, Martens et al. [31] reported that if the lower attenuation of photon beams within the low-density medium such as lung (air- gap in this study) is not considered accurately, the dose to tissues (solid-water in this study) downstream will be underestimated. Thus, the dose discrepancies at point A for the AXB (−3.9%) and AAA (−9.0%) may have been due to their incorrect estimation of photon attenuation in the air gap or improper modeling of scattered radiation contribution to the measurement points in the second build up and build down regions, especially for a smaller field size. Additionally, the media of low and high density cause electronic disequilibrium near their interface due to im- balance between the numbers of produced electrons and absorbed electrons [5,28,30]. The dose underestimation near the interfaces in the presence air can be attributed to the incorrect modeling of electronic disequilibrium by the AXB and AAA. Also, a higher dose discrepancy for the AAA at point B may be due to AAA’s inability to model the backscatter in the presence of air gap below the measurement point. Bush et al. [21] showed that, in the secondary build up region, the AXB differences with MC results up to 4.5% and the difference between the AAA and MC results was up to 13% for a 6 MV photon beam of field size 10 × 10 cm2. In the same study [21], for a 5 cm thick water medium placed before the 10 cm air gap (density = 0.001 g·cm−3), a figure was presented showing both the AAA and AXB underestimating the dose beyond the secondary depth of maximum dose (dmax) when a 6 MV photon beam of field size 4 × 4 cm2 was used. Furthermore, our findings have shown an agreement with the previous studies done in the anthropomorphic phantoms [23,24]. Kan et al. [23] showed that the AAA differed from the measurements by up to 10%, while the measured doses matched those of the AXB to within 3% near air/tissue interfaces in the anthropomorphic thorax phantom. Han et al. [24] reported that both the AAA and AXB calculated doses within 5% of the thermolumine- scent dosimeter (TLD) measurements in the Radiological Physics Center (RPC) head and neck phantom for both the intensity modulated radiation therapy (IMRT) and VMAT plans. That study [24] also showed the better agreement of the AXB results (0.1% to 3.6%) than that of the AAA results (0.2% to 4.6%) when compared to the measurements. Although the AXB provided better the agreement with the measurements, the results from Bush et al. [21] and our heterogeneous rectangular slab phantom study show- ed that an error in the dose underestimation by the AXB and AAA could still occur at the region distal from the air/tissue interface, especially when a photon beam of smaller field size passes through a large air gap or cavity. Further experimental verification of AXB must be per- formed in different clinical situations in order to deter- mine the limitation of the AXB. For instance, the dose prediction error may also occur when the photon beam Copyright © 2013 SciRes. IJMPCERO 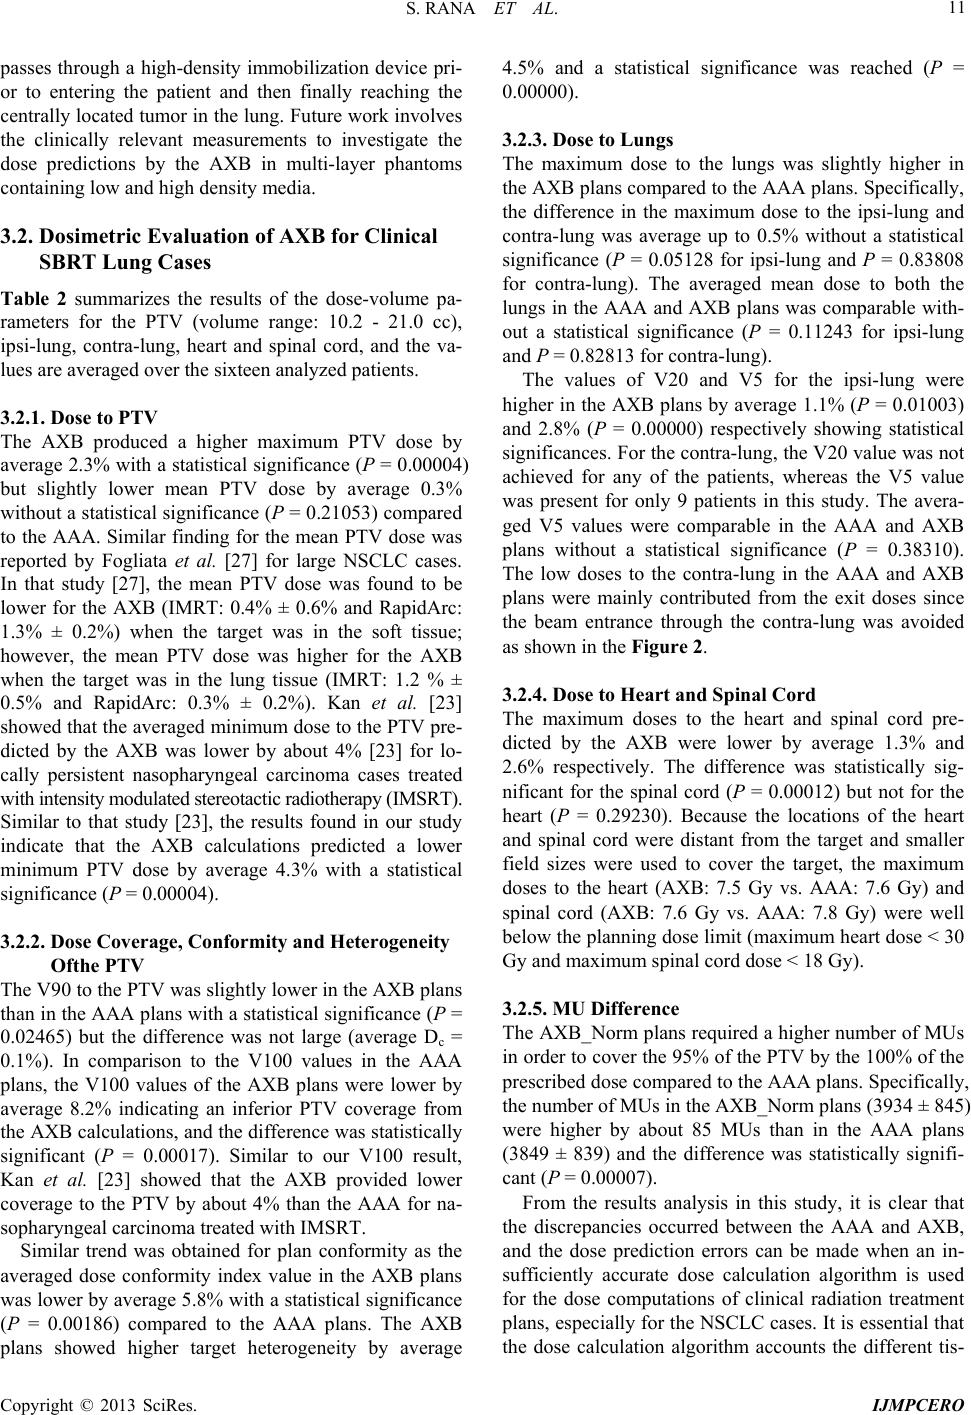 S. RANA ET AL. 11 passes through a high-density immobilization device pri- or to entering the patient and then finally reaching the centrally located tumor in the lung. Future work involves the clinically relevant measurements to investigate the dose predictions by the AXB in multi-layer phantoms containing low and high density media. 3.2. Dosimetric Evaluation of AXB for Clinical SBRT Lung Cases Table 2 summarizes the results of the dose-volume pa- rameters for the PTV (volume range: 10.2 - 21.0 cc), ipsi-lung, contra-lung, heart and spinal cord, and the va- lues are averaged over the sixteen analyzed patients. 3.2.1. Dose to PTV The AXB produced a higher maximum PTV dose by average 2.3% with a statistical significance (P = 0.00004) but slightly lower mean PTV dose by average 0.3% without a statistical significance (P = 0.21053) compared to the AAA. Similar finding for the mean PTV dose was reported by Fogliata et al. [27] for large NSCLC cases. In that study [27], the mean PTV dose was found to be lower for the AXB (IMRT: 0.4% ± 0.6% and RapidArc: 1.3% ± 0.2%) when the target was in the soft tissue; however, the mean PTV dose was higher for the AXB when the target was in the lung tissue (IMRT: 1.2 % ± 0.5% and RapidArc: 0.3% ± 0.2%). Kan et al. [23] showed that the averaged minimum dose to the PTV pre- dicted by the AXB was lower by about 4% [23] for lo- cally persistent nasopharyngeal carcinoma cases treated with intensity modulated stereotactic radiotherapy (IMSRT). Similar to that study [23], the results found in our study indicate that the AXB calculations predicted a lower minimum PTV dose by average 4.3% with a statistical significance (P = 0.00004). 3.2.2. D ose C o v er a g e, Conformi t y and Heterogeneity Ofthe PTV The V90 to the PTV was slightly lower in the AXB plans than in the AAA plans with a statistical significance (P = 0.02465) but the difference was not large (average Dc = 0.1%). In comparison to the V100 values in the AAA plans, the V100 values of the AXB plans were lower by average 8.2% indicating an inferior PTV coverage from the AXB calculations, and the difference was statistically significant (P = 0.00017). Similar to our V100 result, Kan et al. [23] showed that the AXB provided lower coverage to the PTV by about 4% than the AAA for na- sopharyngeal carcinoma treated with IMSRT. Similar trend was obtained for plan conformity as the averaged dose conformity index value in the AXB plans was lower by average 5.8% with a statistical significance (P = 0.00186) compared to the AAA plans. The AXB plans showed higher target heterogeneity by average 4.5% and a statistical significance was reached (P = 0.00000). 3.2.3. D ose t o L un gs The maximum dose to the lungs was slightly higher in the AXB plans compared to the AAA plans. Specifically, the difference in the maximum dose to the ipsi-lung and contra-lung was average up to 0.5% without a statistical significance (P = 0.05128 for ipsi-lung and P = 0.83808 for contra-lung). The averaged mean dose to both the lungs in the AAA and AXB plans was comparable with- out a statistical significance (P = 0.11243 for ipsi-lung and P = 0.82813 for contra-lung). The values of V20 and V5 for the ipsi-lung were higher in the AXB plans by average 1.1% (P = 0.01003) and 2.8% (P = 0.00000) respectively showing statistical significances. For the contra-lung, the V20 value was not achieved for any of the patients, whereas the V5 value was present for only 9 patients in this study. The avera- ged V5 values were comparable in the AAA and AXB plans without a statistical significance (P = 0.38310). The low doses to the contra-lung in the AAA and AXB plans were mainly contributed from the exit doses since the beam entrance through the contra-lung was avoided as shown in the Figure 2. 3.2.4. Dose to Heart and Spinal Cord The maximum doses to the heart and spinal cord pre- dicted by the AXB were lower by average 1.3% and 2.6% respectively. The difference was statistically sig- nificant for the spinal cord (P = 0.00012) but not for the heart (P = 0.29230). Because the locations of the heart and spinal cord were distant from the target and smaller field sizes were used to cover the target, the maximum doses to the heart (AXB: 7.5 Gy vs. AAA: 7.6 Gy) and spinal cord (AXB: 7.6 Gy vs. AAA: 7.8 Gy) were well below the planning dose limit (maximum heart dose < 30 Gy and maximum spinal cord dose < 18 Gy). 3.2.5. MU Difference The AXB_Norm plans required a higher number of MUs in order to cover the 95% of the PTV by the 100% of the prescribed dose compared to the AAA plans. Specifically, the number of MUs in the AXB_Norm plans (3934 ± 845) were higher by about 85 MUs than in the AAA plans (3849 ± 839) and the difference was statistically signifi- cant (P = 0.00007). From the results analysis in this study, it is clear that the discrepancies occurred between the AAA and AXB, and the dose prediction errors can be made when an in- sufficiently accurate dose calculation algorithm is used for the dose computations of clinical radiation treatment plans, especially for the NSCLC cases. It is essential that the dose calculation algorithm accounts the different tis- Copyright © 2013 SciRes. IJMPCERO 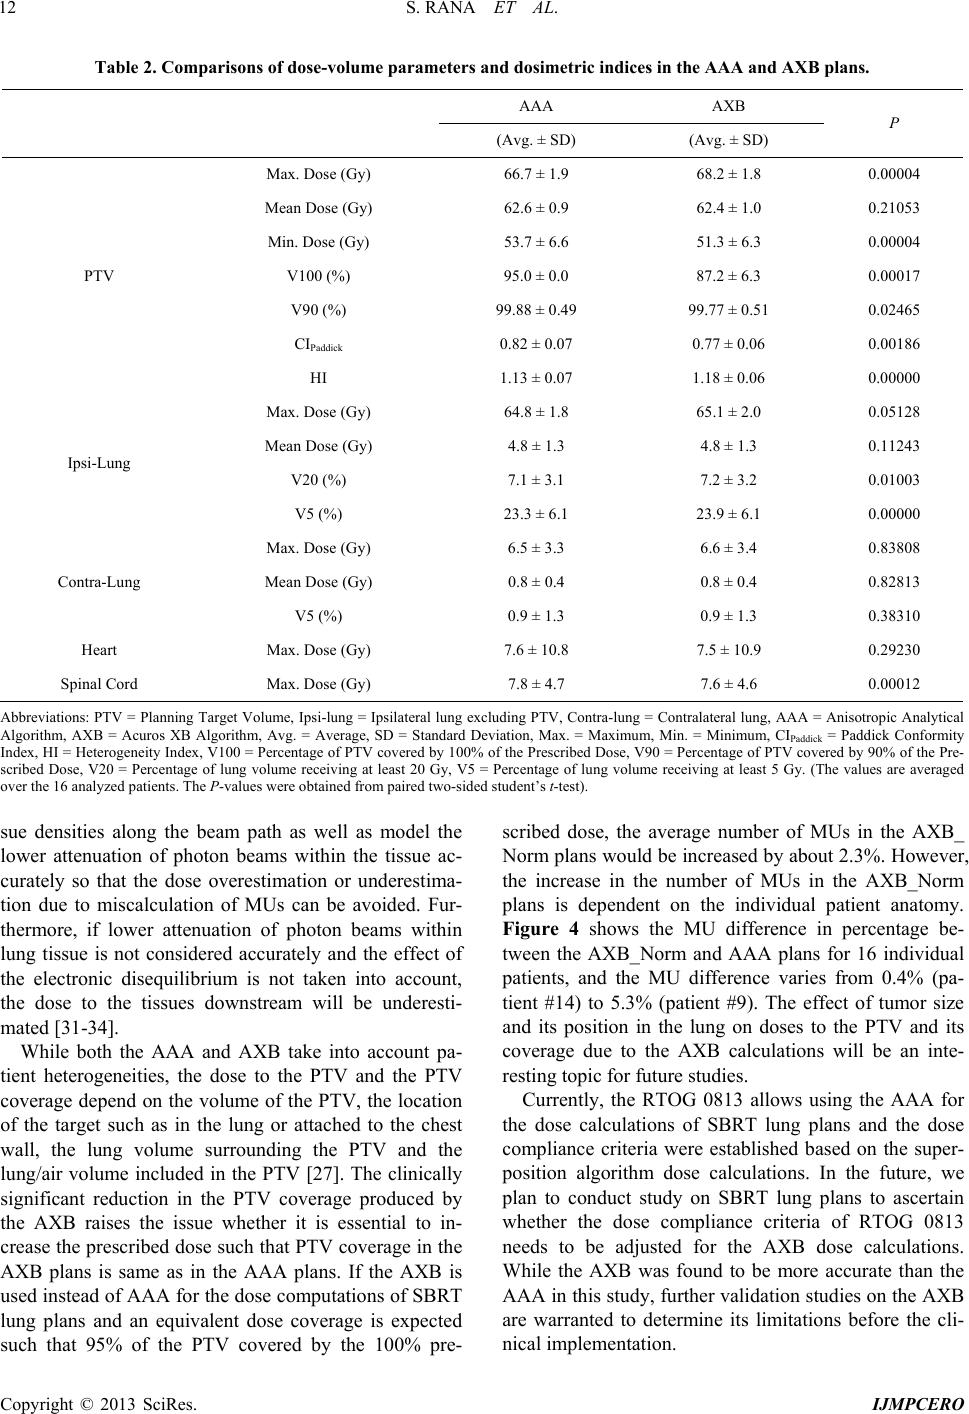 S. RANA ET AL. Copyright © 2013 SciRes. IJMPCERO 12 Table 2. Comparisons of dose-volume parameters and dosimetric indices in the AAA and AXB plans. AAA AXB (Avg. ± SD) (Avg. ± SD) P Max. Dose (Gy) 66.7 ± 1.9 68.2 ± 1.8 0.00004 Mean Dose (Gy) 62.6 ± 0.9 62.4 ± 1.0 0.21053 Min. Dose (Gy) 53.7 ± 6.6 51.3 ± 6.3 0.00004 V100 (%) 95.0 ± 0.0 87.2 ± 6.3 0.00017 V90 (%) 99.88 ± 0.49 99.77 ± 0.51 0.02465 CIPaddick 0.82 ± 0.07 0.77 ± 0.06 0.00186 PTV HI 1.13 ± 0.07 1.18 ± 0.06 0.00000 Max. Dose (Gy) 64.8 ± 1.8 65.1 ± 2.0 0.05128 Mean Dose (Gy) 4.8 ± 1.3 4.8 ± 1.3 0.11243 V20 (%) 7.1 ± 3.1 7.2 ± 3.2 0.01003 Ipsi-Lung V5 (%) 23.3 ± 6.1 23.9 ± 6.1 0.00000 Max. Dose (Gy) 6.5 ± 3.3 6.6 ± 3.4 0.83808 Mean Dose (Gy) 0.8 ± 0.4 0.8 ± 0.4 0.82813 Contra-Lung V5 (%) 0.9 ± 1.3 0.9 ± 1.3 0.38310 Heart Max. Dose (Gy) 7.6 ± 10.8 7.5 ± 10.9 0.29230 Spinal Cord Max. Dose (Gy) 7.8 ± 4.7 7.6 ± 4.6 0.00012 Abbreviations: PTV = Planning Target Volume, Ipsi-lung = Ipsilateral lung excluding PTV, Contra-lung = Contralateral lung, AAA = Anisotropic Analytical Algorithm, AXB = Acuros XB Algorithm, Avg. = Average, SD = Standard Deviation, Max. = Maximum, Min. = Minimum, CIPaddick = Paddick Conformity Index, HI = Heterogeneity Index, V100 = Percentage of PTV covered by 100% of the Prescribed Dose, V90 = Percentage of PTV covered by 90% of the Pre- scribed Dose, V20 = Percentage of lung volume receiving at least 20 Gy, V5 = Percentage of lung volume receiving at least 5 Gy. (The values are averaged over the 16 analyzed patients. The P-values were obtained from paired two-sided student’s t-test). sue densities along the beam path as well as model the lower attenuation of photon beams within the tissue ac- curately so that the dose overestimation or underestima- tion due to miscalculation of MUs can be avoided. Fur- thermore, if lower attenuation of photon beams within lung tissue is not considered accurately and the effect of the electronic disequilibrium is not taken into account, the dose to the tissues downstream will be underesti- mated [31-34]. While both the AAA and AXB take into account pa- tient heterogeneities, the dose to the PTV and the PTV coverage depend on the volume of the PTV, the location of the target such as in the lung or attached to the chest wall, the lung volume surrounding the PTV and the lung/air volume included in the PTV [27]. The clinically significant reduction in the PTV coverage produced by the AXB raises the issue whether it is essential to in- crease the prescribed dose such that PTV coverage in the AXB plans is same as in the AAA plans. If the AXB is used instead of AAA for the dose computations of SBRT lung plans and an equivalent dose coverage is expected such that 95% of the PTV covered by the 100% pre- scribed dose, the average number of MUs in the AXB_ Norm plans would be increased by about 2.3%. However, the increase in the number of MUs in the AXB_Norm plans is dependent on the individual patient anatomy. Figure 4 shows the MU difference in percentage be- tween the AXB_Norm and AAA plans for 16 individual patients, and the MU difference varies from 0.4% (pa- tient #14) to 5.3% (patient #9). The effect of tumor size and its position in the lung on doses to the PTV and its coverage due to the AXB calculations will be an inte- resting topic for future studies. Currently, the RTOG 0813 allows using the AAA for the dose calculations of SBRT lung plans and the dose compliance criteria were established based on the super- position algorithm dose calculations. In the future, we plan to conduct study on SBRT lung plans to ascertain whether the dose compliance criteria of RTOG 0813 needs to be adjusted for the AXB dose calculations. While the AXB was found to be more accurate than the AAA in this study, further validation studies on the AXB are warranted to determine its limitations before the cli- nical implementation.  S. RANA ET AL. 13 Figure 4. The percentage difference in the number of MUs between the AAA and AXB_Norm plans for 16 patients. Abbreviations: MU = Monitor Unit, AAA = Anisotropic Analytical Algorithm, AXB_Norm = Acuros XB Normali- zed; AAA 100 AXB_Norm D MUAAA . 4. Conclusion The experimental verification study using a heterogene- ous rectangular slab phantom containing two air gaps showed that the AXB is more accurate and provides the better agreement to the measurements than the AAA. For 16 NSCLC patients, in comparison to the AAA, the AXB predicted lower mean and minimum PTV doses by aver- age 0.3% and 4.3% respectively but a higher maximum PTV dose by average 2.3%. The averaged maximum doses to the heart and spinal cord predicted by the AXB were lower by 1.3% and 2.6% respectively; whereas doses to the lungs predicted by the AXB were up to 0.5% higher compared to the AAA. The values of V20 and V5 for the ipsi-lung were higher in the AXB plans by aver- age 1.1% and 2.8% respectively. The AXB plans pro- duced higher target heterogeneity by average 4.5% and lower plan conformity by average 5.8% compared to the AAA plans. Furthermore, using the AXB, the V100 of PTV was reduced by average 8.2% than using the AAA, and the planning criteria of getting at least 95% of the PTV receiving 100% of the prescribed dose (V100 ≥ 95) was not achieved for any of the patients in this study. Thus, the appropriateness of switching from the AAA to the AXB under V100 ≥ 95 planning criteria should be further evaluated since lower dose coverage of the PTV may decrease the tumor control probability. REFERENCES [1] American Cancer Society, “Cancer Facts and Figures,” 2012. http://www.cancer.org [2] A. Fakiris A, R. McGarry R, C. Yiannoutsos C, L. Papiez, M. Williams, M. Henderson and R. Timmerman , “Stereo- tactic Body Radiation Therapy for Early Stage Nonsmall Cell Lung Carcinoma: Four-Year Results of a Prospective Phase II Study,” International Journal of Radiation On- cology, Biology and Physics, Vol. 75, No. 3, 2009, pp. 677-682. doi:10.1016/j.ijrobp.2008.11.042 [3] F. Zimmermann, H. Geinitz, S. Schill, A. Grosu, U. Sch- ratzenstaller, M. Molls and B. Jeremic, “Stereotactic Hy- pofractionated Radiation Therapy for Stage I Non-Small Cell Lung Cancer,” Lung Cancer, Vol. 48, No. 1, 2005, pp. 107-114. doi:10.1016/j.lungcan.2004.10.015 [4] D. Schuring and C. Hurkmans, “Developing and Evalu- ating Stereotactic Lung RT Trials: What We Should Know about the Influence of Inhomogeneity Corrections on Do- se,” Radiation Oncology, Vol. 3, No. 21, 2008. doi:10.1186/1748-717X-3-21 [5] I. Das, G. Ding and A. Ahnesjo, “Small Fields: None- quilibrium Radiation Dosimetry,” Medical Physics, Vol. 35, No. 1, 2008, pp. 206-215. doi:10.1118/1.2815356 [6] J. Chow, M. Seguin and A. Alexander, “Dosimetric Ef- fect of Collimating Jaws for Small Multileaf Collimated Fields,” Medical Physics, Vol. 32, No. 3, 2005, pp. 759- 765. doi:10.1118/1.1861413 [7] T. Knöös, E. Wieslander, L. Cozzi, C. Brink, A. Fogliata, D. Albers, H. Nyström and S. Lassen, “Comparison of Dose Calculation Algorithms for Treatment Planning in External Photon Beam Therapy for Clinical Situations,” Physics in Medicine and Biology, Vol. 51, No. 22, 2006, pp. 5785-807. doi:10.1088/0031-9155/51/22/005 [8] J. Dutreix, A. Dutreix and M. Tubiana, “Electronic Equi- librium and Transition Stages,” Physics in Medicine and Biology, Vol. 10, No. 2, 1965, pp. 177-190. doi:10.1088/0031-9155/10/2/302 [9] B. Dobler, C. Walter, A. Knopf, D. Fabri, R. Loeschel, M. Polednik, F. Schneider and F. Lohr, “Optimization of Ex- tracranial Stereotactic Radiation Therapy of Small Lung Lesions Using Accurate Dose Calculation Algorithms,” Radiation Oncology, Vol. 1, No. 45, 2006. doi:10.1186/1748-717X-1-45 [10] B. Vanderstraeten, N. Reynaert, L. Paelinck , I. Madani, C. De Wagter, W. De Gersem, W. De Neve and H. Thie- rens, “Accuracy of Patient Dose Calculation for Lung IMRT: A Comparison of Monte Carlo, Convolution/Su- perposition, and Pencil Beam Computations,” Medical Physics, Vol. 33, No. 9, pp. 3149-3158. doi:10.1118/1.2241992 [11] T. Krieger and O. Sauer, “Monte Carlo- versus Pencil- Beam-/Collapsed-Cone-Dose Calculation in a Heteroge- neous Multi-Layer Phantom,” Physics in Medicine and Biology, Vol. 50, No. 5, 2005, pp. 859-868. doi:10.1088/0031-9155/50/5/010 [12] A. Gray, L. Oliver and P. Johnson, “The Accuracy of the Pencil Beam Convolution and Anisotropic Analytical Algorithms in Predicting the Dose Effects Due to the At- tenuation from Immobilization Devices and Large Air Gaps,” Medical Physics, Vol. 36, No. 7, 2009, pp. 3181- 3191. doi:10.1118/1.3147204 [13] D. Robinson, “Inhomogeneity Correction and the Ana- lytic Anisotropic Algorithm,” Journal of Applied Clinical Medical Physics, Vol. 9, No. 2, 2008, pp. 112-122. [14] A. Van Esch, L. Tillikainen, J. Pyykkonen, M. Tenhunen, H. Helminen, S. Siljamäki, J. Alakuijala, M. Paiusco, M. Copyright © 2013 SciRes. IJMPCERO  S. RANA ET AL. Copyright © 2013 SciRes. IJMPCERO 14 Lori and D. Huyskens, “Testing of the Analytical Ani- sotropic Algorithm for Photon Dose Calculation,” Medi- cal Physics, Vol. 33, No. 11, 2006, pp. 4130-4148. doi:10.1118/1.2358333 [15] S. Rana and and K. Rogers, “Dosimetric Evaluation with Acuros XB dose Calculation Algorithm with Measure- ments in Predicting Doses beyond Different Air Gap Thickness for Smaller and Larger Field Sizes,” Journal of Medical Physics, Vol. 38, No. 1, 2013, pp. 9-14. doi:10.4103/0971-6203.106600 [16] R. Ottosson, A. Karlsson and C. Behrens, “Pareto Front Analysis of 6 and 15 MV Dynamic IMRT for Lung Can- cer Using Pencil Beam, AAA and Monte Carlo,” Physics in Medicine and Biology, Vol. 55, No. 16, 2010, pp. 4521-4533. doi:10.1088/0031-9155/55/16/S07 [17] P. Carrasco, N. Jornet, M. Duch, L. Weber, M. Ginjaume, T. Eudaldo, D. Jurado, A. Ruiz and M. Ribas, “Compari- son of Dose Calculation Algorithms in Phantoms with Lung Equivalent Heterogeneities under Conditions of La- teral Electronic Disequilibrium,” Medical Physics, Vol. 31, No. 10, 2004, pp. 2899-2911. doi:10.1118/1.1788932 [18] N. Reynaert, S. van der Marck, D. Schaart, W. Van der Zee, C. Van Vliet-Vroegindeweij, M. Tomsej, J. Jansen, B. Heijmen, M. Coghe and C. De Wagter, “Monte Carlo Treatment Planning for Photon and Electron Beams,” Ra- diation Physics and Chemistry, Vol. 76, No. 4, 2007, pp. 643-686. doi:10.1016/j.radphyschem.2006.05.015 [19] O. Vassiliev, T. Wareing, J. McGhee, G. Failla, M. Sa- lehpour and F. Mourtada, “Validation of a New Grid Ba- sed Blotzmann Equation Solver for Dose Calculation in Radiotherapy with Photon Beams,” Physics in Medicine and Biology, Vol. 55, No. 3, 2010, pp. 581-598. doi:10.1088/0031-9155/55/3/002 [20] T. Han, J. Mikell, M. Salehpour and Mourtada F, “Do- simetric Comparison of Acuros XB Deterministic Radia- tion Transport Method with Monte Carlo and Model- Based Convolution Methods in Heterogeneous Media,” Medical Physics, Vol. 38, No. 5, 2011, pp. 2651-2664. doi:10.1118/1.3582690 [21] K. Bush, I. Gagne, S. Zavgorodni, W. Ansbacher and W. Beckham, “Dosimetric Validation of Acuros XB with Monte Carlo Methods for Photon Dose Calculations,” Medical Physics, Vol. 38, No. 4, 2011, pp. 2208-2221. doi:10.1118/1.3567146 [22] A. Fogliata, G. Nicolini, A. Clivio, E. Vanetti and L. Co- zzi, “Dosimetric Evaluation of Acuros XB Advanced Dose Calculation Algorithm in Heterogeneous Media,” Ra- diation Oncology, Vol. 6, No. 82, 2011. doi:10.1186/1748-717X-6-82 [23] M. Kan, L. Leung and P. Yu, “Verification and Dosime- tric Impact of Acuros XB Algorithm on Intensity Modu- lated Stereotactic Radiotherapy for Locally Persistent Na- sopharyngeal Carcinoma,” Medical Physics, Vol. 39, No. 8, 2012, pp. 4705-4714. doi:10.1118/1.4736819 [24] T. Han, F. Mourtada, K. Kisling, J. Mikell, D. Followill and R. Howell, “Experimental Validation of Determinis- tic Acuros XB Algorithm for IMRT and VMAT Dose Cal- culations with the Radiological Physics Center’s Head and Neck Phantom,” Medical Physics, Vol. 39, No. 4, 2012, Article ID: 2193. doi:10.1118/1.3692180 [25] L. Hoffmann, M. Jørgensen, L. Muren and J. Petersen, “Clinical Validation of the Acuros XB Photon Dose Cal- culation Algorithm, a Grid-Based Boltzmann Equation Solver,” Acta Oncologica, Vol. 51, No. 3, 2012, pp. 376- 385. doi:10.3109/0284186X.2011.629209 [26] A. Fogliata, G. Nicolini, A. Clivio, E. Vanetti and L. Cozzi, “On the Dosimetric Impact of Inhomogeneity Ma- nagement in the Acuros XB Algorithm for Breast Treat- ment,” Radiation Oncology, Vol. 6, No. 103, 2011. doi:10.1186/1748-717X-6-103 [27] A. Fogliata, G. Nicolini, A. Clivio, E. Vanetti and L. Cozzi, “Critical Appraisal of Acuros XB and Anisotropic Analytic Algorithm Dose Calculation in Advanced Non- Small-Cell Lung Cancer Treatments,” International Jour- nal of Radiation Oncology, Biology and Physics, Vol. 183, No. 5, 2012, pp. 1587-1595. doi:10.1016/j.ijrobp.2011.10.078 [28] L. Tillikainen, H. Helminen, T. Torsti, S. Siljamäki, J. Alakuijala, J. Pyyry J and W. Ulmer, “3D Pencil-Beam- Based Superposition Algorithm for Photon Dose Calcula- tion in Heterogeneous Media,” Physics in Medicine and Biology, Vol. 53, No. 14, 2008, pp. 3821-3839. doi:10.1088/0031-9155/53/14/008 [29] I. Paddick, “A simple Scoring Ratio to Index the Confor- mity of Radiosurgical Treatment Plans,” Technical Note, Journal of Neurosurgery, Vol. 93, No. 3, 2000, pp. 219- 222. [30] N. Papanikolaou, J. Battista, A. Boyer, C. Kappas, C. Klein, T. Mackie, M. Sharpe and J. Van Dyke, “Tissue In- homogeneity Corrections for Megavoltage Photon Beams,” The American Association of Physicist in Medicine, Col- lege Park, 2004. [31] C. Martens, N. Reynaert, C. De Wagter, P. Nilsson, M. Coghe, H. Palmans, H. Thierens and W. De Neve, “Un- derdosage of the Upper-Airway Mucosa for Small Fields as Used in Intensity-Modulated Radiation Therapy: A Comparison between Radiochromic Film Measurements, Monte Carlo Simulations, and Collapsed Cone Convolu- tion Calculations,” Medical Physics, Vol. 29, No. 7, 2002, pp. 1528-1535. doi:10.1118/1.1487421 [32] B. Vanderstraeten, N. Reynaert, L. Paelinck, I. Madani, C. De Wagter, W. De Gersem, W. De Neve and H. Thierens, “Accuracy of Patient Dose Calculation for Lung IMRT: A Comparison of Monte Carlo, Convolution/Superposition, and Pencil Beam Computations,” Medical Physics, Vol. 33, No. 9, 2006, pp. 3149-3158. doi:10.1118/1.2241992 [33] W. De Neve and C. De Wagter, “Lethal Pneumonitis in a Phase I. Study of Chemotherapy and IMRT for NSCLC: the Need to Investigate the Accuracy of Dose Computa- tion,” Radiotherapy Oncology, Vol. 75, No. 2, 2005, pp. 246-247. doi:10.1016/j.radonc.2005.03.024 [34] R. Kornelsen and M. Young, “Changes in the Dose-Pro- file of a 10 MV X-Ray Beam within and beyond Low Density Material,” Medical Physics, Vol. 9, No. 1, 1982, pp. 114-116. doi:10.1118/1.595059
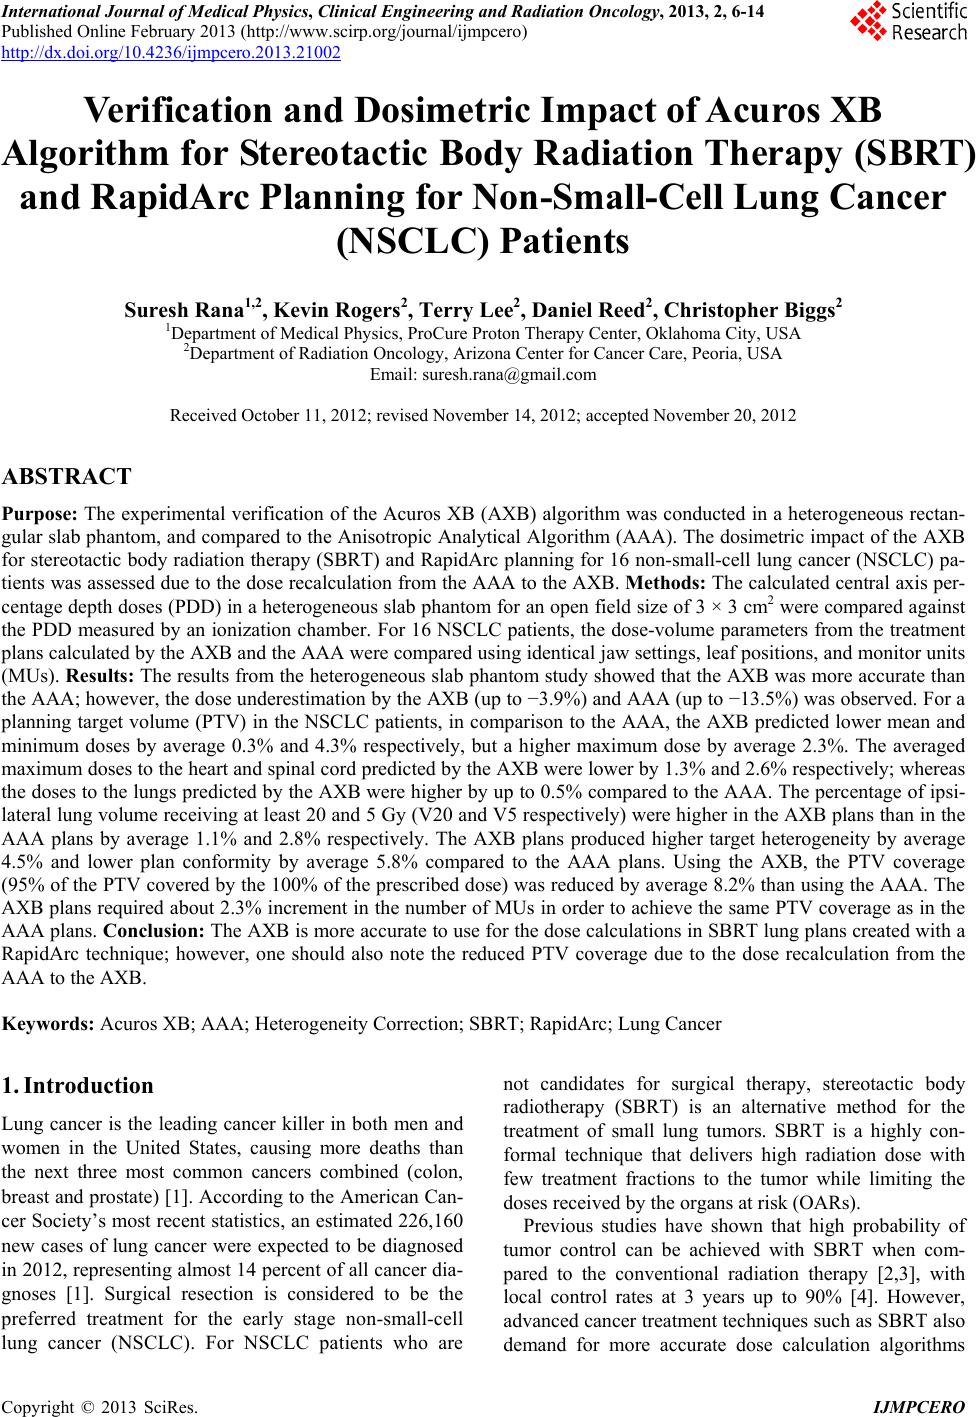
|