Journal of Modern Physics
Vol.3 No.8(2012), Article ID:21667,11 pages DOI:10.4236/jmp.2012.38114
Study of Structural and Electrical Properties of a New Type of Complex Tungsten Bronze Electroceramics; Li2Pb2Y2W2Ti4V4O30
1Department of Physics, Institute of Technical Education and Research, Siksha O Anusandhan University, Bhubaneswar, India
2Department of Physics, Govt. Autonomous College, Bhawanipatna, India
3Department of Physics, KMBB College of Engineering and Technology, Khurda, India
Email: *prdas63@gmail.com, *prdas@iter.ac.in
Received December 20, 2011; revised January 30, 2012; accepted February 25, 2012
Keywords: Electroceramics; Impedance Analysis; Bulk Resistance; Electric Modulus Analysis
ABSTRACT
A polycrystalline ceramic, a new type of complex tungsten bronze type structure, having a general formula Li2Pb2Y2W2Ti4V4O30 has been prepared relatively at low temperature using a mixed-oxide technique after optimizing the calcination conditions on the basis of thermal analysis. The material has been characterized by different experimental techniques. The formation of the material under the reported conditions has been confirmed by an X-ray diffraction technique. A preliminary structural analysis of the material showed the formation of single phase compound in an orthorhombic crystal structure at room temperature. Studies of dielectric properties (εr, tanδ ) of the above compound as a function of temperature at different frequencies exhibit a ferroelectric phase transition of diffuse type. The electrical properties of the material have been studied using ac impedance spectroscopy technique. Detailed studies of impedance and related parameters exhibit that the electrical properties of the material are strongly dependent on temperature, and bear a good correlation with its microstructure. The temperature dependence of electrical relaxation phenomenon in the material has been observed. The bulk resistance, evaluated from complex impedance spectra, is found to decrease with rise in temperature, exhibiting a typical negative temperature co-efficient of resistance (NTCR)—type behavior similar to that of semiconductors. A small contribution of grain boundary effect was also observed. The complex electric modulus analysis indicates the possibility of hopping conduction mechanism in the system with non-exponential type of conductivity relaxation. The ac conductivity spectra exhibit a typical signature of an ionic conducting system, and are found to obey Jonscher’s universal power law.
1. Introduction
Since the discovery of ferroelectric properties in BaTiO3 of perovskite structural family of ABO3 type (A = monodivalent and B = tri-hexavalent ions), a large number of oxides of different structural family have been investigated in the past in search of new and promising materials for industrial applications. It was found that some of the oxides with distorted perovskite structure have complex but stable structure at room temperature with many interesting properties useful for devices [1,2]. Out of them some ferroelectric oxides with tungsten bronze (TB) structure play major role in fabricating ferroelectric devices. Since the discovery of first TB type of ferroelectric compounds, lead metaniobate [3,4] and lead metatantalate [5], there has been rapid progress in search of new TB-type materials, with improved properties for different applications such as capacitors actuators, pyroelectric detectors, transducers, electro-optic, ferroelectric random access memory and display etc. [6-17]. Further, some members of TB structural family, such as barium sodium niobates (BNN), potassium lanthanum niobates (KLN), strontium barium niobates (SBN) etc. have widely been studied by different research groups [18-20] The TB structure (derived from perovskite ABO3 type) consists of a complex array of distorted BO6 octahedral sharing corners in such a way that three different types of interstices (A, B and C) are available for cation substitutions in a general formula (A1)2 (A2)4 (C4) (B1)2 (B2)8 O30. In this structure mono or divalent cations can be accommodated at the A-sites (A1 and A2), tri or pentavalent cations at octahedral sites (B1 and B2) [21] and C-site are generally have small ions or empty. It is expected that the substitutions of varieties of cations at the A and B sites change the crystal structure and physical properties of materials significantly due to their different atomic/ionic size and charge distribution [22]. Most of the TB structure belongs to tetragonal or orthorhombic structure with small distortion of multiple perovskites. Some tungsten bronze ferroelectric ceramics are found to be stable at room temperature with diffuse phase transition and relaxor behavior. Also, structural flexibility and chemical versatility of these materials make them more suitable for device applications. Detailed literature survey on the compounds of the TB ferroelectrics reveals that lots of works have been carried out on simple and/or complex niobates and tantalates [23-31] in the form of single crystal, ceramics or thin film. In view of the importance of the materials for understanding and applications we have already carried out extensive studies on variety of compounds of this TB structural family. Structural and electrical properties of some complex vanadates such as Na2Pb2R2W2Ti4V4O30 (R = Gd, Eu) in the form of ceramics have already been reported by us [32,33]. Recently structural and electrical properties of Ca modified Ba5NdTi3Nb7O30 have been reported by Ganguly et al. [34]. Dielectric and pyroelectric properties of Ba5SmTi3Nb7O30 have also been reported by them later [35]. More recently ferroelectric and related properties of nanocrystalline Ba5SmTi3Nb7O30 have been reported by them [36]. More recently structural and electrical properties of K2Ba2Nd2W2Ti4Nb4O30 have been reported by Pradhan et al. [37].
Though a lot of work has been done on TB compounds [38-41], not much work on dielectric and impedance properties have been reported so far on Li2Pb2Y2W2Ti4V4O30. In view of the above we have synthesized a new complex TB-structure compound Li2Pb2Y2W2Ti4V4O30 having all the valence elements (I-VI), and studied its structural, dielectric and electrical properties as a function of temperature at different frequency.
2. Experimental
2.1. Materials Preparation
The polycrystalline sample of a new complex TB structure compound, Li2Pb2Y2W2Ti4V4O30 was prepared by a standard solid-state reaction (mixed-oxide) method at a relatively low temperature using appropriate amounts (stoichiometric ratio) of high-purity (AR grade) precursors; Li2CO3 (99%, M/s s.d. fine chem. Ltd.), PbO (99.9%, E. Merck India Ltd.), Y2O3 (99.9%, M/s Indian Rare Earth Ltd.), TiO2 (99%, M/s LOBA Chemie Pvt. Ltd., India), WO3, V2O5 (99.9%, M/s LOBA Chemie Pvt. Ltd., India) was mixed first mechanically in an agatemortar and pestle for an hour followed by wet grinding (in methanol) for another hour to achieve homogeneous mixture of the constituents. The mixture so obtained was first fired at a temperature of 425˚C for 10 h in air atmosphere on the basis of thermogravimetric analysis. The firing/calcination was repeated (twice) under similar conditions in order to get the reaction of precursor materials completed. The formation of the compounds was checked by preliminary X-ray structural analysis. The calcined powder of the compounds was cold pressed into cylindrical pellets (10 mm diameter and 1 - 2 mm thickness) with the help of polyvinyl alcohol (PVA) as the binder. An isostatic pressure of 4 × 10⁶ N/m2 was applied for pelletization. The pellets were then sintered at an optimized temperature (450˚C) and time (10 h). The sintered pellets were then polished by fine emery paper to make their faces smooth and parallel. To study the electrical properties of the compound, both the flat surfaces of the pellets were electrode with air-drying conducting silver paste. After electroding, the pellets were dried at 150˚C for 4 h to remove moisture (if any) and then cooled to room temperature before taking any measurement.
2.2. Material Characteristics
Thermal analysis (TGA) studies were carried out in order to optimize the synthesis conditions and to check the thermal stability of the material. About 5 mg of the physical mixture of the material sample was fired in an alumina crucible using a PERKIN ELMER simultaneous thermal analyser (STA) (air flow @ 100 ml/min). The experiment was carried out over a wide temperature range (50˚C - 1000˚C) at a constant heating rate of 20˚C/min. The formation and quality of the compound were checked using an X-ray diffraction (XRD) technique. The XRD pattern of the material was recorded at room temperature using a X-ray powder diffractometer (Rigaku Miniflex, Japan) with  radiation (λ = 1.5405 Å) in a wide range of Bragg angle
  at a scanning rate of 3˚/min for the purpose. The microstructure of the sintered pellet was recorded at room temperature using scanning electron microscope (SEM) (Model: JEOL JSM-5800). The impedance and related parameters were measured using a computer-controlled impedance analyser/LCR meter (HIOKI LCR Hi Tester, Model: 3532) as a function temperature over a wide range of frequencies (100 Hz - 1 MHz) and temperatures (30˚C - 500˚C). A chromel-alumel thermo-couple and a digital millivoltmeter (AGRONIC-161) were used to measure temperatures. An input ac signal of small voltage amplitude (~10 mV) was applied across the sample cell followed by thermal stabilization for 2 h prior to the measurements.
3. Results and Discussion
3.1. Thermal and Structural Properties
The thermogravimetric analysis (TGA) pattern of the mixture recorded from room temperature to 1000˚C (Figure 1) shows differential change in the sample mass on increasing temperature. It appears from the pattern that there is a progressive loss in mass of the physical mixture on heating from 50˚C onwards. The mass loss mainly occur in two steps in the temperature range 1) 75˚C - 200˚C and 2) 250˚C - 400˚C. The mass loss in the temperature range 1) may be attributed to the dehydration of surface absorbed water present in the materials and initiation of intermediate reaction stages among the precursors. Subsequent heating is accompanied by a progressive mass loss with a drastic drop beginning at 300˚C onwards that attains saturation at ~400˚C. The maximum mass loss in the temperature range 2) may be attributed to the evolution of residual gases (i.e., CO2, CO etc.) and the reaction for the formation of the compound. Above 400˚C there is no appreciable mass loss with rise in temperature (even upto 1000˚C) indicating thermal stability of the residual material and completion of reaction leading to the formation of the desired compound on and above 1000˚C.
Figure 1 shows the XRD pattern of Li2Pb2Y2W2Ti4V4O30 at room temperature. The diffraction pattern shows sharp peaks, which are different from those of the ingredients, suggest the formation of a new polycrystalline single phase compound. The diffraction peaks of the compound were indexed in different crystal systems and unit cell configurations using a standard computer program package “POWD” [42]. An orthorhombic unit cell was selected on the basis of good agreement between observed and calculated interplanar spacing d (i.e., ∑∆d = dobs – dcal = minimum). The lattice parameters of the selected unit cell were refined using the least-square sub-routine of the standard computer program package and the refined lattice parameters are: a = 19.2535 Å, b = 18.8143 Å and c = 3.8237 Å. Using refined lattice parameters,

Figure 1. X-ray diffraction pattern and TGA (inset) of Li2Pb2Y2W2Ti4V4O30.
each peak was indexed and interplanar spacing (d) of reflection planes of the compound was calculated, and compared with its observed value (Table 1).The calculated values of crystallite size (average) P of the compound using Scherrer equation: P = kλ/(β1/2cosθ), where k = 0.89, λ = 1.5405 Å and β1/2 = broadening of peak, were found to be 12nm respectively. As the powder samples were used to get XRD pattern, contributions of strain and other effects in the broadening and crystallite size calculation have been ignored.
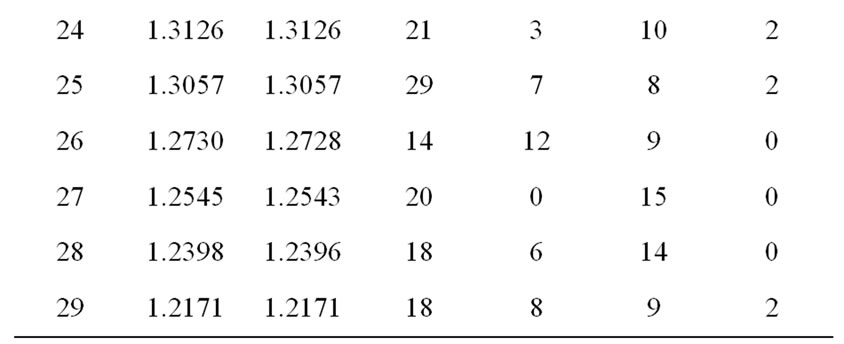
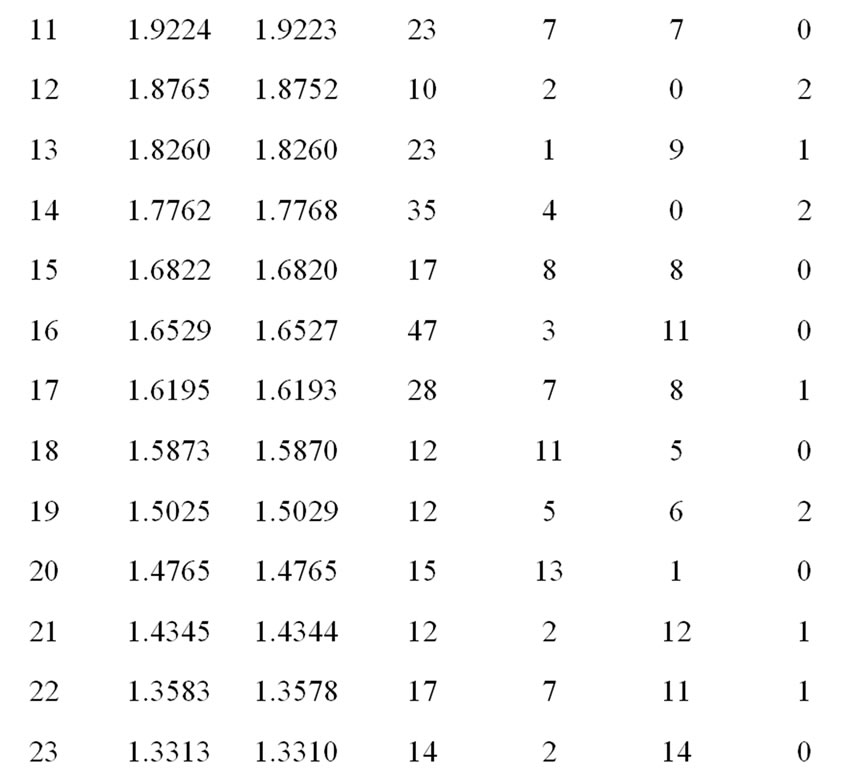
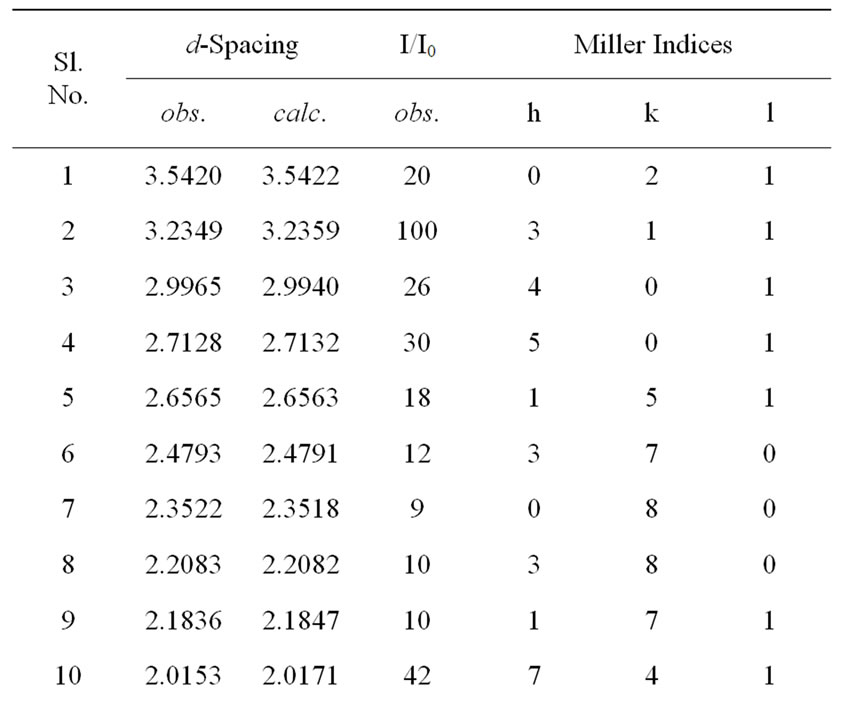
Table 1. Comparison of dobs and dcal values of the compound Li2Pb2Y2W2Ti4V4O30.
Figure 2 shows the SEM micrograph of the sintered pellets recorded at room temperature. The figure shows a group of loosely bound particles with prism type morphology. The loosely bound particles with prism-type size were found to be in the range of ~2 - 6 µm.
3.2. Dielectric Properties
Figure 3 shows the variation of relative dielectric constant (εr) and loss tangent (tanδ) of Li2Pb2Y2W2Ti4V4O30 with temperature at different frequencies. It is observed that both εr and tanδ decrease on increasing frequency, which is a general feature of polar dielectric materials [43]. It is observed that εr increases gradually on increasing temperature to its maximum value (εmax) and then decreases. This dielectric anomaly is observed around 215 K (142˚C) representing the ferroelectric-paraelectric phase transition (Tc). Above Tc, the increase of εr (at lower frequencies) may be due to space charge polarization which arises from mobility of ions and imperfections in the material. These combined effects produce a sharp increase in the relative dielectric constant on increasing temperature. The maximum values of dielectric constant at Tc (i.e., εmax) for frequencies 1, 10, 100 kHz and 1 MHz are 209, 141, 115 and 104 respectively. Similar trend of variation is observed in tanδ as in εr as a function of temperature (Figure 3). An anomaly in tanδ (of diffuse type) may be attributed due to dielectric relaxation in the material. The higher value of tanδ at high temperature may be due to space charge polarization and ferroelectric domain wall contribution.
In the plot of εr vs. temperature, dielectric peaks were found to be broadened or diffused (in the region of phase transition). In order to determine the degree of diffuseness of the dielectric peaks of the compound, a general expression:
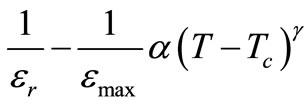
or 
[44] is used, where εr is relative dielectric constant at a temperature T and εmax is its maximum value at Tc. The value of diffusivity (g), calculated from the slope of log (1/εr – 1/εmax) vs. log (T – Tc) plots using the linear portion of the graph (Figure 4), was found to be between 1 (obeying Curie-Weiss law) and 2 (for completely disordered system) which confirms the presence of diffuse phase transition in the prepared material. The calculated value of diffusivity was found to be g = 1.36 in this material which confirms the presence of diffuse phase transition in the material. The diffuse phase transition is usually observed in TB structure ferroelectrics, which can be explained by the presence of certain non-equivalent position in the unit cell [45].

Figure 2. SEM micrographs of Li2Pb2Y2W2Ti4V4O30.
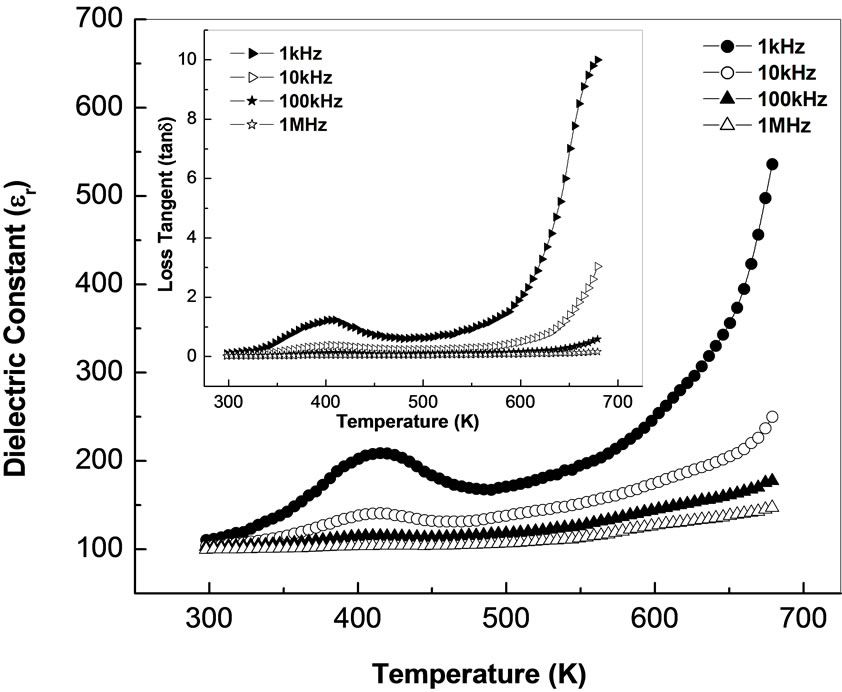
Figure 3. Variation of relative dielectric constant (εr) and loss tangent (tanδ) [inset] as a function of temperature at different frequencies.
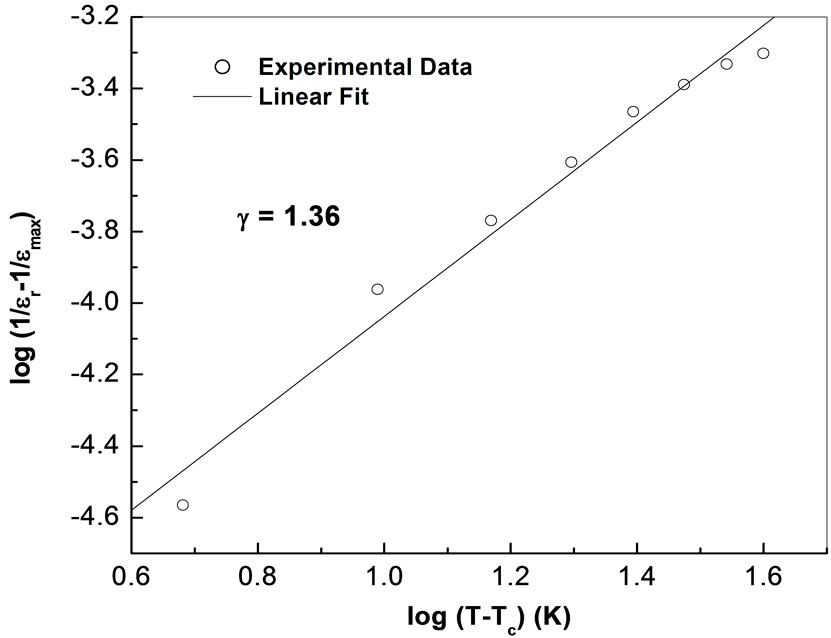
Figure 4. Variation of ln[1/ε – 1/εmax] with ln(T – Tc) at 10 kHz.
3.3. Impedance Spectrum Analysis
Impedance spectroscopy (IS) is the most reliable technique to study the electrical properties and process of the materials. The IS technique is based on analyzing the ac response of a system to a sinusoidal perturbation, and subsequent calculation of impedance and related parameters as a function of frequency of the perturbation. Each parameter can be used to highlight a particular aspect of the materials. A parallel resistance and capacitance circuit corresponding to equivalent to the individual component of the materials (i.e., bulk and grain boundary) represents a semicircle. Impedance data of materials (i.e., capacitive and resistive components), represented in the Nyquist plot, lead to a succession of semicircle. The electrical properties are often presented in terms of impedance (Z) [46-50], permittivity ( ) [49] and electrical modulus (M) [53-55]. The frequency dependence of dielectric properties of the materials is normally described in terms of complex dielectric constant (
 ), complex impedance (Z*), electric modulus (M*) and dielectric loss (
 ) and are related to each other as
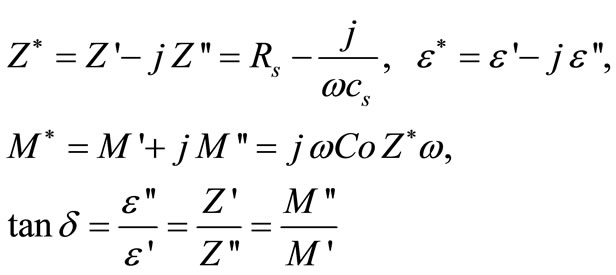
where ω is the angular frequency,  is the permittivity in free space, Rs and Cs are resistance and capacitance in series respectively. As the above expressions offer a wide scope for graphical representation, they can be used to calculate complex impedance of the electrode/ceramic/ electrode capacitor (demonstrated as the sum of the single RC circuit with parallel combination) as per the relation:

Separating the real and imaginary part of the above equation, they can be written as
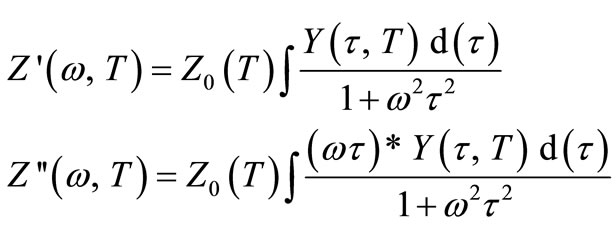
Here,  represents the relaxation time, T = time period and Y (
 , T) = distribution function of relaxation time. The variation of imaginary part of complex impedance
  provides information about the distribution function Y (
 , T).
, T).
Figure 5 shows the variation of real part of impedance ( , i.e., bulk resistance) with frequency at different temperatures. The values of
  decrease with rise in frequency and temperature. The magnitude of
  decreases on increasing temperature in the low-frequency range which merges in the high-frequency region irrespective of temperature. This nature may be due to the release of space charge [56]. The reduction in barrier properties of the materials with rise in temperature may be a responsible factor for enhancement of a.c. conductivity of the materials at higher frequencies [53,54]. Further, in the low frequency region, there is a decrease in magnitude of
  with rise in temperature showing negative temperature coefficient of resistance (NTCR) behavior. This behaviour is changed drastically in the high frequency region showing complete merger of
  plot above a certain fixed frequency. At high frequency
  value of each temperature coincides implying the possible release of space charge [50]. A particular frequency at which
  becomes independent of frequency was observed to shift towards the higher frequency side (with rise in temperature). The shift in
  plateau indicates the existence of frequency relaxation process in the material. The curves display single relaxation process and indicate the increase in a.c. conductivity with increase in temperature and frequency [51].
Figure 5 shows the variation of imaginary part of impedance ( ) with frequency (i.e., loss spectrum) at different temperatures. The loss spectrum of the materials can be characterized by few important features such as, 1) a monotonous decrease in
  in the low temperature region, 2) appearance of peaks in the loss spectrum at high temperatures, 3) significant peak broadening with increase in temperature, and 4) existence of symmetric peak broadening. The absence of peaks upto a temperature of 325˚C in the loss spectrum suggests the absence
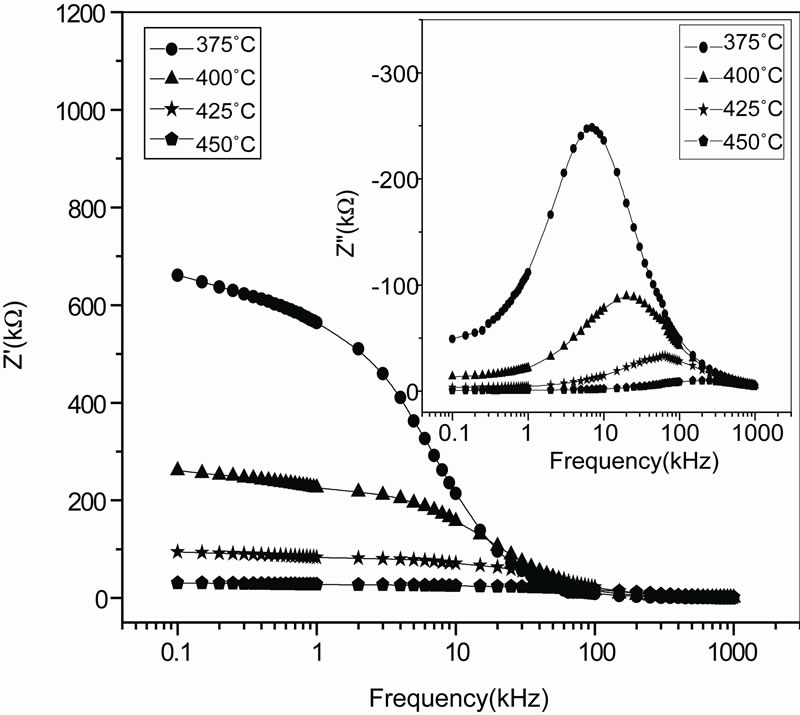
Figure 5. Variation of real (Z') and imaginary part (Z") [inset] of impedance as a function of frequency at different temperatures.
of current dissipation in this low temperature region. The pattern shows peaks at a particular frequency which describes the type and strength of electrical relaxation phenomenon in the materials [51]. The value of  reaches a maximum peak (
 ) above 350˚C. It is expected that low temperature peaks (<350˚C), was beyond the range of frequency used. The
  shifts to higher frequency side on increasing temperature indicating increase of tangent loss in the samples. A significant increase in the broadening of the peaks with increase in temperature suggests the existence of a temperature dependence of electrical relaxation phenomenon in the materials. The relaxation process may be due to the presence of electrons/immobile species at low temperatures and defects/vacancies at higher temperatures. The asymmetric broadening of the peaks suggests a spread of relaxation time with two equilibrium positions. The peak heights are proportional to bulk resistance (Rb), and can be estimated and explained by the equation,

in  versus frequency plots. Further, the magnitude of
  decreases gradually with a shift in peak frequency towards high frequency side, and it finally merges in the high frequency region. This is an indication of the accumulation of space charge in the material.
Figure 6 shows complex impedance spectrum (Nyquist plot) of the compound measured at different temperatures over a wide range of frequency range (100 Hz - 1 MHz). The effect of temperature on impedance characteristics of the material becomes clearly visible in the figure. The impedance property of the material is characterized by the appearance of semicircular arcs whose pattern of evolution changes with change in temperature. The extent of intercept on the real axis and its number in the spectrum provide very important information on electrical behaviour of the material under investigation. Such pattern provides information on the kind of electrical processes occurring within the material and their correlation with microstructure when modeled in terms of an equivalent electrical circuit. The semicircular arcs of the impedance pattern can mainly be attributed to a parallel combination of resistance and capacitance. As temperature increases, the arc progressively becomes semicircular with a shift of the centre towards origin of the complex plane plot. With further increase in temperature, the slope of the line decreases, and bend towards  -axis (above 300˚C), and thus a semicircle could be traced indicating the increase in conductivity of the sample [53,54]. The presence of semicircular arcs for temperatures upto 450˚C suggests that the electrical processes in the material arise basically due to the contribution from bulk material (grain interior), and can be modeled as an equivalent electrical circuit comprising of a parallel combination of bulk resistance (Rb) and bulk capacitance (Cb) [55]. The electrical process at these temperatures may be considered due to intra-grain phenomenon. However, a tendency to form a small semicircle is seen in the
  -
- plots at high temperatures indicating very small contributions of grain boundary in the material. Thus detailed analysis of second semicircles has been ignored here. The value of Rb and Cb at different temperatures can be obtained from impedance spectrum. It can be seen that the values of Rb and Cb decrease with rise in temperature. The decrease in Rb with the rise in temperature indicates the NTCR behaviour of the compound, which was also observed in
  versus frequency plot. The relaxation time (
 ) was estimated from the maxima of the semicircle (due to bulk effect) of the complex impedance plots.
In order to examine the effect of space charge polarization in low frequency range and at high temperatures, we have plotted the real and imaginary part of dielectric constant (i.e.,  ,
, ) with frequency at different temperatures. Figure 7 shows the variation of
  and
and  with frequency above 350˚C. There is a sharp decrease in value of
  and
and  in the lower frequency region and showing a frequency independent value of these parameters in high frequency region. The strong decrease of real and imaginary part of dielectric constant towards low frequency range may be due space charge polarization and inter face effect.
Figure 8 shows the variation of lntb with inverse of absolute temperature (103/T). The value of t decreases with rise in temperature, and thus temperature dependent relaxation time for bulk follows the Arrhenius relation: t =  where to is the pre-exponential factor, KB is Boltzmann constant and T is the absolute temperature. The calculated value of activation energy (Ea) is 8.05 eV which is consistent with the reported ones [57].
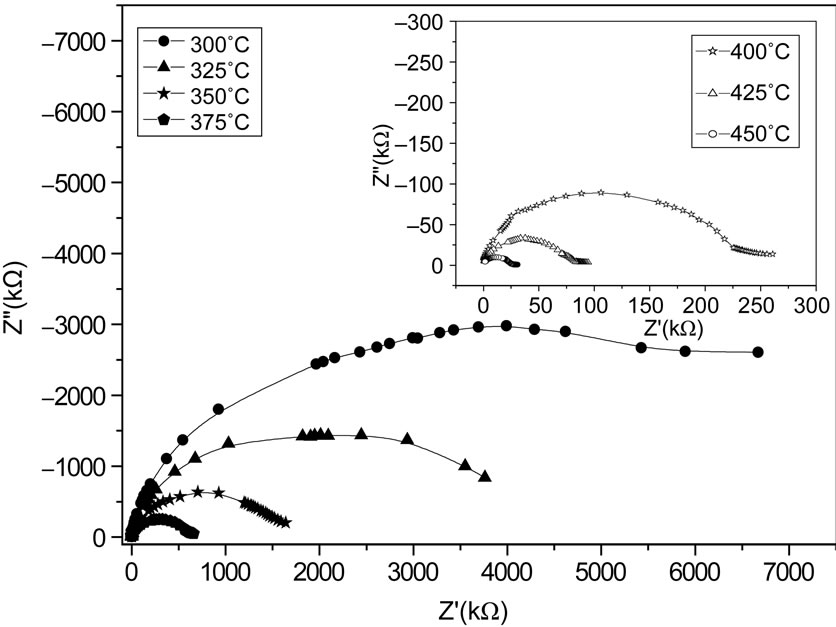
Figure 6. Nyquist (Z'-Z'') plot of the compound Li2Pb2Y2W2Ti4V4O30 at different temperatures.
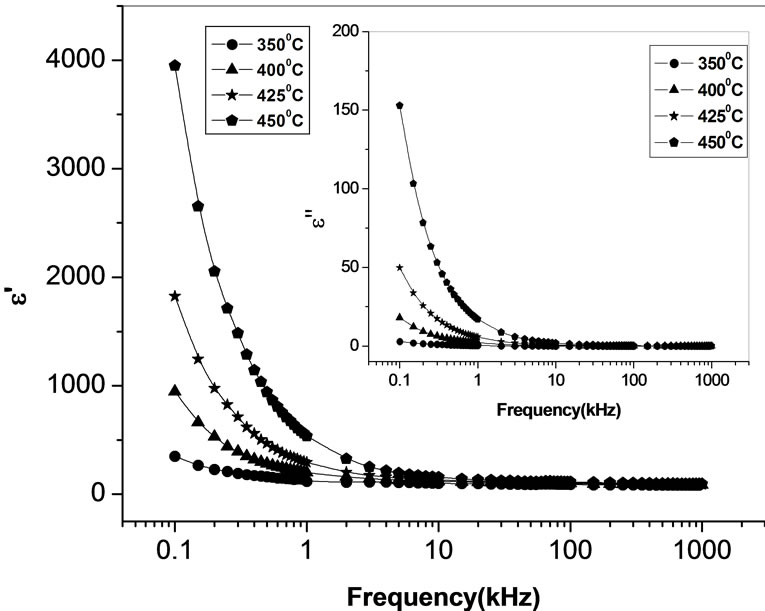
Figure 7. Variation of real (ε') and imaginary part (ε'') [inset] of dielectric constant as a function of frequency at different temperatures.
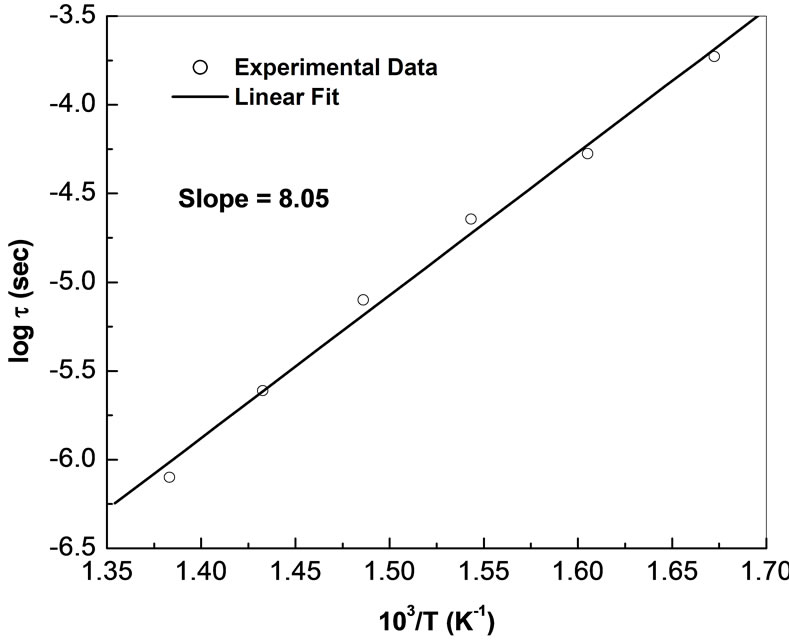
Figure 8. Variation of lnt with absolute temperature (103/T) for Li2Pb2Y2W2Ti4V4O30.
3.4. Complex Electric Modulus Analysis
The complex modulus formalism is very convenient tool to interpret the dynamical aspects of electrical transport phenomena. This technique also provides an insight into the electrical processes using the following relations of electrical modulus.
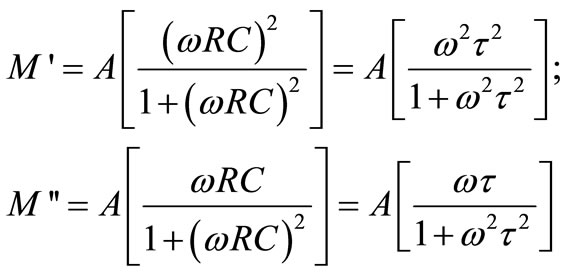 where
where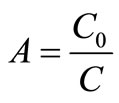 .
.
Using the above modulus formalism the inhomogeneous nature of polycrystalline ceramics with bulk and grain boundary effects can easily be probed, which cannot be distinguished from complex impedance plots. The other major advantage of the electric modulus formalism is to suppress the electrode effect.
The complex electric modulus is usually calculated from the impedance data using the following relations:

where,  and
and ,
,  = angular frequency, C0 = geometrical capacitance =
 ,
,  = permittivity of free space, A = area of electrode surface, t = thickness.
Figure 9 shows the variation of  as a function of frequency for Li2Pb2Y2W2Ti4V4O30 at selected temperatures. These figures exhibit that
  approaches to zero in the low frequency region, and a continuous dispersion on increasing frequency, with a tendency to saturate at a maximum asymptotic value (i.e.,
 ) in the high frequency region at all the temperatures. Such observation may possibly be related to a lack of a restoring force governing the mobility of the charge carriers under the action of an induced electric field. This behaviour supports the short range mobility of charge carrier.
Figure 9 (inset) shows the variation of  with frequency for Li2Pb2Y2W2Ti4V4O30 at selected temperatures. It is clear from the figures that the modulus spectrum is broader and the peaks are asymmetric. The peaks shift towards higher frequency side on increasing temperature of the sample. This behaviour suggests that the spectral intensity of the dielectric relaxation is activated thermally in which hopping process of charge carriers and small polarons dominate intrinsically. Both the electric modulus and the impedance formalism plots produce peaks, which are broader as compared to that predicted by Debye for relaxation phenomenon, and are significantly asymmetric. The relaxation time (
 ) associated with each peak is determined from the frequency at which
  occurs.
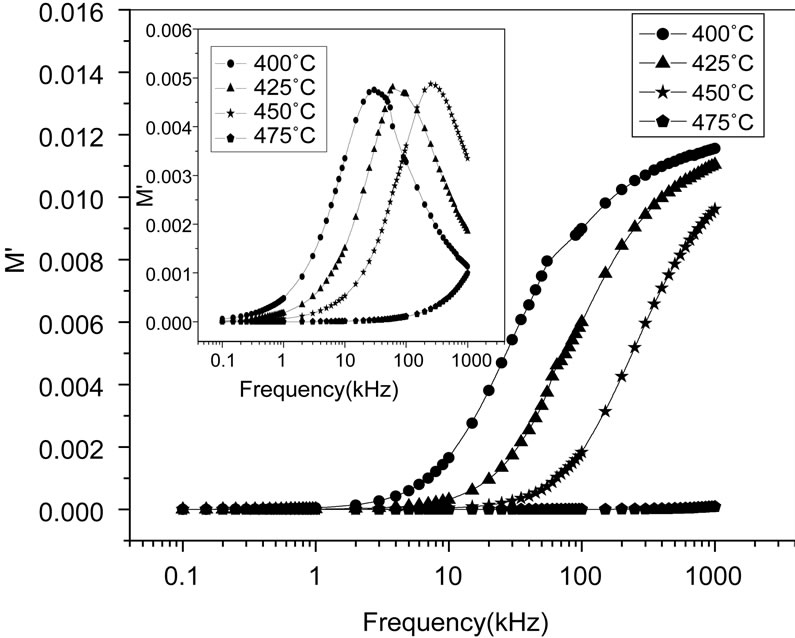
Figure 9. Variation of real part (M') and imaginary part (M'') [inset] with frequency at different temperatures.
At the maxima of  the equation
 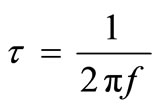 holds good. The magnitude of the peak increases on increasing temperature. The broad envelope of electrical relaxation can be assigned to relaxation occurring within the bulk of the material [50,51].
Figure 10 shows the complex modulus spectrum i.e., ( ) of Li2Pb2Y2W2Ti4V4O30 at selected temperatures. The asymmetric semicircular arc observed earlier is now confirmed from this method and appears to overlap at all the temperatures. This may be due to the presence of electrical relaxation phenomena in the material. The curves don’t form semicircles as required for the ideal Debye model. Rather they possess the shape of deformed arcs with their centres positioned below the x-axis. This indicates the spread of relaxation with different mean time constants, and hence non-Debye type of relaxation in the material is confirmed. However the single semicircular arc confirms the formation of singlephase compound, which is also evident from XRD studies. The modulus plane shows a single semicircle and its intercept on the real axis is the total capacitance contributed by the grain and grain boundaries. Further, it is confirmed from our
  vs frequency plot that the grain boundary effect is negligibly small or zero, and does not affect the relaxation process much. However, there is a marked change in the shape and size of modulus spectrum with rise in temperature suggesting a change in the capacitance value of the material with temperature.
3.5. a.c. Conductivity Analysis
The temperature dependence of ac conductivity at different frequencies (Figure 11) can be calculated from the dielectric data using the relation: σac = ωεε0tanδ, where ε0 = dielectric permittivity of free space. The activation energy Ea (which is dependent on a thermally activated process) can be calculated using an empirical relation: σac = , where k = Boltzmann constant, σo = pre-exponential factor. For each frequency in the plot, occurrences of different slopes of the different temperature regions suggest the presence of multiple conduction processes in the sample with different activation energy [58].
The frequency dependence of ac conductivity  at various temperatures is shown in Figure 12. In the low temperature region the conductivity increases with increase in frequency which is a characteristic of
  (n = exponential). At higher temperatures and low frequencies, conductivity shows a flat response while it has
  dependence at high frequencies. The phenomenon of the conductivity dispersion in solids is generally analysed using Jonscher’s power law;
  where
where  is the dc conductivity at a particular temperature, A is temperature dependent constant and n is temperature dependent exponent in the range of 0 ≤ n ≤ 1. The n represents the degree of interaction between mobile ions with the lattices around them, and A determines the strength of polarisability. The materials obey universal power law, and are confined by a typical fit of the above equation to the experimental data (Figure 13). The estimated value of n is 0.4725 and 0.6723 for Li2Pb2Y2W2Ti4V4O30 at temperatures 350˚C and 375˚C respectively. According to Jonscher [59], the origin of frequency dependence of conductivity lies in the relaxation phenomenon arising due to mobile charge carriers. The low frequency dispersion attributes to the ac conductivity whereas the frequency independent plateau region of the conductivity pattern corresponds to dc conductivity of the material. The temperature at which grain resistance dominates over grain boundary resistance is marked by a change in slope of ac conductivity with frequency. The frequency at which the change of slope
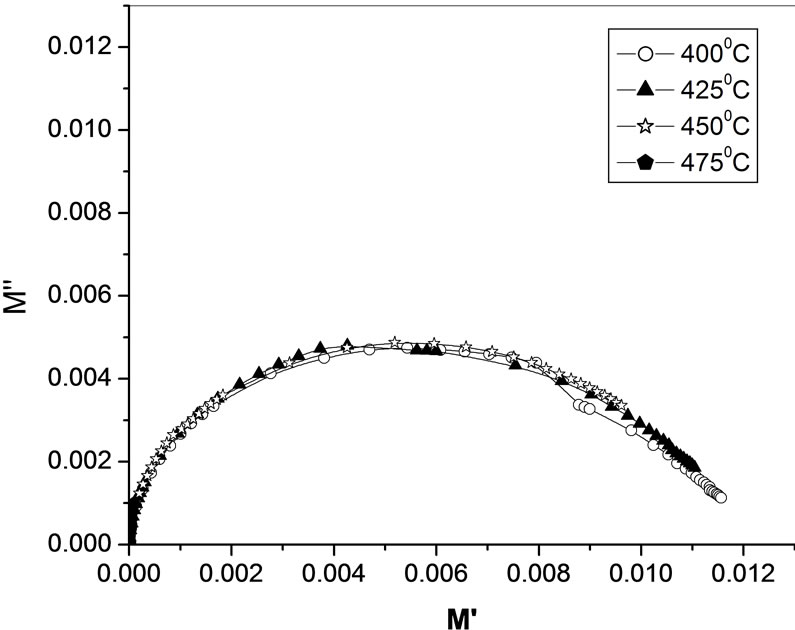
Figure 10. Complex modulus spectrum of Li2Pb2Y2W2Ti4V4O30 at different temperatures.
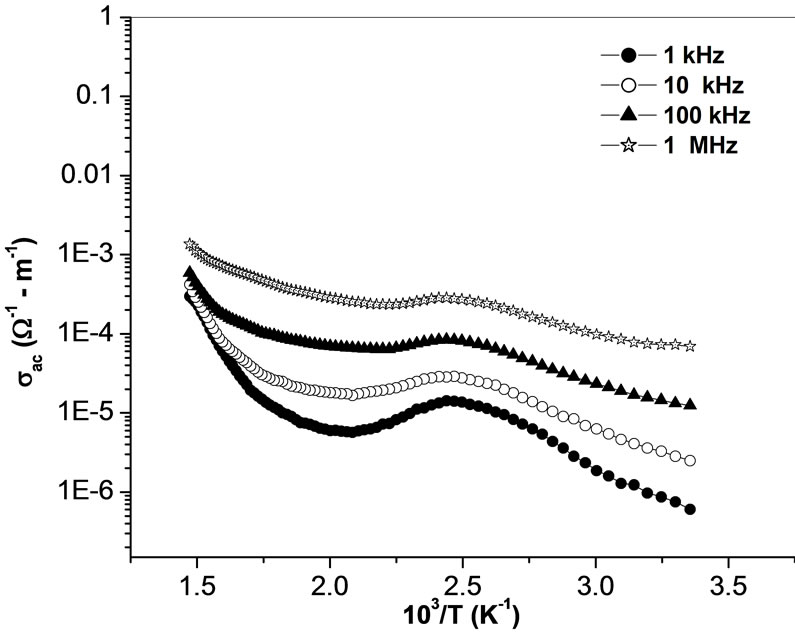
Figure 11. Variation of ac conductivity σ (ω) with temperature at different frequencies.
takes place is known as the hoping frequency. It corresponds to polaron hopping of charged species. The hopping frequency shifts to higher frequency side on increasing temperature. The charged species that have been accumulated at the grain boundaries have sufficient energy to jump over the barrier on increasing temperature. It is clear from Figure 12 that at high temperatures and low frequencies, the curves tend to merge with a constant slope. This frequency independent behaviour is attributed to the contribution from dc conduction.
3.6. Hysteresis Study
The hysteresis loop is one of the important criteria for the confirmation of the existence of ferroelectric property in a compound. Figure 14 shows the hysteresis loop of Li2Pb2Y2W2Ti4V4O30 at room temperature with an applied field of 700 V/cm. the nature of loops suggest that the material is lossy and polycrystalline.
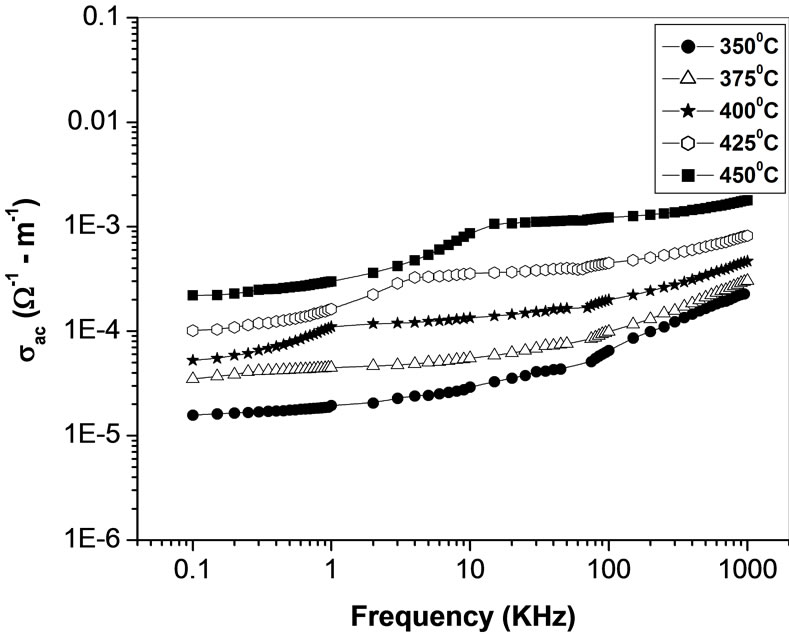
Figure 12. Variation of ac conductivity σ(ω) with frequency at different temperatures.
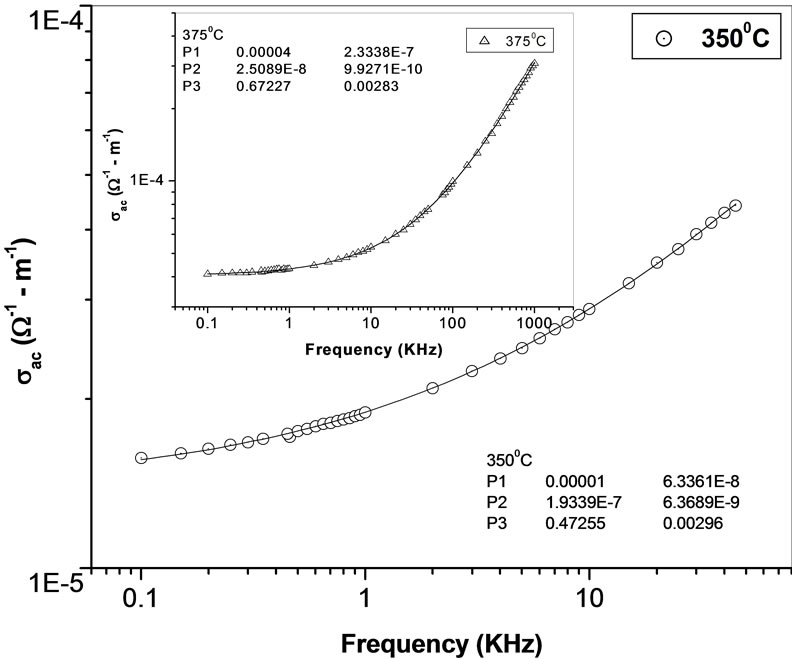
Figure 13. AC fitting curve for Li2Pb2Y2W2Ti4V4O30 at different temperatures (inset).
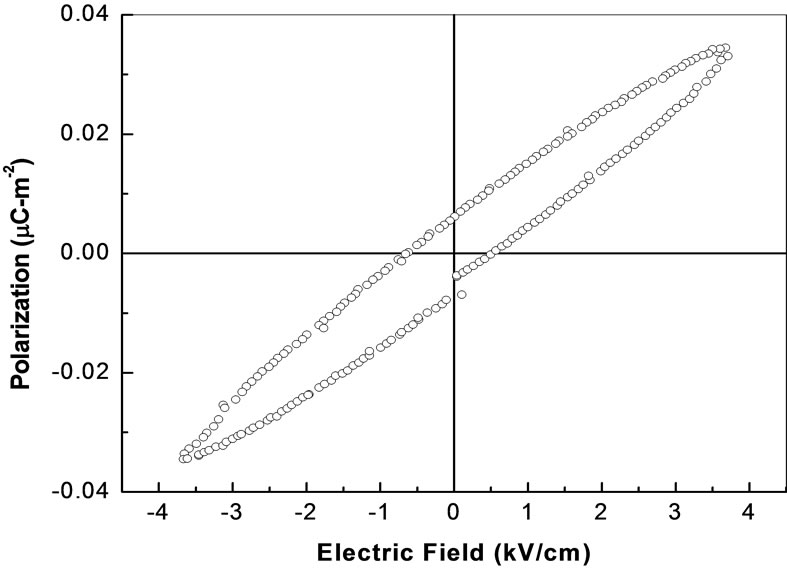
Figure 14. Hysteresis loop of Li2Pb2Y2W2Ti4V4O30.
4. Conclusions
The polycrystalline sample of Li2Pb2Y2W2Ti4V4O30 was prepared by a mixed-oxide technique. X-ray analysis exhibits the orthorhombic crystal structure of the compound at room temperature. The surface morphology of the compound, studied by SEM, gives the loosely bound particles with prism-type size of the order of ~2 - 6 µm. This compound shows diffuse-type ferroelectric phase transition with transition temperature well above room temperature (~415 K). The complex impedance plots reveal that the material exhibits 1) electrical transport (conduction) due to bulk material, 2) negative temperature coefficient (NTCR)—type behavior, and 3) temperature dependent relaxation phenomenon.
Complex impedance analysis suggests the dielectric relaxation in the material is of polydispersive non-Debye type. The complex electric modulus analysis has confirmed the single-phase behaviour of the material in agreement with the information obtained from XRD pattern. Electrical modulus analysis indicated non-exponential type conductivity relaxation in the material. The frequency dependence of ac conductivity obeys Jonscher’s universal power law.
REFERENCES
- K. Uchino, “Ferroelectric Devices,” Marcel Dekker Inc., New York, 2000.
- M. E. Lines and A. M. Glass, “Principle and Application of ferroelectrics and Related Materials,” Clarndon Press, Oxford, 1977.
- G. Goodman, “Ferroelectric Properties of Lead Metaniobate,” Journal of the American Ceramic Society, Vol. 36, No. 11, 1953, pp. 368-372. doi:10.1111/j.1151-2916.1953.tb12820.x
- M. H. Francombe and B. Lewis, “Structural, dielectric and Optical Properties of Ferroelectric Lead Metaniobate,” Acta Crystallographica, Vol. 11, 1958, pp. 696-703. doi:10.1107/S0365110X58001882
- G. A. Smolenskii and A. I. Agranovskaya, Doklady Akademii Nauk SSSR, Vol. 97, 1954, p. 237.
- A. M. Glass, “Ferroelectric Sr1-xBaxNb2O6 as a Fast and Sensitive Detector of Infrared Radiation,” Applied Physics Letters, Vol. 13, No. 4, 1968, pp. 147-149. doi:10.1063/1.1652547
- S. Sakamoto and T. Yazaki, “Anomalous Electro-Optic Properties of Ferroelectric Strontium Barium Niobate and Their Device Applications,” Applied Physics Letters, Vol. 22, No. 9, 1973, pp. 429-431. doi:10.1063/1.1654700
- J. M. Haussone, G. Desgardin, A. Herve and B. Boufrou, “Dielectric ceramics with relaxors and a Tetragonal Tungsten Bronze,” Journal of the European Ceramic Society, Vol. 10, No. 6, 1992, pp. 437-452. doi:10.1016/0955-2219(92)90019-A
- H. El Alaoui-Belghiti, R. Von der Muhll, A. Simon, M. Elaatmani and J. Ravez, “Relaxor or Classical Ferroelectric Behavior in ceramics with composition Sr2−xA1+xNb5 O15−xFx (A = Na, K),” Materials Letters, Vol. 55, No. 3, 2002, pp. 138-144. doi:10.1016/S0167-577X(01)00636-X
- X. M. Chen, Z. Y. Xu and J. Li, “Dielectric ceramics in the BaO-Sm2O3-TiO2-Ta2O5 quaternary system,” Journal of Materials Research, Vol. 15, no. 1, 2000, pp. 125- 129. doi:10.1557/JMR.2000.0021
- X. L. Zhu, X. M. Chen, X. Q. Liu and Y. Yuan, “Dielectric characteristics and Diffuse Ferroelectric Phase Transition in Sr4La2Ti4Nb6O30 tungsten bronze ceramics,” Journal of Materials Research, Vol. 21, No. 7, 2006, pp. 1787-1792. doi:10.1557/jmr.2006.0201
- C. Huang, A. S. Bhalla and R. Guo, “Measurement of Microwave Electro-Optic Coefficient in Sr0.61Ba0.39Nb2O6 Crystal Fiber,” Applied Physics Letters, Vol. 86, No. 21, 2005, Article ID: 211907. doi:10.1063/1.1937997
- K. S. Rao and N. V. Nath, “Influence of Rare-Earth Ion on Piezoelectric and Pyroelectric Properties of PBN System,” Ferroelectrics, Vol. 325, No. 1, 2005, pp. 15-24. doi:10.1080/00150190500326605
- W. Jiang, W. Cao, X. Yi and H. Chen, Journal of Applied Physics, Vol. 97, 2005.
- M. O. Ramirez, D. Jaque, L. E. Bausa, J. S. Garcia and A. A. Kaminskii, Physical Review Letters, Vol. 95, 2005.
- E. L. Venturini, E. G. Spencer and A. A. Ballman, “ElastoOptic Properties of Bi12GeO20, Bi12SiO20, and SrxBa1−x Nb2O6,” Journal of Applied Physics, Vol. 40, No. 4, 1969, pp. 1622-1625. doi:10.1063/1.1657822
- M. Lee and R. S. Feigelson, “Effects of reduction treatment on the Photorefractive Properties of Pb0.5Ba0.5Nb2 O6,” Optical Materials, Vol. 21, No. 4, 2003, pp. 759- 764. doi:10.1016/S0925-3467(02)00096-4
- L. G. Van Uitert, S. Singh and H. J. Leninstein, “A New and Stable Nonlinear Optical Material,” Applied Physics Letters, Vol. 11, No. 5, 1967, pp. 161-163. doi:10.1063/1.1755079
- J. J. Rubin, L. G. Van Uitert and H. J. Levinstein, “The growth of single Crystal Niobates for Electro-Optic and Non-Linear Applications,” Journal of Crystal Growth, Vol. 1, No. 5, 1967, pp. 315-317. doi:10.1016/0022-0248(67)90039-5
- R. R. Neurgaonkar, J. G. Nelson and J. R. Oliver, “Piezoelectric and Ferroelectric Properties of La-modified and Unmodified Tungsten Bronze Pb0.6Ba0.4Nb2O6 dense ceramics,” Materials Research Bulletin, Vol. 26, No. 8, 1991, pp. 771-777. doi:10.1016/0025-5408(91)90066-U
- P. B. Jamieson, S. C. Abrahams and L. Bernstein, “Ferroelectric Tungsten Bronze-Type Crystal Structures. I. Barnium Strontium Niobate Ba0.27Sr0.75Nb2O5.78,” Journal of Chemical Physicss, Vol. 48, No. 11, 1968, pp. 5048-5058. doi:10.1063/1.1668176
- R. R. Neurgaonkar, J. G. Nelson and J. R. Oliver, “Ferroelectric and Structural Properties of the Tungsten Bronze System K2Ln3+Nb5O15, Ln = La to Lu,” Materials Research Bulletin, Vol. 25, No. 8, 1990, pp. 959-970. doi:10.1016/0025-5408(90)90002-J
- M. R. Raju and R. N. P. Choudhary, “Effect of Zr substitution on Structural, Dielectric and Electrical Properties of Sr5SmTi3Nb7O30 ceramics,” Materials Chemistry and Physics, Vol. 99, No. 1, 2006, pp. 135-143. doi:10.1016/j.matchemphys.2005.09.084
- W. Chen, Y. Kinemuchi, K. Watari, T. Tamura and K. Miwa, “Preparation of Grain-Oriented Sr0.5Ba0.5Nb2O6 Ferroelectric Ceramics by Magnetic Alignment,” Journal of the American Ceramic Society, Vol. 89, No. 1, 2006, pp. 381-384. doi:10.1111/j.1551-2916.2005.00694.x
- J.-H. Ko, S. Kojima, S. G. Lushnikov, R. S. Katiyar, T.-H. Kim and J.-H. Ro, “Low-Temperature Transverse Dielectric and Pyroelectric Anomalies of Uniaxial Tungsten Bronze Crystals,” Journal of Applied Physics, Vol. 92, No. 3, 2002, pp. 1536-1543. doi:10.1063/1.1491995
- A. K. Singh, R. N. P. Choudhary, “Study of Ferroelectric Phase Transition in Pb3R3Ti5Nb5O30 (R = Rare Earth Ion) Ceramics,” Ferroelectrics, Vol. 325, No. 1, 2005, pp. 7-14. doi:10.1080/00150190500326522
- M.-S. Kim, J.-H. Lee, J.-J. Kim, H. Y. Lee and S.-H. Cho, “Microstructure evolution and Dielectric Properties of Ba5-xNa2xNb10O30 ceramics with different Ba-Na Ratios,” Journal of Solid State Electrochemistry, Vol. 10, No. 1, 2006, pp. 18-23. doi:10.1007/s10008-005-0647-9
- L. Fang, H. Zhang, T. H. Huang, R. Z. Yuan and H. X. Liu, “Preparation, structural, and Dielectric Properties of Ba5YZnM9O30 (M = Nb, Ta) ceramics,” Journal of Materials Science, Vol. 40, No. 2, 2005, pp. 533-535. doi:10.1007/s10853-005-6122-2
- B. Behera, P. Nayak and R. N. P. Choudhary, “Structural, dielectric and electrical properties of LiBa2X5O15 (X = Nb and Ta) ceramics,” Materials Chemistry and Physics, Vol. 100, No. 10, 2006, pp. 138-141. doi:10.1016/j.matchemphys.2005.12.022
- P. R. Das, R. N. P. Choudhary and B. K. Samantray, “Diffuse Ferroelectric Phase Transition in Na2Pb2Sm2W2 Ti4Nb4O30 ceramics,” Materials Chemistry and Physics, Vol. 101, No. 1, 2007, pp. 228-233. doi:10.1016/j.matchemphys.2006.04.005
- P. R. Das, R. N. P. Choudhary and B. K. Samantray, “Diffuse Ferroelectric Phase Transition in Na2Pb2Nd2W2 Ti4Nb4O30 ceramic,” Journal of Alloys and Compounds, Vol. 448, No. 1-2, 2008, pp. 32-37. doi:10.1016/j.jallcom.2006.10.090
- P. R. Das, R. N. P. Choudhary and B. K. Samantray, “Diffuse phase transition in Na2Pb2R2W2Ti4V4O30 (R= Gd, Eu) Ferroelectric Ceramics,” Journal of Physics and Chemistry of Solids, Vol. 68, No. 4, 2007, pp. 516-522. doi:10.1016/j.jpcs.2007.01.015
- P. R. Das, B. Pati, B. C. Sutar and R. N. P. Choudhary, Advanced Materials Letters, 2011, in press.
- P. Ganguli and A. K. Jha, “Investigations of Structural, Dielectric and Electrical Behaviour of Calcium Substituted Ba5NdTi3Nb7O30 Ferroelectric Ceramics,” Integrated Ferroelectrics, Vol. 115, No. 1, 2010, pp. 149-156. doi:10.1080/10584587.2010.488566
- P. Ganguli and S. Devi and A. K. Jha, “Dielectric and Pyroelectric Studies of Tungsten-Bronze Structured Ba5 SmTi3Nb7O30 Ferroelectric Ceramics,” Ferroelectrics, Vol. 381, No. 1, 2009, pp. 111-119. doi:10.1080/00150190902869772
- P. Ganguli and A. K. Jha, “Synthesis and Characterization of Tungsten-Bronze Structured Nanocrystalline Ba5 SmTi3Nb7O30 Ferroelectric Ceramics by High-Energy Ball Milling,” Journal of the American Ceramic Society, Vol. 94, No. 6, 2011, pp. 1725-1730. doi:10.1111/j.1551-2916.2010.04321.x
- D. K. Pradhan, B. Behera and P. R. Das, Journal of Materials Science, 2011, in press.
- G. Burns and F. H. Dacol, “Glassy Polarization Behavior in K2Sr4 (NbO3)10-type ferroelectrics,” Physical Review B, Vol. 40, No. 7, 1984, pp. 4012-4013. doi:10.1103/PhysRevB.30.4012
- A. K. Singh and R. N. P. Choudhary, “Diffuse ferroelectrics Phase Transition in Pb5RTi3Nb7O30 (R=Eu and Gd),” Materials Letters, Vol. 57, No. 24-25, 2003, pp. 3722-3728. doi:10.1016/S0167-577X(03)00169-1
- J. Ravez, H. El Alaoui-Belghiti, A. Simon and M. Elaatmani, “Relations between ionic order or disorder and classical or relaxor Ferroelectric Behaviour in Two Lead-Free TKWB-Type Ceramics,” Materials Letters, Vol. 47, No. 3, 2001, pp. 159-164. doi:10.1016/S0167-577X(00)00228-7
- Y. h. Xu, Z. Li, W. Li and H. Wang, “Phase transition of some ferroelectric niobate crystals with Tungsten-Bronze Structure at Low Temperatures,” Physical Review B, Vol. 40, No. 17, 1989, pp. 11902-11908. doi:10.1103/PhysRevB.40.11902
- E. Wu, POWD, “An Interactive Powder Diffraction Data Interpretation and Indexing Program, Ver. 2.1,” School of Physical Sciences, Flinders University South Bedford Park, Australia.
- J. C. Anderson, “Dielectrics,” Chapman & Hall, London, 1964.
- B. Behera, P. Nayak and R. N. P. Choudhary, “Structural and Impedance Properties of KBa2V5O15 ceramics,” Materials Research Bulletin, Vol. 43, No. 5, 2008, pp. 401- 410. doi:10.1016/j.materresbull.2007.02.042
- A. K. Jonscher, “The ‘universal’ dielectric response,” Nature, Vol. 267, 1977, pp. 673-679. doi:10.1038/267673a0
- S. Sen and R. N. P. Choudhary, “Impedance studies of Sr modified BaZr0.05Ti0.95O3 ceramics,” Materials Chemistry and Physics, Vol. 87, No. 2-3, 2004, pp. 256-263. doi:10.1016/j.matchemphys.2004.03.005
- S. Brahma, R. N. P. Choudhary and A. K. Thakur, “AC impedance analysis of LaLiMo2O8 electroceramics,” Physica B: Condensed Matter, Vol. 355, No. 1-4, 2005, pp. 188-201. doi:10.1016/j.physb.2004.10.091
- J. R. Macdonald, “Impedance Spectroscopy Emphasizing Solid Materials and Systems,” Wiley, New York, 1987.
- J. Suchanicz, “The Low-Frequency Dielectric Relaxation Na0.5Bi0.5TiO3 ceramics,” Materials Science and Engineering: B, Vol. 55, No. 1-2, 1998, pp. 114-118. doi:10.1016/S0921-5107(98)00188-3
- C. K. Suman, K. Prasad and R. N. P. Choudhary, “Complex Impedance Studies on Tungsten-Bronze Electroceramic: Pb2Bi3LaTi5O18,” Journal of Materials Science, Vol. 41, No. 2, 2006, pp. 369-375. doi:10.1007/s10853-005-2620-5
- S. Chatterjee, P. K. Mahapatra, R. N. P. Choudhary and A. K. Thakur, “Complex impedance studies of sodium pyrotungstate—Na2W2O7,” physica status solidi (a), Vol. 201, No. 3, 2004, pp. 588-595. doi:10.1002/pssa.200306741
- F. Borsa, D. R. Torgeson, S. W. Martin and H. K. Patel, “Relaxation and fluctuations in glassy fast-ion conductors: Wide-Frequency-Range NMR and Conductivity Measurements,” Physical Review B, Vol. 46, No. 2, 1992, pp. 795-800. doi:10.1103/PhysRevB.46.795
- V. Provenzano, L. P. Boesch, V. Volterra, C. T. Moynihan and P. B. Macedo, “Electrical Relaxation in Na2O·3SiO2 Glass,” Journal of the American Ceramic Society, Vol. 55, No. 10, 1972, pp. 492-496. doi:10.1111/j.1151-2916.1972.tb13413.x
- H. Jain and C. H. Hsieh, “‘Window’ effect in the analysis of Frequency Dependence of Ionic Conductivity,” Journal of Non-Crystalline Solids, Vol. 172-174, 1994, pp. 1408-1412. doi:10.1016/0022-3093(94)90669-6
- I. M. Hodge, M. D. Ingram and A. R. West, “A new method for analysing the a.c. behaviour of Polycrystalline Solid Electrolytes,” Journal of Electroanalytical Chemistry and Interfacial Electrochemistry, Vol. 58, No. 2, 1975, pp. 429-432. doi:10.1016/S0022-0728(75)80102-1
- P. B. Macedo, C. T. Moynihan and R. Bose, Physics and Chemistry of Glasses, Vol. 13, 1972, p. 171.
- K. Funke, “Jump relaxation in solid electrolytes,” Progress in Solid State Chemistry, Vol. 22, No. 2, 1993, pp. 111-195. doi:10.1016/0079-6786(93)90002-9
- R. N. P. Choudhary, D. K. Pradhan, C. M. Tirado, G. E. Bonilla and R. S. Katiyar, “Effect of La substitution on structural and electrical properties of Ba(Fe2/3W1/3)O3 nanoceramics,” Journal of Materials Science, Vol. 42, No. 17, 2007, pp. 7423-7432. doi:10.1007/s10853-007-1835-z
- A. K. Joncher, Physics of Thin Films, Vol. 11, 1980, p. 232.
NOTES
*Corresponding author.

