American Journal of Plant Sciences
Vol.05 No.26(2014), Article ID:52907,7 pages
10.4236/ajps.2014.526418
Effect of Row Spacing on Seed Isoflavone Contents in Soybean [Glycine max (L.) Merr.]
Bobby Ragin1, Masum Akond1, Stella Kantartzi2, Khalid Meksem2, Harmin Herrera3, Cevdet Akbay3, David A. Lightfoot2, My Abdelmajid Kassem1,4*
1Plant Genomics and Biotechnology Lab, Department of Biological Sciences, Fayetteville State University, Fayetteville, NC, USA
2Department of Plant, Soil and Agricultural Systems, Southern Illinois University, Carbondale, IL, USA
3Department of Chemistry and Physics, Fayetteville State University, Fayetteville, NC, USA
4The School of Arts and Sciences, American University of Ras Al Khaimah, Ras Al Khaimah, United Arab Emirates
Email: *mkassem@uncfsu.edu
Copyright © 2014 by authors and Scientific Research Publishing Inc.
This work is licensed under the Creative Commons Attribution International License (CC BY).
http://creativecommons.org/licenses/by/4.0/


Received 1 October 2014; revised 3 November 2014; accepted 9 December 2014
ABSTRACT
Soybean isoflavones compounds such as genistein, daidzein, and glycitein have numerous human health benefits including the reduction of risks of cardiovascular diseases, breast and prostate cancers, and menaupose symptoms in women. Understanding the genetic and environmental control of isoflavones accumulation is of great importance for developing new cultivars with high amounts of seed isoflavones. This study was conducted to analyze the effect of row spacing (25 cm vs. 50 cm) on seed isoflavones accumulation using a recombinant inbred line (RIL) population derived from the cross of PI 438489B and “Hamilton” (PIxH, n = 50). The two row spaces generated plant densities of 250,000 plants/ha and 90,000 plants/ha, respectively. Significant differences in soybean seed isoflavones (daidzein, genistein and glycitein) contents have been observed between plants grown in the two different plant densities. The mean daidzein content was 0.03458 µg・g−1 in plants grown in 50 cm row spaces (low plant density), which was significantly higher than its content (0.03019 µg・g−1) in plants grown in 25 cm row spaces (high plant density). Similarly, the mean glycitein content in plants grown in 50 cm row spaces (0.01905 µg・g−1) was significantly higher than its content in plants grown in 25 cm row spaces (0.00498 µg・g−1). Also, the mean genistein content in plants grown in 50 cm row spaces (0.01466 µg・g−1) was higher than its content in plants grown in 25 cm row spaces (0.00831 µg・g−1). These preliminary results are important in guiding farmers and breeders on choosing the best row spaces to grow soybean plants in order to optimize isoflavones contents. Further studies are needed to understand the correlation between seed isoflavones contents and other agronomic traits such as seed yield, protein, and oil contents.
Keywords:
Daidzein, Genistein, Glycitein, Row Space, Plant Density

1. Introduction
Soybeans [Glycine max (L.) Merr.] are one of the major cash crops in the United States with a wide variety of benefits forhuman health. Due to cultural practices and environmental stimuli, farmers are constantly faced with the rise of production costs and the decline on crop yields in many regions. To increase yield, farmers, breeders, and scientists tried tillage system, herbicide technology, and row spacing in several crops including soybean [1] -[7] .
Several studies reported that higher yields are obtained in plants grown in low row spaces compared to plants grown in high row spaces in rice [8] , cotton [3] [5] , Cuphea (Cuphea viscosissima Jacq.) [9] , sorghum [10] , and soybean [2] [6] . In rice, higher biomasses were observed in plants grown under low row spaces 18, 21, and 24 cm compared to high row spaces 27, 30, and 33 cm [8] . Cotton plants grown in 38 cm row spaces had higher yield compared to plants grown in 102 cm row spaces [5] . In another study, cuphea plans were grown in 38, 56, and 74 cm row spaces and data showed that plants grown in low row spaces show higher biomass and seed yield [9] . In sorghum, two cultivars in 2008 and 5 cultivars in 2009 have been grown in 10 - 15, 37.5, and 74 cm row spaces. Data showed no changes in biomass yield (Dry Matter, DM t・ha−1); however, cultivar Goliah showed higher DM yield than all the other tested cultivars. Moreover, higher sugar contents have been found in cultivar Aron grown in the lowest row space, 37.5 cm [10] . In soybean, a study found that plants grown in 45 cm row spaces had higher yields (3997 kg・ha−1) compared to those grown in 60 cm (3130 kg・ha−1) and 90 cm row spaces (2490 kg・ha−1) [2] . Another study found that soybean plants grown in 25 cm row spaces have higher yield (2470 kg・ha−1) compared to plants grown in 100 cm row spaces (2108 kg・ha−1) [1] . In this population, we found that plants grown in 25 cm row spaces had higher 100-seed weight, total seed weight, pod, and seed num- bers compared to plants grown in 50 cm [11] .
The fact that soybean seed isoflavone contents are genotype and environment dependent is well established [12] - [16] ; however, very few studies investigated the effect of row spacing on seed composition including seed isoflavone contents [6] [17] . For example, Rahman et al. [6] found that a decrease in row spacing promoted an increase in seed protein contents in two soybean cultivars PB-1 and G-2 while the contents of several minerals decreased with a decrease in row spacing [6] . Al-Tawaha and Seguin [17] studied the effects of row spacing, planting date, and weed on seed isoflavone contents and other seed components. They found that row spacing has no effect on seed isoflavone contents; however, these contents increased by 9% in the presence of weeds [17] . Negative correlations have been found between yield crude protein (CP) and seed yield, and seed isoflavone contents [17] . Isoflavones overall contents are greater in early soybean planting system (ESPS, April) compared to conventional soybean planting system (CSPS, June) [17] . Further studies are needed to investigate the effects of row spacing on seed isoflavone contents as well as the correlations between seed yield and isoflavone contents.
This study was designed to investigate the effect of row spacing on seed isoflavone contents by growing the PI 438489B by “Hamilton” recombinant inbred line (RIL) population in early soybean planting system (ESPS) in two different row spaces, 25 cm and 50 cm which generate 250,000 and 90,000 plants/ha, respectively.
2. Material and Methods
2.1. Plant Material
In this study, soybean line PI 438489B, cultivar “Hamilton”, and their recombinant inbred lines (RILs) (n = 50) were used. The PI 438489B by “Hamilton” recombinant inbred line population [18] was provided to us by Dr. Khalid Meksem of Southern Illinois University. Several soybean RIL populations have been used to genetically map quantitative trait loci (QTL) in soybean and we used this population for both QTL mapping and row spacing effects on isoflavones contents.
2.2. Growing Conditions
In the greenhouse, 4 seeds of parents, PI 438489B and Hamilton, and each RIL were sown in pots (15 × 14 cm) filled with potting soil at 25˚C ± 1˚C temperature and under natural daylight. After 3 weeks, the plants were transferred into a sandy field in St. Pauls, NC (34˚48'26''N 78˚58'22''W and 170 feet above sea level; Robeson County). Two groups of plants were grown in the greenhouse and transferred randomly into the same field; Group I was planted with 25 cm row spaces between plants and the Group II was planted with 50 cm row spaces between plants. The plants were watered and kept in the field until maturity of all RILs and parents. No pesticide or herbicide was applied in the greenhouse or field.
2.3. Trait Measurements and Statistical Data Analysis
Days to germination (DG) were recorded in the greenhouse and days to flowering (DF) were recorded in the field. Plant height (PH) was recorded at maturity of parents and all RILs, just before harvest (120 days). Plants have been pulled from the ground gently with their roots and brought to the lab to measure pod numbers (PN), seed numbers (SN), 100-seed weight (g) (100SW), and total seed weight (g) (TSW). All these measurements were recorded for both Group I (25 cm row spacing) and Group II (50 cm row spacing). Concentration of seed isoflavones was analyzed using HPLC machine from Qiagen Inc. (Germantown, MD).
2.4. Isoflavones Extraction and Quantification
Three seed isoflavones daidzein, genistein, and glycitein were extracted and quantified in µg・g−1 of seed by a near-infrared reflectance (NIR) diode array feed analyzer (Perten, Springfield, IL, USA) as described earlier [6] [19] . Means, ranges, and standard deviations for seed genistein, glycitein, and daidzein contents were estimated for the parents and RILs based on three replicates per plant.
2.5. Data Analysis
Statistical data analysis was done using SPSS program and descriptive analysis, paired samples test, T-test, and Pearson correlations were performed to evaluate the mean seed isoflavone contents in the population and to see if there are significant differences in these isoflavones in the two groups (Group I and II).
3. Results
Means, standard deviations, ranges and co-efficient of variation for seed isoflavone contents in parents and RILs are shown in Table 1 and Table 2. The results showed that seed daidzein, genistein, and glycitein contents of Group II plants are higher than those of Group I plants. The lowest coefficients of variation (CV) were found for daidzein in Group II plants (0.80%) and glycitein in Group II plants (0.87%) while the highest CV values are found for glycitein in Group I plants and for genistein in Group II plants (Table 1). The frequency distributions of seed daidzein, genistein, and glycitein contents in the RILs are not normal and showed skewness towards the low isoflavones contents for all the three isoflavones in the two groups (Figure 1).
The RILs showed 1.6 - 6 folds high contents than both parents for all the three isoflavones in plants of both Groups I and II (Figure 2 and Figure 3). The RILs also showed high contents of daidzein then glycitein, then genistein, respectively in both row spaces (Figure 2 and Figure 3). “Hamilton” plants grown in both 25 cm (Group I) and 50 cm (Group II) row spaces showed higher contents of glycitein and genistein (Figure 2) than PI 438489B plants grown in the same row spaces. However, “Hamilton” plants grown in 50 cm row spaces showed higher daidzein contents than PI 438489B plants grown in the same row spaces while the opposite is true for plants grown in 25 cm row spaces (Figure 2 and Figure 3).
A paired-samples T-test was used to elucidate whether there was a statistically significant mean difference between the isoflavone concentrations of diadzein, genistein and glycitein in the RILs, PI 438489B, and “Hamilton” planted at 25 cm and 50 cm row spaces. Table 1 shows that levels of isoflavone elicited a difference of −0.00439 µg・g−1 (95% CI, −0.0208 to 0.0120) when comparing daidzein at 25 cm to 50 cm row spacing (t(27) = −0.548, p < 0.05). When comparing glycitein at 25 cm and 50 cm, isoflavone levels displayed a difference of −0.0141 µg・g−1 (95% CI, −0.0207 to −0.0074) and a t(27) = −4.351, p < 0.05. Last, when comparing genistein at (25 cm and 50 cm) row spacing, levels showed a difference of −0.00635 µg・g−1 (95% CI, −0.0143 to 0.0016) with the t(27) = −1.636, p < 0.005, respectively.

Table 1. Description of mean, standard deviation, range, maximum and minimum of genistein, daidzein, and glycitein in two row spaces (25 cm and 50 cm) of PI 438489B by Hamilton and their recombinant inbred lines (RILs).
Pair 1, 2, and 3; Comparisons of daidzein, glycitein, and genisten contents in Group I and II plant seeds, respectively.
Table 2. Paired samples test. The Pearson correlation of daidzein (Dai), genistein (Gen), and glycitein (Gly) contents between Group I and Group II RILs. Seed isoflavone amounts are expressed in µg・g−1 of seed weight.
The (t) indicates comparison to the t-distribution, the (27) represents the degree of freedom which is (n − 1) and the numbers equal the obtained value or the value of the t-statistic. The (p < 0.05) indicates the probability of obtaining the given t-value. A paired sample statistic test was used to determine the effectiveness of planting at difference row spacing. Results showed that isoflavone contents are higher in plants of Group II [Daidzein (0.0346 ± 0.005 µg・g−1), genistein (0.0147 ± 0.004 µg・g−1), and glycitein (0.0191 ± 0.003 µg・g−1)] compared to plants of Group I [Daidzein (0.0302 ± 0.007 µg・g−1), genistein (0.0083 ± 0.001 µg・g−1) and glycitein (0.0050 ± 0.001 µg・g−1)] (Table 2 and Table 3; Figure 2 and Figure 3). The Pearson correlation between the two plant groups showed that glycitein and genistein contents were significantly higher in Group II than Group I plants with values of 0.626 and 0.591, respectively (Table 4).
4. Discussion
This study was conducted to study the effect of row spacing (plant densities) on seed isoflavone accumulation using the recombinant inbred line (RIL) population derived from the cross of PI 438489B and Hamilton. Previous studies showed that high yields are obtained from plants grown in high plant densities (low row spaces) compared to plants grown in low plant densities (high row spaces) in rice [8] , maize [20] [21] , cotton [3] [5] , Cuphea (Cuphea viscosissima Jacq.) [9] , sorghum [10] , and soybean [2] [6] [11] [22] . However, only one study reported the influence of row spacing on seed isoflavone contents [17] . In an earlier study, we used the “Flyer” by “Hartwig” RIL population (F × H, n = 92) and measured days to germination (DG), plant height (PH), days to flowering (DF), 100-seed weight (SW), pod number (PN), seed number (SN), harvest index (HI), root dry weight (RDW), shoot fresh weight (SFW), root fresh weight (RFW), shoot dry weight (SDW), lateral root number (LRN), and maximum root length (MRL) in plants grown in early soybean planting system (ESPS, April) and conventional soybean planting system (CSPS, June) [22] . We found significant differences for all measured traits except RFW and LRN [22] . SW decreased by 74.7%, PH by 41.96%, PN by 65.2%, HI by 73.3%, and SN by 64.9% in plants grown in CSPS compared to plants grown in ESPS [22] . Interestingly, Al-Tawaha and Seguin [17] found that the overall isoflavone contents are greater in ESPS compared to CSPS [17] .
Our results showed that there are highly significant differences for genistein and glycitein contents in plants of Group I compared to plants of Group II. These contents are higher in Group II (50 cm row spaces) compared
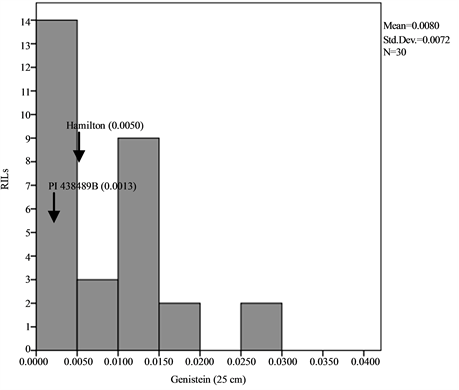
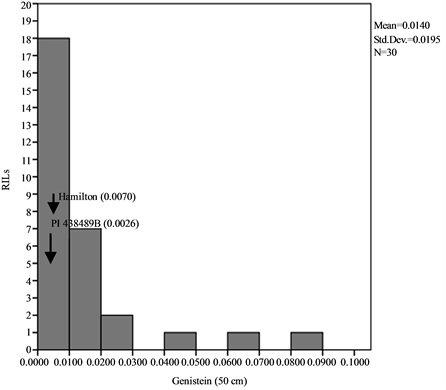
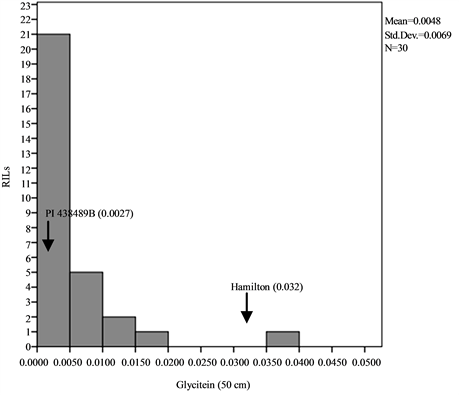
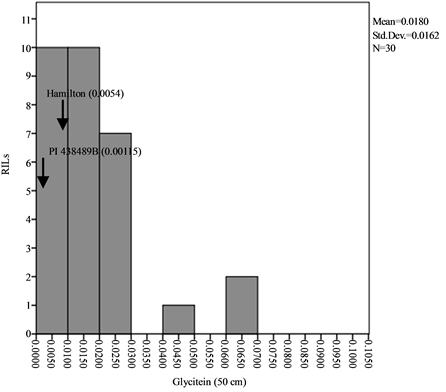
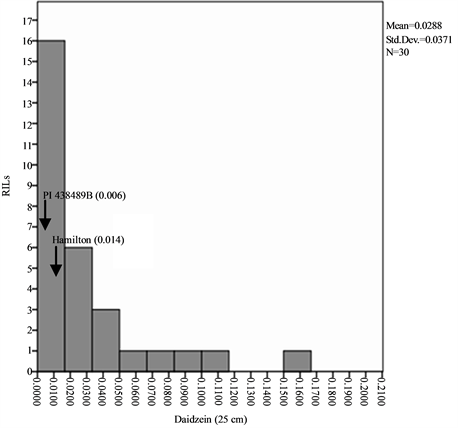
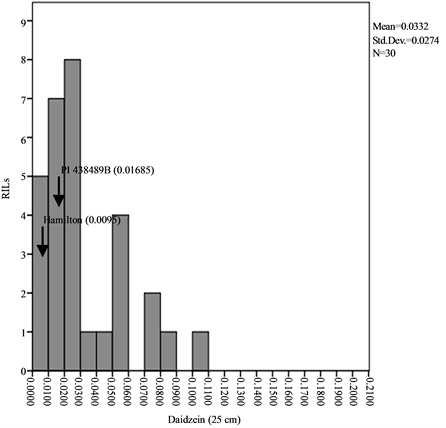
Figure 1. Frequency distribution of seed isoflavone contents of PI 438489B by Hamilton RILs plants grown in two row spaces (25 cm and 50 cm). Seed isoflavone amounts are expressed in µg・g−1 of seed weight.
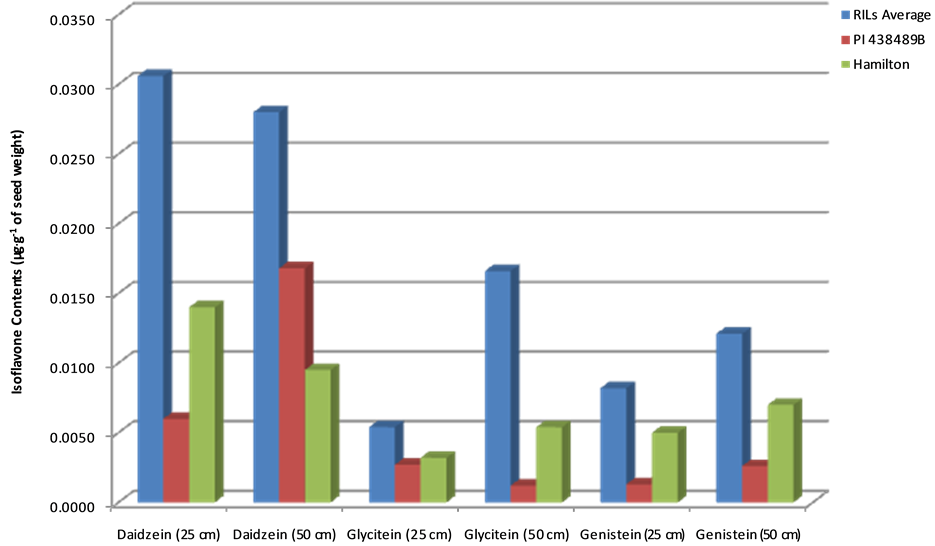
Figure 2. Comparison of levels of isoflavone contents between parent and offspring. Seed isoflavone amounts are expressed in µg・g−1 of seed weight.
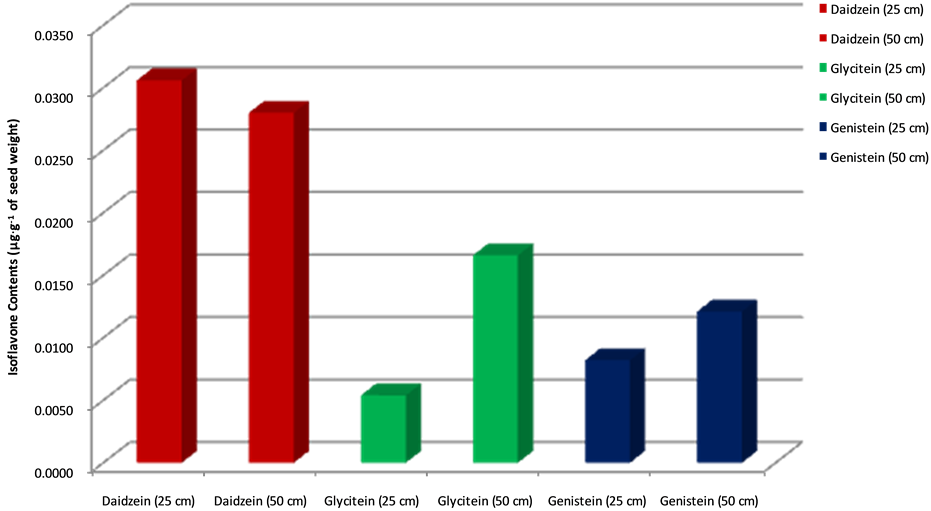
Figure 3. Comparison of isoflavone contents in plants grown at 25 cm vs. 50 cm row spaces. Seed isoflavoneamounts are expressed in µg・g−1 of seed weight.
to Group I plants (25 cm row spaces) which is in disagreement with the previous and only study that reported no effect of row spacing on seed isoflavone contents [17] . Another study reported that an increase in protein content was promoted by a decrease in row spacing in two soybean cultivars PB-1 and G-2 while the contents of several minerals decreased [6] . Al-Tawaha and Seguin [17] found negative correlations between yield crude protein (CP)
Table 3. T-test showing summary of paired statistics for the two experimental conditions for seed daidzein (Dai), genistein (Gen), and glycitein (Gly) contents between Group I and Group II RILs. Seed isoflavone amounts are expressed in µg・g−1 of seed weight.
Pair 1, 2, and 3; Comparisons of daidzein, glycitein, and genisten contents in Group I and II plant seeds, respectively.
Table 4. The Pearson correlation of seed isoflavone contents in the two plant Group I (grown with 25 cm row spaces) and Group II (grown with 50 cm row spaces).
Pair 1, 2, and 3; Comparisons of daidzein, glycitein, and genisten contents in Group I and II plant seeds, respectively.
and seed yield, and seed isoflavone contents. A prolonged drought stress during the stages of seed development drastically reduces the accumulation of seed isoflavone contents [23] [24] . However, Caldwell et al. [23] found that drought combined with high levels of CO2 at 23˚C promoted the levels of 6′-O-malonygenistin and genistin [23] .
While the results presented here shed some light on the effect of row spacing on seed isoflavone contents, further studies are needed using different cultivars and/or populations as well as studies on the correlations between seed yield and isoflavone contents.
Acknowledgements
The authors would like to thank the Department of Defense (DOD) for funding this work through the grant# W911NF-11-1-0178 to MAK and SK. I would also like to thank all the undergraduate students who helped care for plants in greenhouse and fields. Many thanks to AURAK for its partial payment of the publication fee.
References
- Taylor, H.M., Mason, W.K., Bennie, A.T.P. and Rowse, H.R. (1982) Responses of Soybeans to Two Row Spacings and Two Soil Water Levels. I. An Analysis of Biomass Accumulation, Canopy Development, Solar Radiation Interception and Components of Seed Yield. Field Crops Research, 5, 1-14. http://dx.doi.org/10.1016/0378-4290(82)90002-8
- Anaele, A.O. and Bishnoi, U.R. (1992) Effects of Tillage, Weed Control Method and Row Spacing on Soybean Yield and Certain Soil Properties. Soil and Tillage Research, 23, 333-340. http://dx.doi.org/10.1016/0167-1987(92)90079-Q
- Jost, P.H. and Cothren, J.T. (2000) Growth and Yield Comparisons of Cotton Planted in Conventional and Ultra-Nar- row Row Spacings. Crop Science, 40, 430-435. http://dx.doi.org/10.2135/cropsci2000.402430x
- Clawson, E.L., Cothren, J.T. and Blouin, D.C. (2006) Nitrogen Fertilization and Yield of Cotton in Ultra-Narrow and Conventional Row Spacing. Agronomy Journal, 98, 72-79. http://dx.doi.org/10.2134/agronj2005.0033
- Balkcom, S.K., Price, A.J., Van Santen, E., Delaney, D.P., Boykin, D.L., Arriaga, F.J., Bergtold, J.S., Kornecki, T.S. and Raper, R.L. (2010) Row Spacing, Tillage System, and Herbicide Technology Affects Cotton Plant Growth and Yield. Field Crops Research, 117, 219-225. http://dx.doi.org/10.1016/j.fcr.2010.03.003
- Rahman, M., Hossain, M., Anwar, M. and Juraimi, A.S. (2011) Plant Density Influence on Yield and Nutritional Quality of Soybean Seed. Asian Journal of Plant Sciences, 10, 125-132. http://dx.doi.org/10.3923/ajps.2011.125.132
- Worku, M. and Astatkie, T. (2011) Row and Plant Spacing Effects on Yield and Yield Components of Soybean Varieties under Hot Humid Tropical Environment of Ethiopia. Journal of Agronomy and Crop Science, 197, 67-74. http://dx.doi.org/10.1111/j.1439-037X.2010.00441.x
- Zhao, H.-X., Wang, X.-X., Guo, Z.-H., Huang X.-Q. and Liu, H.-L. (2012) Effects of Row-Spacing on Canopy Structure and Yield in Different Plant Type Rice Cultivars. Journal of Northeast Agricultural University, 19, 11-19. http://dx.doi.org/10.1016/S1006-8104(13)60045-8
- Gesch, R.W., Kim, K.I. and Forcell, F. (2010) Influence of Seeding Rate and Row Spacing on Cuphea Seed Yield in the Northern Corn Belt. Industrial Crops and Products, 32, 692-695. http://dx.doi.org/10.1016/j.indcrop.2010.07.017
- Mahmood, A. and Honermeier, B. (2012) Chemical Composition and Methane Yield of Sorghum Cultivars with Contrasting Row Spacing. Field Crops Research, 128, 27-33.
- Akond, M., Ragin, B., Bazzelle, R., Clark, W., Kantartzi, S.K., Meksem, K. and Kassem, M.A. (2013) Effect of Two Row Spacing on Several Agronomic Traits in Soybean. Atlas Journal of Plant Biology, 1, 18-23. http://dx.doi.org/10.5147/ajpb.2013.0073
- Hoeck, J.A., Fehr, W.R., Murphy, P.A. and Welke, G.A. (2000) Influence of Genotype and Environment on Isoflavone Contents of Soybean. Crop Science, 40, 48-51. http://dx.doi.org/10.2135/cropsci2000.40148x
- Meksem, K., Njiti, V.N., Banz, W.J., Iqbal, M.J., Kassem, M.A., Hyten, D.L., Yuang, J., Winters, T.A. and Lightfoot, D.A. (2001) Genomic Regions That Underlie Soybean Seed Isoflavone Content. Journal of Biomedicine and Biotechnology, 1, 38-44. http://dx.doi.org/10.1155/S1110724301000110
- Kassem, M.A., Meksem, K., Iqbal, M.J., Wood, A.J. and Lightfoot, D.A. (2004) Definition of Soybean Genomic Regions That Control Seed Phytoestrogen Amounts. Journal of Biomedicine and Biotechnology, 1, 52-60. http://dx.doi.org/10.1155/S1110724304304018
- Kassem, M.A., Shultz, J., Meksem, K., Cho, Y., Wood, A.J., Iqbal, M.J. and Lightfoot, D.A. (2006) An Updated “Essex” by “Forrest” Linkage Map and First Composite Map of QTL Underlying Six Soybean Traits. Theoretical and Applied Genetics, 113, 1015-1026. http://dx.doi.org/10.1007/s00122-006-0361-8
- Akond, M., Liu, S., Kantartzi, S.K., Meksem, K., Bellaloui, N., Lightfoot, D.A., Yuan, J., Wang, D. and Kassem, M.A. (2014) Quantitative Trait Loci for Seed Isoflavone Contents in “MD96-5722” by “Spencer” Recombinant Inbred Lines of Soybean. Journal of Agricultural and Food Chemistry, 62, 1464-1468. http://dx.doi.org/10.1021/jf4040173
- Al-Tawaha, A.M. and Seguin, P. (2006) Seeding Date, Row Spacing, and Weed Effects on Soybean Isoflavone Concentrations and Other Seed Characteristics. Canadian Journal of Plant Science, 86, 1079-1087. http://dx.doi.org/10.4141/P06-043
- Yue, P., Arelli, P.R. and Sleper, D.A. (2001) Molecular Characterization of Resistance to Heterodera glycines in Soybean “PI 438489B”. Theoretical and Applied Genetics, 102, 921-928. http://dx.doi.org/10.1007/s001220000453
- Bellaloui, N., Mengistu, A.L., Zobiole, H. and Shier, W.T. (2012) Resistance to Toxin-Mediated Fungal Infection: Role of Lignins, Isoflavones, Other Seed Phenolics, Sugars, and Boron in the Mechanism of Resistance to Charcoal Rot Disease in Soybean. Toxin Reviews, 31, 16-26. http://dx.doi.org/10.3109/15569543.2012.691150
- Maddonni, G.A., Otegui, M.E. and Cirilo, A.G. (2001) Plant Population Density, Row Spacing and Hybrid Effects on Maize Canopy Architecture and Light Attenuation. Field Crops Research, 71, 183-193. http://dx.doi.org/10.1016/S0378-4290(01)00158-7
- Turgut, I., Duman, A., Bilgili, U. and Acikgoz, E. (2005) Alternate Row Spacing and Plant Density Effects on Forage and Dry Matter Yield of Corn Hybrids (Zea mays L.). Journal of Agronomy and Crop Science, 191, 146-151. http://dx.doi.org/10.1111/j.1439-037X.2004.00146.x
- Ouertani, K., Washington, E., Lage, P., Kantartzi, S.K., Lightfoot, D.A. and Kassem, M.A. (2011) Comparison of Early and Conventional Soybean Production Systems for Yield and Other Agronomic Traits. Atlas Journal of Plant Biology, 1, 1-5. http://dx.doi.org/10.5147/ajpb.2011.0008
- Caldwell, C.R., Britz, S.J. and Mirecki, R.M. (2005) Effect of Temperature, Elevated Carbon Dioxide, and Drought during Seed Development on the Isoflavone Content of Dwarf Soybean [Glycine max (L.) Merrill] Grown in Controlled Environments. Journal of Agricultural and Food Chemistry, 53, 1125-1129. http://dx.doi.org/10.1021/jf0355351
- Gutierrez-Gonzalez, J.J., Guttikonda, S.K., Tran, L.S.P., Aldrich, D.L., Zhong, R., Yu, O. and Sleper, D.A. (2010) Differential Expression of Isoflavone Biosynthetic Genes in Soybean during Water Deficits. Plant and Cell Physiology, 51, 936-948. http://dx.doi.org/10.1093/pcp/pcq065
NOTES

*Corresponding author.